Introduction
Despite its rapid economic growth in the last several decades, in 2005 China still had 254 million people living below the international poverty standard – US$1.25 per day in 2005 Purchasing Power Parity (PPP) dollars (the World Bank, 2009). Income poverty in China has been widely acknowledged and studied, but much less is known about asset poverty. Assets are stocks of resources owned by households at a certain point of time, including a home, business, savings, stocks and bonds, among others. Asset poverty then refers to insufficiency of assets to satisfy household basic needs for a limited period of time (Haveman and Wolff, Reference Haveman and Wolff2001).
Compared to income, assets not only serve as a storehouse for future consumption to protect household economic security, but are also an important facilitator of economic development (Caner and Wolff, Reference Caner and Wolff2004; Nam et al., Reference Nam, Huang, Sherraden, McKernan and Sherraden2008). Household assets are an important determinant of income in the long run (Brandolini et al., Reference Brandolini, Magri and Smeeding2010), affecting an individual's opportunities for education, homeownership, business startup and achievement of economic aspirations (Sherraden, Reference Sherraden1991; Caner and Wolff, Reference Caner and Wolff2004; Schneider, Reference Schneider2004). To study asset poverty will add valuable insights into the conventional income-poverty analysis.
Using the 2002 survey data of the Chinese Household Income Project (CHIP), this study (1) estimates asset-poverty rates in urban China based on various asset-poverty lines, (2) examines the interaction between asset poverty and income poverty and (3) explores potential factors contributing to asset poverty in urban China. This study provides valuable information on asset poverty in China, and contributes to the literature in which estimates of asset poverty are available only for several developed countries (Azpitarte, Reference Azpitarte2011; Brandolini et al., Reference Brandolini, Magri and Smeeding2010; Caner and Wolff, Reference Caner and Wolff2004; Haveman and Wolff, Reference Haveman and Wolff2001; Kim and Kim, Reference Kim and Kim2013). In addition to estimating asset-poverty rates in urban China, the study also explores the relationship between asset poverty and income poverty as well as the possible effects that China's policy transitions and policy changes in the past decades have had on asset poverty.
Background
Asset-poverty research
Poverty research primarily focuses on income only, despite efforts to include assets in poverty measures as well (Nam et al., Reference Nam, Huang, Sherraden, McKernan and Sherraden2008; Brandolini et al., Reference Brandolini, Magri and Smeeding2010). Haveman and Wolff (Reference Haveman and Wolff2001) categorise households as asset poor if their access to asset-type resources ‘is insufficient to enable them to meet its basic needs for some limited period of time’. Haveman and Wolff (Reference Haveman and Wolff2001) and Caner and Wolff (Reference Caner and Wolff2004) set this ‘period of time’ at three months based on the estimated duration of unemployment (2.2–4.2 months), a major event causing economic hardship. ‘Basic needs’ is measured by the household-size conditioned poverty threshold proposed by a National Academy of Sciences panel in the US (Citro and Michael, Reference Citro and Michael1995). Haveman and Wolff (Reference Haveman and Wolff2001) and Caner and Wolff (Reference Caner and Wolff2004) estimate asset-poverty rates with three forms of assets, including net worth, net worth minus home equity and liquid assets. Net worth is defined as the sum of all marketeable assets less the value of all debts. Liquid assets include the values of cash and other kinds of easily monetisable asset items.
According to Caner and Wolff (Reference Caner and Wolff2004), the US asset-poverty rate in 1999 was 26 per cent when measured with net worth, 40 per cent with net worth minus home equity and 42 per cent with liquid assets. The level of asset poverty stayed almost the same from 1984 to 1999. Generally, asset-poverty rates are two to four times higher than the income-poverty rate (Caner and Wolff, Reference Caner and Wolff2004). Households headed by disadvantaged populations – such as ethnic minority groups, females, individuals with children, individuals with low educational attainment and renters – are more likely to experience asset poverty (Haveman and Wolff, 2004; Lusardi et al., Reference Lusardi, Schneider and Tufano2011).
A similar pattern of asset poverty has been identified in other developed countries. Using the data from the Luxembourg Wealth Study, Brandolini et al. (Reference Brandolini, Magri and Smeeding2010) study asset poverty in several wealthy countries (including Canada, Finland, Germany, Italy, Norway, Sweden, the UK and the US), and report that the asset-poverty rate is two to three times the income-poverty rate in most of these countries. For example, the UK asset-poverty rate in 2000 was 25 per cent measured with net worth and 46 per cent measured with liquid assets, higher than the income-poverty rate of 15 per cent.
However, few studies examine asset poverty in developing countries. Based on the existing literature on asset poverty, this study examines asset poverty in urban China using the 2002 survey data of the Chinese Household Income Project (CHIP), and constitutes an important addition to the literature.
Asset distribution in urban China
Household assets have grown substantially since China's reform in the late 1970s (Zhao and Ding, Reference Zhao, Ding, Gustafsson, Li and Sicular2008). Estimates from the CHIP show that the mean household net worth increased from 66,747 yuan (Li et al., Reference Li, Wei and Gustafsson2000) to 306,000 yuan (Cheng, Reference Cheng2008) between 1995 and 2007. Asset inequality also widens, with the highest decile group owning 34 per cent of the total net worth, in contrast to only 2.8 per cent owned by the two lowest decile groups (Zhao and Ding, Reference Zhao, Ding, Gustafsson, Li and Sicular2008). The Gini coefficient of asset distribution for urban areas was 0.48 in 2002 (Zhao and Ding, Reference Zhao, Ding, Gustafsson, Li and Sicular2008), 0.56 in 2005 and 0.58 in 2007 (Liang et al., Reference Liang, Huo and Liu2010).
Previous studies indicate that asset accumulation for urban households in China is highly related to household demographics and individual characteristics, including age, gender, health status, political status, occupation, education and income (Meng, Reference Meng2007; Liang et al., Reference Liang, Huo and Liu2010). These demographic characteristics likely affect household asset-poverty status as well. For example, female-headed households and those headed by individuals with excellent health, high income or membership in the Communist Party have more assets than their counterparts (Meng, Reference Meng2007; Liang et al., Reference Liang, Huo and Liu2010).
There are even contradicting findings about the relationship between asset accumulation and demographic characteristics. For instance, one study finds a hump-shaped age-savings profile: household assets peaked at age fifty in the 2005 data and at age sixty in the 2007 data (Liang et al., Reference Liang, Huo and Liu2010). Li et al. (Reference Li, Wei and Gustafsson2000), however, report a different savings pattern with two peaks at ages thirty-five to forty-four and sixty to sixty-four in urban China, and a recent study of Chamon and Prasad (Reference Chamon and Prasad2010) presents a U-shape age-savings profile, in contrast to Liang et al. (Reference Liang, Huo and Liu2010). In addition, a positive correlation is found between household assets and educational attainment in two studies (Meng, Reference Meng2007; Liang et al., Reference Liang, Huo and Liu2010) but not in Li et al. (Reference Li, Wei and Gustafsson2000).
An explanation for the variations in these findings, according to Chamon and Prasad (Reference Chamon and Prasad2010), is that household asset accumulation, to a large extent, is constructed by institutional and policy structures beyond individual and household characteristics. Different from many developed countries, institutional structures in China have changed drastically during recent economic and policy transitions, resulting in varied relationships between demographic characteristics and wealth accumulation. For instance, Meng (Reference Meng2007) and Zhao and Ding (Reference Zhao, Ding, Gustafsson, Li and Sicular2008) find that the housing reform policy in the early 1990s significantly contributed to asset inequality in urban China. Feng and his colleagues (Reference Feng, He and Sato2009) suggest that pension reform in the mid-1990s may also have changed household saving behavior. Wei and Zhang (Reference Wei and Zhang2009) argue that even the imbalanced sex ratio, a result related to the one child policy, has induced families with male children to favour asset accumulation over consumption. Asset distribution in current China is a product of ‘historically and culturally defined processes created by contemporaneous political, economic, and social forces’ (Davis and Feng, Reference Davis, Feng, Davis and Feng2009).
A series of economic reforms and institutional transitions in China have provided tremendous opportunities for asset accumulation. However, as reflected by increasing asset inequality, these opportunities are not equally distributed. Overall, political or economic elites have benefited most from these institutional arrangements, taking advantage of a multidimensional stratification system, including redistributive power, rent-seeking ability and market power (Davis and Feng, Reference Davis, Feng, Davis and Feng2009), and therefore are able to accumulate more assets than other groups (Meng, Reference Meng2007). Despite the widely acclaimed institutional changes in the reform process over the past three decades, many Chinese have been excluded from these asset accumulation opportunities. For instance, in the reform of state-owned enterprises, many urban workers lost out to managerial cadres and new capitalist owners during the sales of state-owned industrial assets to individuals. These economic reforms and institutional transitions are likely to affect asset poverty as well.
Data and methods
Data
The 2002 CHIP is a nationally representative data set developed by the Institute of Economics at the Chinese Academy of Social Sciences. The 2002 CHIP survey collects comprehensive information on household demographics, income sources, financial and physical assets and social benefit receipt, among others. The data are one of the few sources available to the public with full information on household wealth in China, and have been widely used, providing the basis for many books and journal articles (Gustafsson et al., Reference Gustafsson, Li, Sicular, Gustafsson, Li and Sicular2008). It is believed that this database contains fuller information than is usually available on wealth, income and related variables (Gustafsson et al., Reference Gustafsson, Li, Sicular, Gustafsson, Li and Sicular2008). To examine asset poverty in urban China, this study only includes the 2002 CHIP urban sample in the analysis. This sample includes twelve provinces from the eastern, central and western regions of China, and contains 6,835 households and 20,632 individuals from seventy-seven cities, representing 502.1 million people in urban areas of China (Gustafsson et al., Reference Gustafsson, Li, Sicular, Gustafsson, Li and Sicular2008). The geographic span of this sample allows the study to look into asset poverty of urban China at large.
Definition of asset poverty
Household assets
The study adopts the definition of asset poverty developed by Haveman and Wolff (Reference Haveman and Wolff2001): a household is considered asset poor if its assets are insufficient to enable the household to meet its basic needs for three months. Household assets are measured in three forms: net worth, net worth minus home equity and liquid assets. The 2002 CHIP provides information on multiple asset categories, including self-reported home equity, savings, stocks, bonds, money lent out, investment in enterprises or business, housing funds, commercial insurance, collections, durable goods, productive fixed assets and other assets. Net worth consists of all the asset categories mentioned above net of total household debts. Net worth minus home equity excludes home equity in the calculation of net worth. Liquid assets are the sum of stocks, bonds and savings in certificate deposits or regular savings accounts.
Asset-poverty line
The asset-poverty line refers to a minimum level of household consumption needs for a period of three months. For this study, we decided not to choose China's official poverty line (785 yuan per year in 2002) to measure household basic needs because it is based on a food-energy-intake method (2,100 calories per capita per day) for rural areas only. This rural poverty line is far below the international poverty standard and not considered appropriate for urban areas of China (Khan, Reference Khan2004).
Instead, we use three approaches to measure household basic needs in urban China. The first approach is the monthly Minimum Living Standard (MLS) set by local governments to determine a household's eligibility for Minimum Living Standard Assistance, the safety net for the urban poor (Gao et al., Reference Gao, Garfinkel and Zhai2009). The MLS is collected by the authors from official websites of local governments. As an estimation of the local monthly expenses on basic necessities, the MLS uses a per capita approach, and takes into consideration about 20 essential goods and services, including food, clothing, shelter, utility, medical care and tuition expenses (Chen and Barrientos, Reference Chen and Barrientos2006). We create an MLS-based measure of household basic needs by multiplying the MLS and household size. Given that there is no official poverty line for urban China and that the MLS is too low to cover household basic needs (Gao et al., Reference Gao, Garfinkel and Zhai2009), the study also uses two other approaches to measure basic needs. The approach developed by Khan (Reference Khan2004), for urban China in particular, sets basic needs at 211 yuan per capita per month, almost two times the World Bank poverty line (US$1.25 per day in 2005 PPP dollars). The multiplication of 211 yuan and household size then is considered a measure of basic needs at the household level. The third approach defines monthly minimum expenditure at the household level reported by household heads in the CHIP as an indicator of household basic needs. This approach considers poverty from the perspective of consumption rather than income and provides a measure of subjective well-being.
With these three approaches in mind, the asset-poverty line is the product of household basic needs defined above and a reference period of three months. This, therefore, creates three asset-poverty lines: one based on the MLS, one based on Khan's poverty line and one based on the self-reported minimum expenditure. The idea is to use all three in estimating asset-poverty rates, which may allow the researchers to get closer to what it truly is.
Other measures
To examine the characteristics of asset-poor households, the study includes two groups of demographic variables. Household head's characteristics include gender, age (twenty to twenty-nine, thirty to thirty-nine, forty to forty-nine, fifty to fifty-nine and sixty and above), employment status (employed or not), ethnic groups (Han versus minority groups), marital status (married versus otherwise), health condition (very good versus otherwise), political party (Communist Party versus otherwise) and education (less than high school, high school or equivalent, two to three years of college and four years of college or above). Household characteristics are household size, presence of a child in the household (younger than eighteen), presence of an elderly adult in the household (older than sixty-four) and household income quartiles.
Analytic strategy
The study uses both univariate and multivariate analyses to examine asset poverty in urban China and its associations with income poverty and demographic characteristics. The sample has few missing values, so we use listwise deletion in all analyses.
Results
Sample characteristics
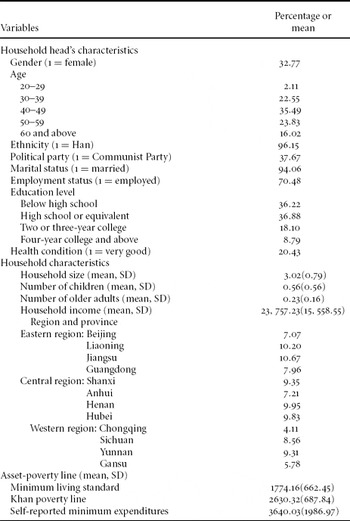
The first column of Table 1 reports demographic characteristics of the study sample. Of the 6,385 households, 33 per cent are headed by females. Most household heads are middle aged, and only 2 per cent are younger than thirty years old. A small proportion of household heads are members of ethnic minority groups (5 per cent), and 38 per cent are members of the Communist Party of China. Most household heads are married (94 per cent) and employed (70 percent). About one-third of householders have educational attainment below high school, and another one-third have a high school diploma or equivalent. Nearly 20 per cent have two or three years of college, and 9 per cent have at least a bachelor's degree. Regarding health condition, 20 per cent of household heads report having ‘very good’ health. On average, there are 0.56 children and 0.23 older adults in these households. The mean household income in 2002 was 23,757 yuan (SD = 15,559 yuan). Table 1 also reports the percentages from each of the twelve provinces in the sample.
Sample characteristics of the 2002 CHIS (N = 6,835)

Note: Several demographic variables have less than 20 cases of missing values.
The means of the three asset-poverty lines proposed by the study are 1,774 yuan, 2,620 yuan and 3,640 yuan, respectively. The MLS, the lowest asset-poverty line in this study, is 70 per cent of Khan's line, and 50 per cent of the self-reported minimum household expenditure.
Household asset distribution in urban China
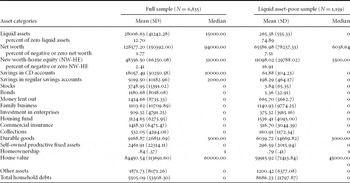
The first column of Table 2 describes the mean and median of liquid assets, net worth and net worth excluding home equity for the study sample. Distributions of asset categories are shown in the table as well. The mean and median liquid assets are 28,007 yuan and 15,000 yuan, respectively. The mean liquid assets are 1.2 times of the average household income (about 24,000 yuan). Nearly 13 per cent of households do not have any liquid assets.
Mean and median of household assets (N = 6,835)

The mean of liquid assets is about 20 per cent of the average household net worth (128,577 yuan), and 60 per cent of net worth net of home equity (48,357 yuan). Nearly 85 per cent of households in the sample are homeowners; home equity accounts for about two-third of the total net worth. In other words, a home seems to be the most commonly owned asset category and the most important asset for urban households. Other important asset categories are savings in certificate deposits and regular savings accounts, and durable goods.
Asset-poverty rates by different asset measures and asset-poverty lines
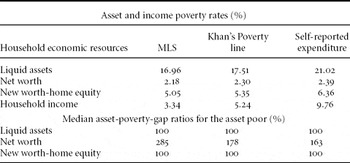
Table 3 shows estimated asset-poverty rates using the three different asset measures (liquid assets, net worth and net worth excluding home equity) and asset-poverty lines (the MLS, Khan's poverty line and the self-reported minimum household expenditure). The estimated asset-poverty rates show the shares of households living under asset-poverty lines. Among the three asset measures, liquid assets generate the highest estimates of asset-poverty rates: 17 per cent of households in the sample are asset poor according to the MLS asset-poverty line, which is five times the income-poverty rate (16.96/3.34 = 5.1). The liquid asset-poverty rate rises by less than one percentage point for Khan's poverty line and four percentage points for the self-reported minimum expenditure.
Asset poverty and income poverty in rural China (N = 6,835)

Less than 3 per cent of households have net worth insufficient to meet their consumption needs during a three-month period, regardless of which poverty line is used. When home equity is excluded from household net worth, asset-poverty rates rise to about 5 per cent or 6 per cent. Overall, the estimates of asset-poverty rates in urban China are much lower than those in developed countries, such as the UK and the US (Brandolini et al., Reference Brandolini, Magri and Smeeding2010; Kim and Kim, Reference Kim and Kim2013).
The second panel of Table 3 reports the estimation of asset-poverty-gap ratios. The asset-poverty-gap ratio uses a share of the asset-poverty line to indicate the amount of assets that a household needs to avoid asset poverty, mathematically indicated by the difference between the asset-poverty line and household assets divided by the asset-poverty line. All the median values of asset-poverty-gap ratios are above 100 per cent in Table 3, indicating that asset-poor households typically do not own any assets or have negative assets. More specifically, about 75 per cent of liquid-asset-poor households do not have any liquid assets, and more than 80 per cent of net-worth-poor households have negative net worth.
The second column of Table 2 shows asset ownership and asset distributions for households with liquid assets below the MLS poverty line. We specifically focus on liquid-asset poverty because liquid assets can more precisely reflect than the other two asset forms the role of assets in consumption smoothing in the occurrence of negative income shocks. The average liquid assets (265 yuan) owned by asset-poor households is 1 per cent of that owned by the entire sample. Three out of every four asset-poor households have zero liquid assets. Median savings in certificate deposits or regular savings accounts is zero for these households. In addition, the average household debt (8,686 yuan) is nearly 60 per cent higher than that of the entire sample (5,505 yuan). Nonetheless, the distributions of homeownership, family business and durable goods are relatively balanced in the full sample and the asset-poor sample.
Asset poverty, income poverty and public assistance
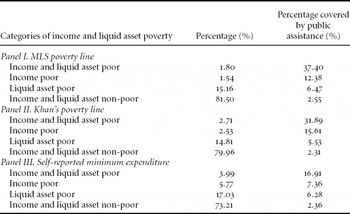
We further tabulate the sample by households’ liquid-asset-poverty and income-poverty status in Table 4. Income-poverty lines are defined similar to asset-poverty lines, but have a reference period of one year. The tabulation of liquid asset poverty and income poverty results in four categories of households: the income and asset poor, the income poor only, the asset poor only and the income and asset non-poor. The income-poor-only group has assets above the asset-poverty line, while the asset-poor-only group has an income greater than the income-poverty line. In the first panel, the poverty line is defined by the MLS. Less than 2 per cent of households are both income- and liquid-asset poor. This group is the most vulnerable, and only 40 per cent of households in this category receive some kind of public assistance, including the minimum living standard subsidy, living hardship subsidies from employers and so on.
Liquid asset poverty, income poverty, and public assistance (N = 6,835)

The second group (1.5 per cent of the full sample), while also experiencing income poverty, has liquid assets higher than the MLS asset-poverty line. With a buffer of household assets, this group (the income poor only) is better off than the first group (the income and asset poor). Nearly 12 per cent of households in the second group receive public assistance. Combining the first and second groups, about half of income-poor households are not asset poor (1.54/(1.80 + 1.54)); this percentage is similar to that in Norway, the UK, and Sweden, but much higher than other developed countries reported in Brandolini et al. (Reference Brandolini, Magri and Smeeding2010). Income-poor households are at greater risk of economic insecurity and are more motivated to save, although it is equally true that they also have less disposable income with which to save.
The third category (15 per cent of the full sample) comprises households with sufficient income to meet basic living standards but insufficient liquid assets to counter negative income shocks (the liquid-asset poor). Only 6 per cent of this group receives income support from public assistance programmes. The fourth group has income and assets both greater than the poverty lines (the income and liquid-asset non-poor). Although the percentage of households receiving public assistance varies in the four categories; altogether only 4 per cent of the households in the sample are supported by public assistance programmes. Similar results are found in the second panel which uses Khan's poverty line. The third panel uses the self-reported expenditure as the poverty line, and only 16 per cent of income- and asset-poor households receive public assistance of some kind.
Describing the characteristics of the asset poor
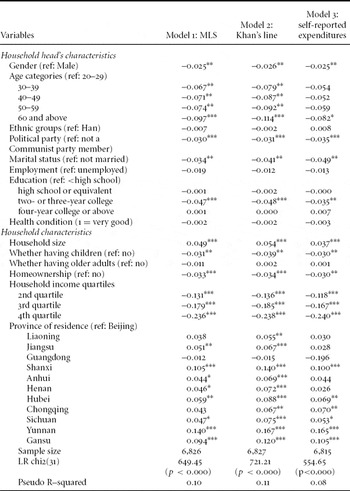
We further conduct multivariate logit analyses to see which household/demographic characteristics are significant predictors of asset poverty. The study follows the existing literature on asset poverty (Caner and Wolff, Reference Caner and Wolff2004; Haveman and Wolff, Reference Haveman and Wolff2001) to select predicting variables, and the household head's characteristics and household characteristics listed in Table 1 are used as independent variables.
Model 1 in Table 5 presents the results of a logit regression on liquid asset poverty for the MLS poverty line. In contrast to previous studies on asset poverty in developed countries, the results indicate that female-headed households are about 3 per cent less likely to be asset poor than male-headed households. Households headed by individuals less than thirty years old are more likely to experience asset poverty. Those headed by individuals who are members of the Communist Party, married, and/or home owners, are less likely to be asset poor compared to their counterparts; all these demographic characteristics reduce the probability of liquid asset poverty by about 3 per cent. Interestingly, compared to the group without a high school diploma, those headed by individuals with some time at college are less likely to be asset poor, and the other two education categories (a high school degree or equivalent and a bachelor degree or above) are not statistically significant in the analysis. Household size has a positive association with the probability of asset poverty, and having a child reduces a household's propensity for asset poverty by 3 per cent. Households with higher levels of income are more likely to have liquid assets for short-term consumption needs, and household income has the largest marginal effect among all the independent variables.
Logistic regression: marginal effects of demographic characteristics on asset poverty

p < 0.1, **p < 0.05, ***p < 0.01.
The second model examines liquid asset poverty (based on Khan's poverty line) as the dependent variable, and the test yields results consistent with those from Model 1. The dependent variable of the third model in Table 5 is liquid asset poverty based on the poverty line of the self-reported minimum expenditure. Most estimates are consistent with those in the first two models, but three age categories (thirty to thirty-nine, forty to forty-nine and fifty to fifty-nine) lose their statistical significance in this analysis. In addition, geographic disparity in asset poverty in Model 3 appears smaller than that in Models 1 and 2. For instance, asset-poverty rates for eastern provinces are not statistically different in Model 3. This may imply that the self-reported minimum expenditure, as a poverty line, is able to adjust household consumption needs for different life stages and geographies more than the other objective criteria.
Discussion
Low but deep asset poverty
Asset-poverty rates in urban China are lower compared to those for developed countries (Brandolini et al., Reference Brandolini, Magri and Smeeding2010). For example, the highest liquid-asset-poverty rate (21 per cent) estimated by this study is 12 percentage points lower than that of Italy (33 per cent) for the same period of time, and is less than 50 per cent of liquid-asset-poverty rates in Germany and the UK. However, like in other countries, the liquid-asset-poverty rate in China is much higher than the income-poverty rate. The liquid-asset-poverty rate based on the MLS poverty line is five times as high as the income-poverty rate, but this ratio was only 3.4 in the US in 1999. Asset poverty, especially liquid asset poverty, appears to be a severe problem in urban China.
Also indicated by the asset-poverty-gap ratio in Table 3, most asset-poor households barely have any assets, which should raise a concern for policymakers. With transitory income variance increasing from 0.04 in 1990 to 0.16 in 2004 (Chamon and Prasad, Reference Chamon and Prasad2010), households with extremely low assets are more likely to experience economic hardship, fall into transient poverty or become persistently poor.
In addition, many households without any assets do not have access to public assistance when needed, and only 4 per cent of households in the sample received public assistance in 2002. In China, because public expenditure on social programmes is still low, household economic resources, including both income and assets, are vitally important, especially in areas such as education and health services.
Precautionary savings and asset poverty
Low asset-poverty rates in urban China may in part be explained by strong precautionary saving motives, in addition to the low poverty standards. The ratio of household liquid assets and household income has been used as a measure of precautionary savings (Barceló and Villanueva, Reference Barceló and Villanueva2010; Kennickell and Lusardi, Reference Kennickell and Lusardi2005). For instance, Spanish temporary workers hold average liquid assets equivalent to four to five months’ earnings (i.e., a ratio of 0.4; Barceló and Villanueva, Reference Barceló and Villanueva2010). Kennickell and Lusardi (Reference Kennickell and Lusardi2005) identify that the ratio of desired precautionary savings and normal income has a median value of 0.1 in the US. This study shows that the mean household liquid assets in urban China are about 1.2 times the mean household income, much higher than the two examples above. This study also finds that about half of income-poor households appear to have sufficient assets to cover their consumption needs for three months. In other words, half of income-poor households in urban China are not asset poor. Nonetheless, only about 20 per cent of income-poor households in most developed countries are not asset poor (Brandolini et al., Reference Brandolini, Magri and Smeeding2010). This comparison shows that preference is given to precautionary saving even though urban households in China have much less income than those in developed countries.
A number of factors, including cultural influence, habit formation and demographic characteristics, may explain the strong motivation for precautionary savings and the high savings rates in China. As suggested by Chamon and Prasad (Reference Chamon and Prasad2010), perhaps these high rates are also explained by the inadequacy of social protection programmes and the rising burden of expenditures on housing, education and healthcare. The universal basic healthcare and education available prior to the reform have been drastically changed as a result of privatisation and commercialisation of public services. Along with increasing income uncertainty, public provision of social services continues to decline, creating an institutional context that profoundly shapes the motivation for households to save.
Interactions between demographics and policy transitions
This study suggests that the associations between household demographics and asset poverty are shaped by the unique policy context of urban China. Many policy transitions and economic reform processes that have contributed to the economic successes and wealth accumulation, however, may have also created challenges, such as wealth inequality and risk of asset poverty.
We discuss the following demographic characteristics: party affiliation, gender, children and region of residence. Households led by members of the Communist Party of China are consistently better off than their counterparts in all multivariate analyses, probably because of the role and power that party members have in the policymaking process, especially during the economic and policy transitions. For example, individuals with higher political status can acquire their occupancies at more heavily subsidised prices (Li et al., Reference Li, Liu, Zhang and Ma2007; Meng, Reference Meng2007). In contrast to those in developed countries, households in China headed by females are less likely to be asset poor in this study. Previous literature (Meng, Reference Meng2007) also reports that households headed by females accumulate more assets than those headed by males. A possible explanation is that women in China are more sensitive to the decline of public services and increase in private burdens of education and health care as a result of the privatisation and commercialisation of public services. Households headed by females, therefore, may have stronger motivation to accrue precautionary savings.
Previous research suggests that households with children have a savings rate five percentage points higher than childless households (Baldacci et al., Reference Baldacci, Callegari, Coady, Ding, Kumar, Tommasino and Woo2010). Similarly, this study finds that households with children are less likely to be asset poor, probably because they want to be prepared for future income-uncertainty economic hardship. Households with children also try to be financially prepared in response to rapidly growing educational expenditures. Another policy-related demographic factor is that, in younger generations, there is a high sex ratio imbalance partly due to a preference for sons; because of this imbalance, parents strive to save in order to enhance their male offspring's competitiveness in the marriage market (Wei and Zhang, Reference Wei and Zhang2009).
Finally, regarding region of residence, as expected, households in the eastern region are less likely to be asset poor than households in other regions; Beijing and Guangdong have the lowest asset-poverty rates. This geographic disparity is largely a consequence of institutional arrangements in favour of large cities and select regions. The country's highly decentralised fiscal system continues to favour eastern/coastal regions where more fiscal resources and public spending have been seen. Despite the central government's efforts to invest in western regions, it is still the eastern and coastal regions that continue to have substantially more economic resources and opportunities.
Policy implications
As an important factor shaping household asset accumulation and asset poverty in urban China, policy can also be a valuable tool in supporting asset-poor households. One policy proposal to support asset-poor households is to increase public expenditures on social programmes and strengthen the social safety net. With social assistance programmes and other policy measures in place, asset-poor households would be spared from economic insecurity and hardship.
Furthermore, with a strengthened social safety net in place, asset building could be an integral part of development-oriented strategies for poverty reduction. Indeed, poor households face the challenge of budget constraints and have less disposable income to save. To improve the financial well-being of the poor, the concept of inclusive growth, recently embraced by the Chinese government, calls for equal opportunity for the poor in order that they share the fruit of economic growth (Deng et al., Reference Deng, Sherraden, Huang and Jin2013). In addition, to encourage asset accumulation among poor households, well-designed asset-building programmes should be considered and financial inclusion improved (Guo et al., Reference Guo, Huang, Sherraden and Zou2008a). For example, appropriate financial products and services, such as a credit market combined with subsidies for postsecondary education and small businesses, could be considered specifically for financially vulnerable households. There have been examples of asset-building programmes for the poor developed by different countries, such as Individual Development Accounts in the US, the Child Trust Fund in the UK (which has been discontinued since 2011) and the Central Provident Fund programme in Singapore. Successful experiences and lessons learned from these programmes (Beverly and Sherraden, Reference Beverly and Sherraden1999; Deng et al., Reference Deng, Sherraden, Huang and Jin2013; Guo et al., Reference Guo, Huang, Zou and Sherraden2008b; Sherraden et al., Reference Sherraden, Schreiner and Beverly2003; Vasoo and Lee, Reference Vasoo and Lee2006) may inform policy development in China.
Limitations
This study has several limitations. First, the study uses data collected in 2002, which may not accurately reflect asset distribution and asset poverty in China today. Second, the validity of the asset-poverty lines adopted in this study is controversial. As a precaution, three different poverty lines developed by different authorities are used to estimate asset poverty. Despite the variation in these poverty lines, estimates of asset-poverty rates are surprisingly consistent, with only slight variation. Finally, the study does not compare asset-poverty rates between urban and rural China, which is an important research question for further investigation.
Conclusion
To conclude, the study estimates asset-poverty rates with three asset indicators and three asset-poverty lines. Overall, China's asset-poverty rates are lower than those of developed countries. This is, in part, due to the low poverty standards and Chinese households’ strong motivation to accrue precautionary savings and high savings rates. Despite the low asset-poverty rates, asset poverty still appears to be a serious problem as indicated by the ratio of the liquid asset-poverty rate to the income-poverty rate. Importantly to note, the asset-poverty-gap ratio shows that most households in asset poverty have zero liquid assets or negative net worth. In other words, they are the poorest, lacking any form of economic resources for backup. Unfortunately, social protection programmes in China are poorly funded, which places asset-poor households at a high risk of economic hardship. To encourage poor people to accumulate assets, asset-building policy innovations would have to target vulnerable populations.