

1. Introduction
The efficient and accurate dispensing of microdroplets contributes to the development of precision manufacturing (Kim et al. Reference Kim2015; Onses et al. Reference Onses, Sutanto, Ferreira, Alleyne and Rogers2015; Chen et al. Reference Chen, Liu, Dong, Lee, Ware, Zhang and Sun2018), bio-medicine (Erb et al. Reference Erb, Obrist, Chen, Studer and Studart2011), tissue engineering (Kang et al. Reference Kang, Park, Kim, Kim, Lee, Kim, Yoo and Jung2021), digital biochemical analyses (Dijkink & Ohl Reference Dijkink and Ohl2008; Park et al. Reference Park, Wu, Chen, Teitell and Chiou2011), microchemical analysis (Liao et al. Reference Liao, Tao, Du and Wang2018) and other related fields (Hoath Reference Hoath2016). In turn, the development of these fields put forward urgent demands on the size, components and application scenarios of droplets. The urgent requirements of various industries also catalysed the development of various droplet preparation technologies, including drop-on-demand (DOD) inkjet printing (Ashgriz Reference Ashgriz2011) driven by piezoelectric element or thermal bubbles (Naiman Reference Naiman1965), electrohydrodynamic (EHD) jet printing (Park et al. Reference Park2007; Kim et al. Reference Kim2015; Onses et al. Reference Onses, Sutanto, Ferreira, Alleyne and Rogers2015), chip-based active or passive microfluidic methods (Zhu & Wang Reference Zhu and Wang2017), micro-pumps driven by laser-induced cavitation (Park et al. Reference Park, Wu, Chen, Teitell and Chiou2011) and ultrasonic ejection (Elrod et al. Reference Elrod, Hadimioglu, Khuri-Yakub, Rawson, Richley, Quate, Mansour and Lundgren1989; Meacham et al. Reference Meacham, Varady, Degertekin and Fedorov2005).
As a favourable droplet-deposition technique, inkjet printing, with the capacity to pattern small droplets arbitrarily and efficiently, dispensing any substance that can be dissolved or suspended in the ink and printing on unsmoothed even curved substrates, has been well developed so far. Given the superior performance (high efficiency and flexibility), piezo-acoustic DOD inkjet printing has been applied to flexible electronic skin (Abdolmaleki, Kidmose & Agarwala Reference Abdolmaleki, Kidmose and Agarwala2021), precision manufacturing (Chen et al. Reference Chen, Liu, Dong, Lee, Ware, Zhang and Sun2018), biological tissue engineering (Calvert Reference Calvert2007; Kang et al. Reference Kang, Park, Kim, Kim, Lee, Kim, Yoo and Jung2021) and other cutting-edge scientific fields as a commendable and material-conserving technique (Singh et al. Reference Singh, Haverinen, Dhagat and Jabbour2010; Liu et al. Reference Liu2019), and has far exceeded its original text and pattern printing functions since its invention in the 1970s by Zoltan (Reference Zoltan1972). In the past decades, many scholars (Derby Reference Derby2010; Liu & Derby Reference Liu and Derby2019; McIlroy & Harlen Reference McIlroy and Harlen2019; Kang et al. Reference Kang, Kim, Sohn and Ko2020) have devoted themselves to improving the printing performance via a thorough comprehension of the droplet-ejecting mechanisms (Basaran Reference Basaran2002; Xu & Basaran Reference Xu and Basaran2007; Basaran, Gao & Bhat Reference Basaran, Gao and Bhat2013) and optimising the structure of inkjet nozzle (Switzer Reference Switzer1991; Berggren, Westphall & Smith Reference Berggren, Westphall and Smith2002) based on the working mechanisms.
A review of the literature suggests that although inkjet printing has been well developed, it is quite difficult to improve the printing accuracy by further reducing the orifice size to less than 10  $\mathrm {\mu }$m considering the manufacturing difficulty and maintenance cost (Lohse Reference Lohse2022). A small orifice is prone to clogging, raising higher requirements on the rheology and purity of the ink. The inability to effectively reduce the size of droplets limits the further applications of inkjet printing in many emerging scenarios where femtolitre droplets are required (Zhang et al. Reference Zhang, Li, Liu and Wittstock2018b).
To address these challenges, techniques realising inkjet printing in a liquid environment have been proposed (Zhang et al. Reference Zhang, Zhu, Liu and Wittstock2016, Reference Zhang, Li, Liu and Wittstock2018a). By immersing the nozzle into the carrier liquid which is immiscible with the ink, there will be a confined interface (typically oil/water interface) formed at the edge of the orifice. For dispensing small droplets in the carrier liquid, the confined interface is first protruded outward and then quickly sucked back. This push–pull movement of the confined interface is the core process of this printing-in-liquid technique. Under the comprehensive effects of inertial, interfacial and viscous force during the suction process, the interface contracts and deforms into a long and thin liquid column, and finally pinches off at its base, forming droplets with a diameter that can be several or even dozens of times smaller than the orifice from which they are dispensed. The droplet-dispensing mechanism is totally different from conventional inkjet printing in a gaseous environment, and is also different from the mechanisms of EHD printing. EHD ink is subjected to both surface tension and EHD force. When the voltage reaches a critical value, the meniscus attached to the tube takes on a conical profile, called the Taylor cone, with a fine jet emanating from the cone tip (Basaran Reference Basaran2002).
Here, this technique is called confined interface vibration inkjet printing (CIVIJP), which allows nanometer-sized droplets to be dispensed from the micrometre-sized orifice, and consequently reduces the manufacturing difficulty of finer nozzles, improves the maneuverability and stability of the nozzle, avoids clogging and even realises stable printing of inks with higher viscosity. This technique greatly broadens the application fields of inkjet printing because it introduces traditional inkjet printing into liquid environments, which could conventionally only work in air.
A micro-pump coupled with a millimetre-sized orifice was utilised in our original work to realise the interface extrusion and suction in the carrier liquid (Zhang et al. Reference Zhang, Zhu, Liu and Wittstock2016). Owing to the low velocity of the piston, compressibility of the liquid and the flow resistance in the slender tube, it always takes hundreds of milliseconds to finish the extrusion and suction process. The low response speed limits the dispensing frequency to a few Hertz, far from meeting the demand for efficient printing. Considering the high response speed of the piezoelectric nozzle, the CIVIJP technique was combined with a commercial piezoelectric nozzle in our recent work (Zhang et al. Reference Zhang, Li, Liu and Wittstock2018a), realising efficient printing and pattering of fine droplets in a carrier liquid with low viscosity.
Even though this CIVIJP technique has gained satisfactory performance, the underlying physics of this technique has not been clarified. How does the electric pulse stimulation control the confined interface vibration? Why can droplets be pinched off during the suction process? How do the interface behaviours dominate the size and amount of pinched droplets? What is the fundamental difference between CIVIJP and traditional inkjet printing in a gaseous environment? All of those questions need to be clarified to gain an in-depth, systematic and comprehensive understanding of this printing-in-liquid technique. In this work, efforts were made to try to answer those suspended questions.
2. Experimental description
In order to carry out systematic research, both the electric pulse stimulation and the interface behaviours were recorded with high temporal and spatial accuracy. A set of experimental devices was set up as shown in figure 1. The core component, a piezoelectric ceramic inkjet printer (MJ-AT-01-60, orifice diameter  $D_{o}$ is 60
 $\mathrm {\mu }$m), was purchased from MicroFab (USA) and was connected to a signal controller. The front section of the nozzle was sealed in a perspex cell by silica gel and the back end was connected to the reservoir via a supply tube, which controlled the stability of the interface using a precise pressure control unit. The sealed perspex cell with the nozzle was placed on the platform of an inverted microscope (Nikon ECLIPSE MA200, Japan) connected to a high-speed camera (Fastcam NOVA S12, Photron, Japan) to observe and record the interface behaviour which is magnified by a
 $\times$20 lens and recorded at a frame rate of 200 000 f.p.s. The standard scale factor for each image was 1
 $\mathrm {\mu }$m per pixel in the image and the time interval between frames was 5
 $\mathrm {\mu }$s. In order to explore how the electric pulse affects the interface behaviour and droplet formation, an oscillograph (YOKOGAWA DL350, Japan) was combined with the high-speed camera to record the driving waveform and interface behaviour simultaneously. Electric signals can be sampled at a rate of 20 points per microsecond, corresponding to 100 data points per frame which is 5
 $\mathrm {\mu }$s.
Schematic diagram of the experimental apparatus and observation system.

Deionised water (DIW; 1 mPa s, 995 kg m $^{-3}$) and silicone oil (20 mPa s, 931 kg m
 $^{-3}$) were used as the ink and carrier liquid. The interfacial force coefficient
 $\sigma$ between the ink and the carrier liquid was measured to be 28.16 mN m
 $^{-1}$ by the TECLIS interface rheometer (Teclis Interface Technology Co., Ltd. France). All the experiments were carried out at room temperature of about 20
 $^\circ$.
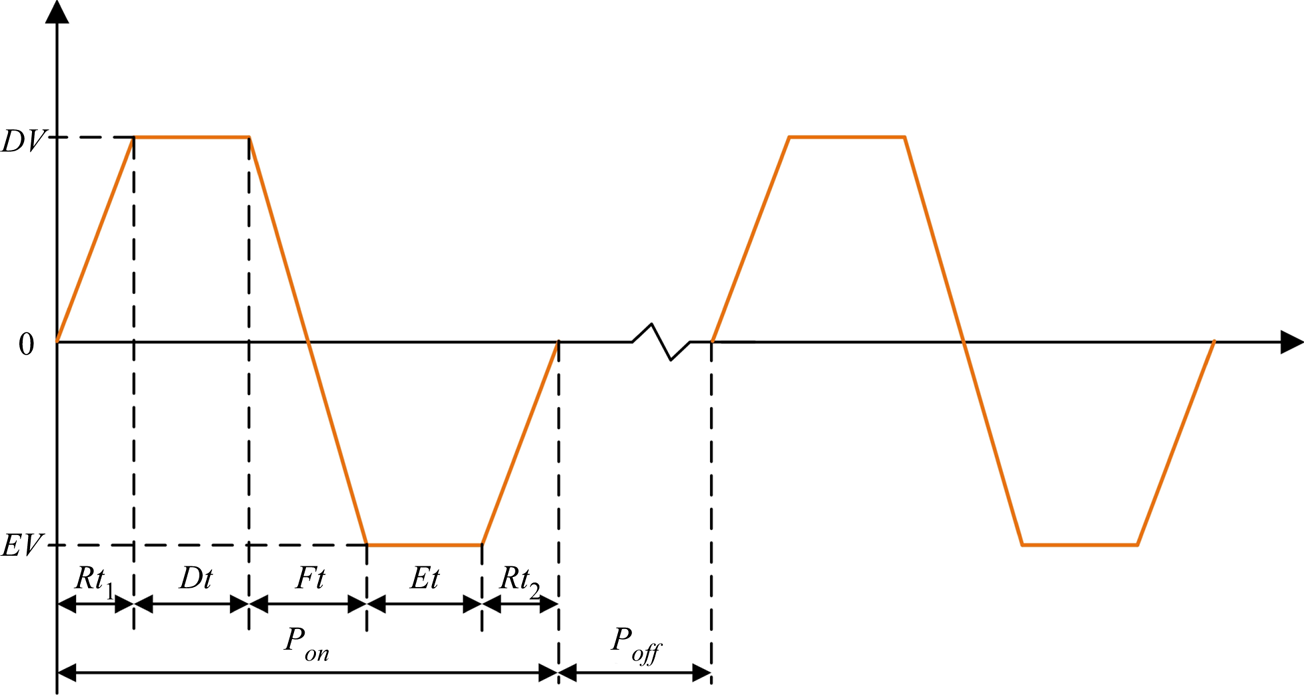
The typical shape of the waveform of electric pulse used in the experiments is shown in figure 2. The dwell voltage ( $DV$), echo voltage (
 $EV$), dwell time (
 $Dt$), echo time (
 $Et$), rise time 1 (
 $Rt_1$), rise time 2 (
 $Rt_2$) and fall time (
 $Ft$) can be regulated independently. The duration of the stimulation
 $P_{on}$ is the sum of
 $Rt_1$,
 $Dt$,
 $Ft$,
 $Et$ and
 $Rt_2$. The dispensing frequency is adjusted by regulating the time interval between two successive stimulations
 $P_{off}$. There can be various combinations of driving waveform settings. Here, in order to facilitate the experiment and analysis of experiments results, the driving voltage is in the form of
 $\pm n$, that is,
 $EV = -DV$.
Basic driving signal waveform diagram.

3. Simulation
It is easy to observe the interface behaviour by using a high-speed camera coupled with a micro-lens. However, the velocity profile and pressure distribution and corresponding evolution with time are difficult to visualise through experimental approaches, which is of vital importance to understanding the interface behaviour of CIVIJP. Here, the laminar two-phase flow, phase field method (Yue et al. Reference Yue, Zhou, Feng, Ollivier-Gooch and Hu2006) was adopted to track the interface using COMSOL Multiphysics 5.6, aiming at revealing more details of the CIVIJP printing mechanisms. As the typical velocity of the fluid is no more than 10 m s $^{-1}$, which is much slower than the speed of sound (higher than 1000 m s
 $^{-1}$), the ink and carrier liquid are considered as incompressible based on the narrow channel theory proposed by Wijshoff (Reference Wijshoff2008, Reference Wijshoff2010). The wavelength of the acoustic wave for frequencies less than 20 kHz (the maximum working frequency for the inkjet nozzle used here) is more than 50 mm, much bigger than the diameter of the ink channel. Thus, the acoustic wave propagating in the channel can be treated as the plane wave (Wijshoff Reference Wijshoff2010).
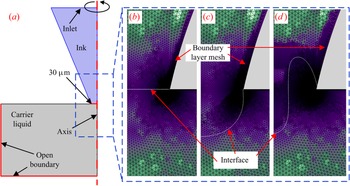
Considering the structure of the nozzle is cylindrical, a 2-D rotational symmetric model with symmetry on the nozzle axis is constructed to simplify the calculation. The left half of figure 3(a) illustrates the geometry and the initial state of the model. The geometry of the model, the properties of the ink and carrier liquid are basically consistent with the experimental data. For example, the profile of the channel and corresponding scales are basically consistent with the actual nozzle. In order to reduce the model size and speed up the calculation, we select the area near the initial interface for calculation instead of using the full-scale model. Please refer to Appendix A for the reasonableness discussion of this part, and Appendix B for the detailed settings of the boundary conditions.
The geometry model and the representative adaptive mesh refinement evolution. (a) The geometry settings and initial state of the axisymmetric simulation model, only the left half is shown. (b) The initial mesh grid distribution constructed by the physics-controlled mesh. (c,d) One representative adaptive mesh refinement (c) when the flow field is inward and (d) when the flow field is backward. The white curves in (b–d) represent the interface.

To accurately analyse the interface behaviour, the physics-controlled mesh is selected, and figure 3(b) shows the initial mesh grid distribution, which automatically generates the boundary layer grid. Furthermore, adaptive mesh refinement is set using the general modification strategy, which means the mesh grid will update with the evolution of the simulation to keep the mesh refinement of the interface and boundary, where precise calculations are required, as shown in figures 3(c) and 3(d). Before carrying out the formal numerical simulation, a convergent study was conducted to demonstrate mesh-independent results. Detailed discussions are shown in Appendix C.
The two-phase flow dynamics is governed by a Cahn–Hilliard equation:
 \begin{equation} \frac{\partial \phi}{\partial t}+\boldsymbol{u} \boldsymbol{\cdot} \boldsymbol{\nabla} \phi=\boldsymbol{\nabla} \boldsymbol{\cdot} \gamma \boldsymbol{\nabla} G, \end{equation}
where  $G$ is the chemical potential and
 $\gamma$ is the mobility, which tracks a diffuse interface separating the immiscible phases (Yue et al. Reference Yue, Feng, Liu and Shen2004). The diffuse interface is defined as the region where the dimensionless phase field variable
 $\phi$ goes from
 $-$1 to 1. The discretisation of the governing equation follows the standard Galerkin formalism (Hu, Patankar & Zhu Reference Hu, Patankar and Zhu2001). Given that the
 $C^0$ elements are smooth within each element and continuous across their boundaries, one cannot represent spatial derivatives of higher order than two. Thus, the fourth-order Cahn–Hilliard equation was decomposed into two second-order equations when solved in COMSOL Multiphysics:
 \begin{equation} \left.\begin{array}{c@{}} \dfrac{\partial \phi}{\partial t}+\boldsymbol{u} \boldsymbol{\cdot} \boldsymbol{\nabla} \phi=\boldsymbol{\nabla} \boldsymbol{\cdot} \dfrac{\gamma \lambda}{\varepsilon^{2}} \boldsymbol{\nabla} \psi, \\ \psi={-}\boldsymbol{\nabla} \boldsymbol{\cdot} \varepsilon^{2} \boldsymbol{\nabla} \phi+ (\phi^{2}-1) \phi, \end{array}\right\} \end{equation}
where  $\boldsymbol {u}$ is the fluid velocity,
 $\gamma$ is the mobility,
 $\lambda$ is the mixing energy density and
 $\varepsilon$ is the interface thickness parameter. The
 $\psi$ variable is referred to as the phase field help variable. In COMSOL Multiphysics, the mobility is determined by a mobility tuning parameter that is a function of the interface thickness
 $\gamma =\chi \varepsilon ^{2}$. The following equation relates the mixing energy density and the interface thickness to the surface tension coefficient:
 \begin{equation} \sigma=\frac{2 \sqrt{2}}{3} \frac{\lambda}{\varepsilon}. \end{equation}
Typically, the interface thickness parameter can be set to  $\varepsilon =h_c /2$, where
 $h_c$ is the characteristic mesh size in the region passed by the interface. The mobility tuning parameter
 $\chi$ and interface thickness parameter
 $\varepsilon$ of each simulation case were set by judicious parametric sweep.
In the phase field interface, the volume fractions of the individual fluids are
 \begin{equation} V_{f 1}=\frac{1-\phi}{2}, \quad V_{f 2}=\frac{1+\phi}{2}. \end{equation}
In the present model, oil is defined as fluid 1 and water as fluid 2. The multiphysics coupling feature defines the density and the dynamic viscosity of the mixture to vary smoothly over the interface by letting
 \begin{gather} \rho=\rho_{1}+(\rho_{2}-\rho_{1}) V_{f 2}, \end{gather}
 \begin{gather}\mu=\mu_{1}+(\mu_{2}-\mu_{1}) V_{f 2}, \end{gather}
in which  $\rho _{1}$ is the density of the carrier liquid,
 $\rho _{2}$ is the density of the ink,
 $\mu _{1}$ is the dynamic viscosity of the carrier liquid and
 $\mu _{2}$ is the dynamic viscosity of the ink. In order to account for capillary effects, it is crucial to include surface tension in the model. Moreover, the gravity can be neglected because the Bond number
 \begin{equation} Bo=\frac{{\rm \Delta} \rho g r^{2}}{\sigma}= (\rho_{2}-\rho_{1}) g r^{2} / \sigma, \end{equation}
is always smaller than  $10^{-4}$, where
 $g$ is the gravitational acceleration, and
 $r$ is the characteristic radius of the orifice. Consequently, the incompressible Navier–Stokes equations, including interfacial force was utilised to simulate the interface behaviour:
 \begin{gather} \rho \frac{\partial \boldsymbol{u}}{\partial t}+ \rho(\boldsymbol{u} \boldsymbol{\cdot} \boldsymbol{\nabla}) \boldsymbol{u}=\boldsymbol{\nabla} \boldsymbol{\cdot} [{-}p {\boldsymbol{\mathsf{I}}}+\mu(\boldsymbol{\nabla} \boldsymbol{u}+(\boldsymbol{\nabla} \boldsymbol{u})^{\rm T})] +\boldsymbol{\mathsf{F}}_{\sigma}, \end{gather}
 \begin{gather}\boldsymbol{\nabla} \boldsymbol{\cdot} \boldsymbol{u}=0, \end{gather}
in which  $p$ denotes the pressure and
 $\boldsymbol{\mathsf{F}}_\sigma$ is the interfacial force acting at the oil/water interface.
The interfacial force is added to the Navier–Stokes equations as a body force by multiplying the chemical potential of the system by the gradient of the phase field variable:
 \begin{equation} \boldsymbol{\mathsf{F}}_{\sigma}=G \boldsymbol{\nabla} \phi, \end{equation}
where
 \begin{equation} G=\lambda \left[-\nabla^{2} \phi+\frac{\phi(\phi^{2}-1)}{\varepsilon^{2}}\right] =\frac{\lambda}{\varepsilon^{2}} \psi. \end{equation}
Given the fact that the flow in the channel is a pulsatile flow, the velocity profile in the channel should be determined by the Womersley number:
 \begin{equation} Wo=R \sqrt{\frac{\omega \rho}{\mu}}, \end{equation}
where  $R$ is the radius of the channel (about 300
 $\mathrm {\mu }$m),
 $\omega$ is the angular speed of the oscillation of the flow (
 $1.26 \times 10 ^5$ s
 $^{-1}$),
 $\rho$ is the density of the ink and
 $\mathrm {\mu }$ is the dynamic viscosity of the ink. The calculated
 $Wo$ can be 106, which is much higher than 2. A large
 $Wo$ number implies a phase shift between the pressure and velocity in the channel (Nield & Kuznetsov Reference Nield and Kuznetsov2007; Cheng, Ahmadi & Cheung Reference Cheng, Ahmadi and Cheung2015). However, because the ink in the channel is incompressible, the deformation of the interface is driven by the flow field. Here, the focus is the evolution of oil/water interface driven by the flow field and its impact on the formation of droplets. To simplify the analysis, we ignored the phase shift between the pressure and velocity as did by Zhong et al. (Reference Zhong, Fang, Ma and Dong2018) and Wang, Zhong & Fang (Reference Wang, Zhong and Fang2019). The fluid flow and oil/water interface behaviour are simulated by using the velocity driven strategy. Based on the theory of pulsatile flow, the velocity profile in the channel is approximately a straight line after the velocity profile passes through the boundary layer. The thickness of the boundary layer
 $(\nu \tau )^{1/2}$ (
 $\nu$ is the kinematic viscosity of the ink,
 $\tau$ is the vibration period) is about 7
 $\mathrm {\mu }$m, which is negligible compared with the radius of the channel (300
 $\mathrm {\mu }$m). Thus, we ignored the velocity distribution at the boundary layer and adopted a linear velocity profile controlled by rectangular time functions at the inlet of the channel to realise the pulsatile flow in the channel, and the no-slip wall condition was adapted and boundary layer mesh grid was set. The model is large enough for the velocity profile to adjust itself:
 \begin{equation} v=\sum_{i=1}^{n} rect_{i} c_{i} \sin (\omega t+\varphi), \end{equation}
where  $rect_{i}$ represents the unit rectangular pulse signal, which controls the action time of the corresponding velocity function,
 $c_{i}$ is the amplitude regulating coefficient of the velocity function,
 $\varphi$ is the initial phase of the velocity and
 $\sin (\omega t+\varphi )$ determines the direction of the flow and the change law over time (when the value is positive, the ink flows towards the orifice, whereas the ink flows backward when the value is negative). The time interval between
 $rect_{i}$ is introduced here to let the interface self-adapt between the ‘push’ and ‘pull’ process according to the experimental observations.
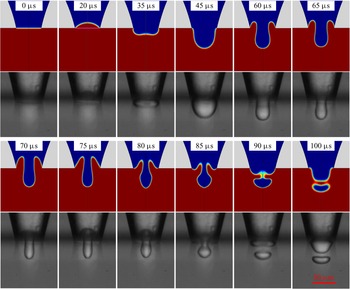
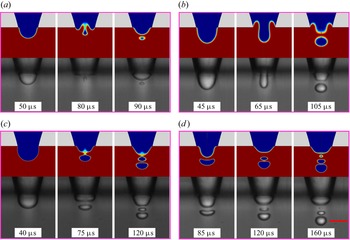
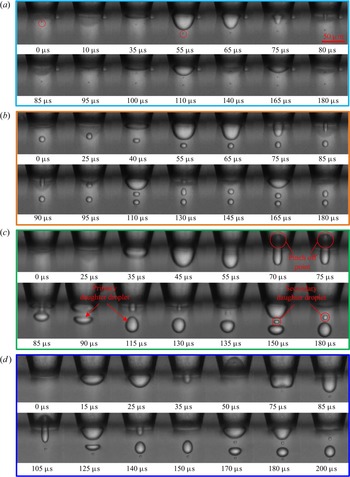
The simulation study carried out here is different from the previous traditional inkjet simulations, which focus on the droplet ejection process in an air environment. We not only focus on the liquid extrusion process, but also pay more attention to the interface shrinkage and fracture process caused by the reverse flow field in the channel. The rectangular pulses and sine waves were introduced to simulate the initial periodic pull–push process. A one-to-one comparison of the simulation with the experimental interface behaviour at the exact time are shown in figure 4. To further verify the reliability of the simulation results, simulations about different scenarios of droplet generation were conducted and shown in figure 5, which includes small-, large- and multiple-droplet-generation processes. From figures 4 and 5 one can see that the numerical results agree well with the experimental observations, which demonstrate that the model and assumptions are reasonable to obtain accurate results.
One-to-one comparison of the numerical simulation with the experimental observed interface behaviour at the exact time. The driving pulse in the experiment is one conventional waveform as shown in figure 2 with amplitude of  $\pm$9 V.

Comparison of simulation and experimental results under different working conditions: (a) dwell voltage is 11 V, echo voltage is  $-$11 V; (b) dwell voltage is 12 V, echo voltage is
 $-$12 V; (c) dwell voltage is 12 V, echo voltage is
 $-$14 V; (d) dwell voltage is 13 V, echo voltage is
 $-$13 V. The driving frequencies in (a–d) all are 2000 Hz. The scale bar is 50
 $\mathrm {\mu }$m.

4. Results and discussion
4.1. Relationship between the electric pulse stimulation and the interface behaviour
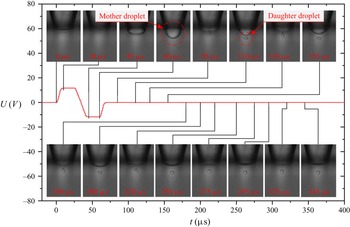
The stimulation waveform and corresponding interface behaviour are shown in figure 6. Here, the moment when the electrical signal applied to the piezoelectric actuator is defined as the original starting time node  $t_0$, corresponding to the 0
 $\mathrm {\mu }$s of the time axis. First, a rising edge is applied to the piezoelectric nozzle, inducing an outward expansion of the piezoelectric ceramic tube and resulting in a negative pressure wave in the tube expanding to both sides. Given that it takes time for the acoustic wave induced by the actuator to reach the orifice, the interface movement lags slightly behind the stimulation waveform. A slight retraction of the interface, corresponding to the frame at 10
 $\mathrm {\mu }$s in figure 6, was observed. The piezoelectric ceramics then will contract due to the arrival of the falling edge, inducing a positive pressure wave in the nozzle that causes the interface to bulge outward, as shown in the images at 45 and 60
 $\mathrm {\mu }$s. Suction takes place between 60 and 85
 $\mathrm {\mu }$s. A small droplet is pinched off at the end of the suction process. Here we name the droplet attached to the orifice as the mother droplet (see the frame at 60
 $\mathrm {\mu }$s in figure 6) and the pinched droplets as daughter droplets (see the frame at 110
 $\mathrm {\mu }$s in figure 6). Although the stimulation waveform has stopped at about 65
 $\mathrm {\mu }$s, the energy given by the piezoelectric ceramics to the system still exists. The pressure wave will continuously propagate and be reflected repeatedly within the nozzle channel, dominating the subsequent periodic vibration of the interface until the remnant energy is exhausted by the viscous dissipation and cannot overcome the resistance of the interfacial force, which is called residual vibration (Wijshoff Reference Wijshoff2010). Supplementary movie 1 available at https://doi.org/10.1017/jfm.2022.716 illustrates the simultaneous evolution of the interface and the driving signal.
The corresponding relationship between the driving waveform and the interface behaviour. The amplitude of the driving waveform is  $\pm$12 V.

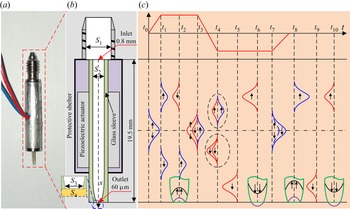
To have a better understanding of the CIVIJP phenomenon, theoretical analyses were carried out focusing on the propagation mechanism of the pressure wave stimulated by the piezoelectric actuator. The inkjet nozzle used in experiments is shown in figure 7(a), and the detailed geometrical information of the internal structure is illustrated in figure 7(b). The central axis of the glass sleeve is set as the  $x$-axis, the red point on the axis is set as the origin of the
 $x$-axis and the direction pointing to the outlet of the nozzle is set as positive. Considering that the channel of the screwed joint is greater than the inner diameter of the glass sleeve (about 0.6 mm), the inlet of the glass sleeve can be regarded as an open end; and the diameter of the inkjet nozzle orifice is only 60
 $\mathrm {\mu }$m, with a cross-sectional area of only 1
 $\%$ of the channel, much smaller than the inner diameter of glass sleeve, and can be considered as approximately closed. Further given the acoustic impedance of glass is about
 $14.1 \times 10^6$ kg m
 $^{-2}$ s
 $^{-1}$, much higher than the acoustic impedances of DIW and silicone oil, the closed end can be regarded as a rigid reflecting surface. The above simplest assumptions may be reasonable enough in the theoretical analysis here. Further refinements were made in the latter contents.
(a) The appearance of the inkjet nozzle used in experiments. (b) Detailed illustration of the internal structure. (c) Schematic diagram illustrating the generation, propagation, reflection mechanism of acoustic waves in the glass sleeve and the optimal superposition of waveforms. In order to describe the corresponding relationship between the driving wave signal and the pressure wave generated in the glass sleeve, as well as the time nodes of superposition between pressure waves and reflection of pressure waves, (c) is not drawn following the actual time scale. In the schematic diagram (c), the blue waveforms represent the negative pressure wave, the red waveforms represent the positive pressure wave, the green figure is a sketch of the nozzle, the black parabola and arrow represent the flow field and the purple curve represents the deformed interface.

In our case, the acoustic waves propagate along the axial of the glass sleeve, and the axial dimension is much larger than the radial dimension. Consequently, the one-dimensional acoustics can be used to analyse the propagation characteristics of the sound in the glass capillary. The acoustic waves will travel through the capillary as plane waves further considering that the wavelength of acoustic waves are much larger than the diameter of the glass sleeve. In addition, the ink used here is DIW, which is difficult to form nonlinear acoustic waves. There is no ultrasonic cavitation bubble in the nozzle due to the mild driving signals. Thus, the propagation of sound waves in the nozzle can be regarded as a linear process. Under the premise that the particle velocity is far less than the sound velocity, the particle displacement is far less than the acoustic wave wavelength and the density increment of the medium is far less than the static density, the components higher than second-order in the equation of motion, continuity and state of the acoustic waves can be ignored.
Based on these descriptions and assumptions, one-dimensional wave equations of linear acoustics were adopted to analyse the wave propagation mechanism in the nozzle by (Bogy & Talke Reference Bogy and Talke1984), (Dijksman Reference Dijksman1984) and (Wang et al. Reference Wang, Zhong and Fang2019). The pressure function  $p(x,t)$ is
 \begin{equation} c^{2} p_{x x}=p_{t t},\end{equation}
and the displacement function  $\zeta ({x,t})$ is
 \begin{equation} c^{2} \zeta_{x x}=\zeta_{t t},\end{equation}
where the subscripted variables denote partial derivatives and c is the speed of sound in the fluid. The relationship between  ${p}({x,t})$ and
 $\zeta ({x,t})$ is
 \begin{equation} p={-}\rho c^{2} \zeta_{x},\end{equation}
where  $\rho$ is the fluid density. The relationship between particle velocity u and
 $\zeta$ is
 \begin{equation} u=\zeta_{t}.\end{equation}
The general solution of the pressure wave equation in (4.1) is
 \begin{equation} p(x, t)=f(x-c t)+g(x+c t),\end{equation}
which denotes the superposition of two pressure profiles: a profile f that propagates towards the positive x-direction (to the closed end) and a profile g that propagates in the negative x-direction (to the open end) at the same speed c. The displacement function  $\zeta ({x,t})$ is similar to the pressure function
 ${p}({x,t})$. If the wave propagates towards the positive x-direction
 \begin{equation} \zeta(x, t)=f(x-c t),\end{equation}
then
 \begin{equation} p={-}\rho c^{2} f^{\prime}, \quad u={-}c f^{\prime},\end{equation}
When the wave propagates towards the negative x-direction
 \begin{equation} \zeta(x, t)=g(x+c t),\end{equation}
then
 \begin{equation} p={-}\rho c^{2} g^{\prime},\quad u=c g^{\prime}.\end{equation}
According to (4.6)–(4.9a,b), the pressure and velocity have the same sign for waves travelling towards the positive  $x$-direction, and they have opposite signs when propagating towards the negative
 $x$-direction. Based on the relevant theory of pipe acoustics, for the sound wave propagates in the pipe, and when the cross-sectional area of the pipe changes, the acoustic impedance also changes, which could cause the reflection and transmission of the sound wave. The reflection and transmission of pressure wave at the open and closed ends can be obtained by combining certain boundary conditions with (4.1)–(4.4). The scenario with acoustic wave propagating towards the open end is analysed as follows. Here,
 $S_1$,
 $S_2$ are used to denote the cross-sectional area of the screwed joint and the glass sleeve, as shown in figure 7(b). The amplitude of the wave propagating towards the open end is denoted as
 $p_{ai}$, the amplitude of the wave reflected from the open end is denoted as
 $p_{ar}$ and the amplitude of the wave transmitted through the open end is denoted as
 $p_{at}$. The compliance does not change across the open end due to the same medium. The sound pressure reflection coefficient can be obtained according to the law of conservation of mass, the boundary condition of volumetric velocity continuity and considering sound pressure continuity:
 \begin{equation} r_{{p}}=p_{{ar}} / p_{{ai}}=(S_{21}-1) /(S_{21}+1), \end{equation}
where  $S_{21}=S_1/S_2$. For the open end, as stated previously, we can obtain
 $r_{p} =-0.72$. We can further conclude that most of the acoustic wave will be reflected from the open end and the pressure will be inverse, which is consistent with the above theoretical analysis and is demonstrated in the following experimental observations.
As for the rigid closed end, the boundary condition is assumed to be zero velocity considering the high acoustic impedance of the glass sleeve. Consequently, when the acoustic wave reaches the closed end, part of the acoustic wave is reflected and part of it is transmitted to the glass tube. Based on the above theory of an acoustic field in a narrow channel, the transmission of an acoustic wave to the closed end can be regarded as the propagation of a sound wave in the tube with sudden shrinking cross section, that is, the interface changes from  $S_2$ to 0. Consequently, we can obtain
 $r_{p}=1$, that is, the pressure wave is fully reflected at the closed end and the original properties of the pressure wave remain unchanged.
Then we take into account the loss of sound waves caused by the micro-orifice. Sound waves pass through the constraints of the small hole to a relatively open space. We use  $S_3$,
 $S_4$ to denote the cross-sectional area of the inkjet orifice and the outer silicone oil bath, as shown in the inset of figure 7(b):
 \begin{equation} r_{p}=p_{ar}/p_{ai}=(S_{43}-1)/(S_{43}+1), \end{equation}
where  $S_{43}=S_3/S_4$. Considering
 $S_4\gg S_3$, we can obtain
 $r_{{p}} \approx -1$. As the acoustic wave in contact with the interface at the orifice, most of the energy will be bounced back due to the constraint boundary conditions. Although in practice there will inevitably be some energy dissipation, the experimental results (figures 6 and 8) show that this part of the energy dissipation is quite weak. To simplify the analysis, we first ignore this part of acoustic loss.
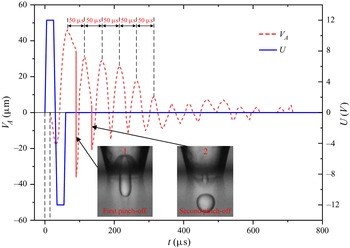
The whole process of interface vibration, droplet formation and vibration attenuation under the action of a single driving waveform. The red dashed curve is the interface vibration amplitude. The blue line is the driving signal waveform. The insets show the critical state at which the liquid column is about to pinch off.

Guided by the above ideal theoretical understanding, the generation and propagation process of pressure waves in the real piezoelectric nozzle were analysed, as shown in figure 7(c). The time when the waveform is applied to the piezoelectric actuator is denoted as the initial time  $t_0$. The chamber filled with DIW will expand when the piezoelectric element is stimulated by a rising edge, and a negative pressure wave will be generated in the chamber. The pressure wave splits itself into halves that propagate in opposite directions, as shown at time
 $t_1$. When the negative pressure wave reaches the nozzle orifice and the open end, it will be reflected as stated in the above theoretical analysis, forming a positive pressure wave at the open end, and still a negative pressure wave at the closed end. The negative pressure at the orifice will trigger the withdrawal of the interface, as shown in
 $t_2$, which also corresponds to the interface withdrawal process at the time of 10
 $\mathrm {\mu }$s in figure 6.
In the optimal situation, the falling edge is applied when the positive pressure wave returns from the open end reaches near the central position, causing a contraction of the piezoelectric ceramics, which induces a positive pressure at time  $t_3$. Similarly, this positive pressure will split into halves and propagate towards opposite directions. Based on the above linear assumptions, the positive pressure moving to the closed end will superimpose with the positive pressure wave reflected from the open end, and the positive pressure moving to the open end will cancel the negative pressure wave reflected from the closed end, as shown at time
 $t_4$, achieving the most efficient use of system energy.
Then the superimposed positive pressure will propagate towards the closed end, inducing an energy enrichment at the conical orifice. This will trigger a flow field outward, which causes the interface to move outward, and results in a deformation of the interface until it reaches the maximum deformation state. As for the specific manifestation of flow field caused by a pressure wave at the nozzle outlet, we discuss this in detail in § 4.2. Here, we only make a rational explanation. At the same time, the positive pressure wave continues to propagate to the open end after reflection. Here  $t_5$ and
 $t_6$ characterise this process in detail.
When the positive pressure wave reaches the open end, it will be reflected by the open end and converted into a negative pressure wave, propagating towards the closed end. When the negative pressure wave passes through the centre of the nozzle,  $t_7$, a rising edge is applied to restore the piezoelectric ceramic element to its initial state. Consequently, a negative pressure wave is induced at this time node that then splits into halves propagating towards the opposite direction. The negative pressure wave reflected from the open end will superimpose onto the newly generated negative pressure propagating towards the closed end. The new generated negative pressure moving in the opposite direction can be neglected compared with the superimposed pressure moving towards the closed end. Therefore, the subsequent studies only consider the propagation of one main pressure wave. The time interval between
 $t_3$ and
 $t_7$ is exactly the time it takes for the pressure wave to circulate once in the channel, based on which the optimal working time of the driving waveform can be designed.
Then the negative pressure wave reaches the closed end, triggering an inward flow field inducing the withdrawal of the interface. If the deformation of the interface is large enough during the period  $t_5$–
 $t_6$, a droplet can be formed during the withdrawal stage at
 $t_8$. As shown at
 $t_9$ and
 $t_{10}$, the residual energy in the system will make the interface continue to vibrate until the energy is exhausted by viscous dissipation or the next action cycle comes. The interface vibration driven by the residual energy requires the pressure wave to complete two circulations in the channel. For this system, the vibration period caused by the pressure wave propagating in the nozzle can be calculated by
 \begin{equation} {\rm \Delta} t=4\,l / c,\end{equation}
where l is the effective length of the piezoelectric nozzle,  $l = 19.5$ mm in this paper, and c is the speed of pressure waves in the fluid (1490 m s
 $^{-1}$ for DIW at room temperature). Thus, the theoretically calculated
 ${\rm \Delta} t$ is 52.3
 $\mathrm {\mu }$s, which is determined by the geometrical structure of the nozzle and is close to the interface vibration period shown in figure 6 (about 45
 $\mathrm {\mu }$s).
To verify the universality of this description, another set of experiments, different from the driving parameters in figure 6, was selected to extract the contour of the interface frame by frame. The distance from the top or trough of the interface to the centre of the orifice was defined as vibration amplitude ( $V_{A}$).
 $V_{A}$ is defined as positive when the interface protruding out of the orifice, and vice versa, as negative. The evolution curve
 $V_{A}$ combining with the driving waveform
 $U$ are drawn in figure 8. The time interval
 ${\rm \Delta} t$ between the interface vibration peaks is steadily at about 50
 $\mathrm {\mu }$s, which is the result of the stable propagation of pressure wave inside the nozzle and consistent with the above inference. The statistical results have a maximum time error of 5
 $\mathrm {\mu }$s originating from the time resolution of the high-speed camera. It also can be seen from figure 8 that after reaching the first peak, the interface rapidly withdraws and breaks at the base of the liquid column, forming a droplet and new interface. This process is defined as the first pinch-off (figure 8, inset 1). Owing to the formation of the primary daughter droplet consuming most of the system energy, the second vibration peak is significantly lower than that of the first vibration. However, the second pinch-off can still occur and a second daughter droplet can be formed as long as the deformation is sufficient (figure 8, inset 2). This droplet is called the secondary droplet. The third vibration and the following vibrations do not pinch off any droplet due to their insufficient vibration amplitude. It seems that there exists a critical vibration amplitude, below which no droplet will be pinched off.
The formation of daughter droplets, interface vibration and wave propagation in the nozzle channel all require energy consumption, so the interface vibration peak gradually attenuates until it is too small to be observed. In most of the experimental trials, more than 10 times of vibrations can be detected following a single stimulation.
4.2. Mechanism analysis of the interface pinch-off behaviour
The above contents revealed the underlying physics of how the stimulation signal controls the interface behaviour by generating pressure waves in the piezoelectric nozzle. The next question that needs to answer is: why droplets can be pinched off during the suction process in the liquid environment? The answer cannot be found in the literature because the inkjet researchers mainly focused on the ejection process in gaseous environments.
The one-to-one comparison of the numerical and experimental results is shown in figure 4, which demonstrates the reliability of the simulation. Then the corresponding velocity and pressure evolution at the orifice centre were obtained to reveal the interface behaviour, as shown in figure 9. The calculated amplitude of the pressure is basically lower than that of the theoretical values calculated in other literatures for inkjet printing in air (Wijshoff Reference Wijshoff2010). This is because CIVIJP technology does not require droplets to be ejected out from the nozzle, so the fluctuation of internal pressure is not as drastic as that of inkjet printing in air. The maximum velocity during the withdrawal process is about 4.5 m s $^{-1}$, which agrees well with the results extracted from the high-speed camera, 4 m s
 $^{-1}$. The oscillatory velocity is in good agreement with the vibration period of the interface.
Evolution diagram of the velocity and pressure at the orifice centre with time. The red dashed curve represents the pressure evolution at the orifice centre, whereas the blue solid line represents the velocity. The results were obtained from the post-processing of the simulation in figure 4.

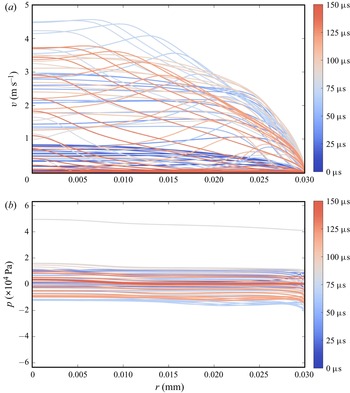
The velocity and pressure profile along the  $r$-direction at the orifice are shown in figure 10 to promote the understanding of the deformation of the interface. One can see that the velocity profile is inconsistent with the theory of Womersley number. The velocity profile is nearly a flattened curve after increasing from 0 m s
 $^{-1}$ to the corresponding value, and in some cases there also exist a peak near the boundary layer. The velocity profile in figure 10(a) demonstrates the reasonability of the premise in § 3. However, the pressure profile along the
 $r$-direction shown in figure 10(b) only evolves with time, which shows little pressure difference along the
 $r$-direction at one moment. Figure 10(b) shows the radial pressure distribution at the orifice of the nozzle. It can be seen that the pressure is basically constant along the radial direction in most cases, which also confirms the assumption that the pressure wave in the channel is a plane wave. The spatial distribution and temporal evolution of velocity and pressure provide more details about the working mechanisms of CIVIJP.
Evolution diagram of the velocity and pressure along the  $r$-direction at the orifice with time. The results were obtained from the post-processing of the simulation in figure 4.

In order to have a clearer understanding of the underlying physics of the dispensing of daughter droplet, theoretical estimation of forces applied on the interface during the push–pull process was carried out. Considering the difficulties of obtaining the evolution details at any points on the interface at any time, only some representative key time nodes were focused on by combining the high-speed images and simulation results. Similarly, the central axis of the nozzle was set as the  $x$-axis and the radial axis as the
 $r$-axis to establish the cylindrical coordinate, as shown in figure 11(c). The interface contour is expressed as
 $R$(
 $x,t$), which is not only related to the spatial position, but also evolves with time.
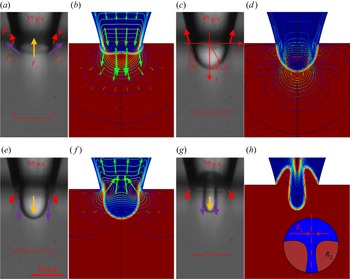
Force and flow field analysis for different interface evolution states. (a) Interface profile and force analysis during the interface expansion process. The red arrow denotes the interfacial force  $\boldsymbol{\mathsf{F}}_{\sigma}$, the yellow arrow denotes the inertial force
 $F_{i}$, whereas the purple arrow represents the viscous force
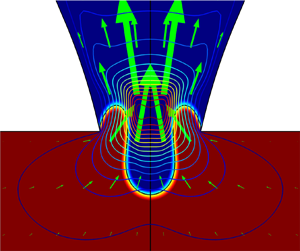
 $F_{\mu }$ applied on the interface. (c) Peak state of the interface. (e) Interface profile at the beginning of withdrawal. (g) The interface profile reaches its deformation limit during the withdrawal. (b,d,f,h) Simulation results corresponding to (a,c,e,g), respectively. The green arrows indicate the flow field and the contour lines indicate the contoured velocity. The red curves at the bottom of (a,c,e,g) are the simulated velocity profiles along the radial direction at the orifice.

Figures 11(a), 11(c), 11(e) and 11(g) are the interface profiles obtained by the high-speed camera. Figures 11(b), 11(d), 11(f) and 11(h) are the simulation results showing the interface, velocity field and contour lines in detail. As for the CIVIJP technique, the core processes of the interface behaviour are the ‘push’ process to extrude the ink out of the orifice forming a plump droplet suspended at the orifice; and the ‘pull’ process to withdraw the ink and carrier liquid into the orifice forming a slender column, which finally pinches off and generates one droplet. As shown in figures 11(a) and 11(b), driven by the inward velocity field, the interface expands and gradually reaches its deformation limit (figure 11c). The velocity profile along the radial direction of the orifice were depicted by the red curve shown at the bottom of figure 11(a). It can be seen that during the ‘push’ process the velocity profile is simple due to the regular topology of the interface. When the interface reaches its extreme deformation, the flow field is almost stationary, as indicated by the velocity profile in figure 11(c) and the flow field in figure 11(d).
Then the direction of the velocity field is reversed and the interface begins to shrink as shown in figure 11(e). At the beginning of the withdrawal, the velocity near the wall is faster than that at the centre of the nozzle, which can be seen in figures 11(e) and 11(f). The velocity profile shown in figure 11(e) corresponds to a scenario with a large Womersley number. The velocity profile in this form will cause the surrounding liquid to suck faster into the nozzle, whereas the liquid in the middle moves slower and forms an overturning of the interface. This process is critical for the formation of the liquid column. Then the velocity profile changes gradually as shown in figure 10(a), the ink in the centre flows inward faster than the surrounding medium and the interface begins a neck-pinching process, as shown in figures 11(g) and 11(h).
During the ‘push–pull’ process, there exist gravity, inertial force  $F_{i}$, viscous force
 $F_{\mu }$ and interfacial force
 $\boldsymbol{\mathsf{F}}_{\sigma}$, which comprehensively affect the interface behaviour. The gravity can be neglected as discussed previously. In our case, the characteristic velocity of the interface,
 $v$, varies from 0 to 4 m s
 $^{-1}$, the viscosity of the carrier liquid is 20 mPa s, therefore, the Reynolds number
 $Re = \rho _2 v d / \mu _2$, the ratio of inertial force to viscous force, can be estimated ranging from 0 to 240, and capillary number
 $Ca=\mu _1 v / \sigma$, the ratio of viscous force to interfacial force, ranging from 0 to 2.85. The viscous force
 $F_{\mu }$ contributed by the ink is neglected because the viscosity of the ink is much lower than the carrier liquid. The value of
 $Re$ and
 $Ca$ indicating that none of the inertial, interfacial and viscous force can be ignored and all of them play their roles at certain moment.
Based on the statistics of the experimental results, we estimated the magnitude of the three forces during the interface vibration process. During the vibration process, the three-phase contact line is pinned at the edge of the orifice. The axial component of the interfacial force  $\boldsymbol{\mathsf{F}}_{\sigma}$ generated at the edge of the orifice can be approximately calculated by
 $\boldsymbol{\mathsf{F}}_{\sigma}={\rm \pi} \sigma D_{o} \cos \theta$ (
 $\theta$ is defined as shown in figure 11c) during the whole vibration process,
 $\boldsymbol{\mathsf{F}}_{\sigma}$ is no more than 5
 ${\rm \mu}$N. Here
 $F_{i}$ can be estimated based on Newton's second law
 $F_{i}=-m a$, where
 $m$ is the mass of the liquid (ink and carrier liquid) close to the interface which has significant velocity and acceleration variation,
 $a$ is characteristic acceleration of the interface which can be obtained by the high-speed images. Here,
 $m$ is estimated as twice the mass of the mother droplet with maximum volume. During the vibration process, the absolute value of
 $a$ varies from 0 to a maximum value of about
 $3 \times 10^{5}$ m
 $\mathrm {s}^{-2}$. The above data results in
 $F_{i}$ in the range of 0 to 40
 ${\rm \mu}$N. The viscous force
 $F_{\mu }$ is estimated by the formula
 $F_{\mu }=2{\rm \pi} \mu _{1} r v (2\mu _{1}+3\mu _{2})/(\mu _{1}+\mu _{2})$, and the estimated
 $F_{\mu }$ is in the range of 0–30
 ${\rm \mu}$N.
As shown in figure 11(a), during the extrusion process, the deformation of the interface is mainly resisted by the viscous force, and inertial force, which are estimated to be tens of micronewtons, whereas the corresponding interfacial force is estimated to be less than 5  ${\rm \mu}$N. When the interface reaches its extreme deformation (figure 11c), there is a nearly quiescent state last for several microseconds. At this moment, both the velocity and acceleration are close to zero. Therefore, the viscous force and inertial force can be neglected and the evolution of the interface is dominated by the interfacial force
 $\boldsymbol{\mathsf{F}}_{\sigma}$.
During the early stage of withdrawal process, as discussed previously, when the interface is at the state shown in figure 11(e), the viscous force and the inertial force hinders the reflux of the ink outside the orifice. However, the direction of  $\boldsymbol{\mathsf{F}}_{\sigma}$ is the same as the reflux direction and will prompt the reflux of the ink at this stage. It should be noted that
 $\boldsymbol{\mathsf{F}}_{\sigma}$ will change direction at the later stage of the withdraw due to the emergence of the overturning of the interface. At this stage, the velocity of the liquid near the edge of orifice is bigger than that at the centre, as shown in figures 11(e) and 11(f), resulting in the interface close to the orifice retreating faster than the interface far away from the orifice and the emergence of overturning, as shown in figures 11(g) and 11(h). At the later stage of withdrawal, the velocity and acceleration approach to zero, the viscous force and the inertial force no longer plays the dominant role; the neck of the column becomes sufficiently thin for capillary instability to set in. According to the Young–Laplace equation:
 \begin{equation} {\rm \Delta} p=\sigma\left(\frac{1}{R_{1}}+\frac{1}{R_{2}}\right),\end{equation}
where  $R_1$ and
 $R_2$ are the principle radii of curvature, as shown in the inset of figure 11(h), the Laplace pressure induced by interfacial force in the neck zone will increase rapidly due to the thinning of the neck. Although the droplet does not pinch off at this moment, the Laplace pressure will prompt the ink to be squeezed out of the neck and accelerate the thinning process. The further thinning of the neck will in turn further increase
 ${\rm \Delta} p$ and accelerate the drainage, and eventually results in the pinch-off during the subsequent ‘push’ process.
After pinch-off, a new interface is formed at the orifice. The propagation of the residual energy in the nozzle will cause the repeated oscillations of the new interface. Owing to the existence of carrier liquid film between the daughter droplet and the new interface, the droplet and the interface will not coalesce in the subsequent vibration process. The residual oscillation will push the daughter droplet away from the nozzle orifice for a certain distance, corresponding to the process shown in figure 6 from 165 to 355  $\mathrm {\mu }$s and supplementary movie 1.
Although  $F_{i}$ and
 $F_{\mu }$ obstruct the interface's movement and deformation during the whole process, they are beneficial to the formation of liquid column during the withdrawal process. During the withdrawal process, the roles of
 $F_{i}$ and
 $F_{\mu }$ are critical, especially the viscous force, which is decisive to deforming the hemispherical mother drop into the liquid column, the precursor of the daughter droplet. At the end of the withdrawal process, the thin column will pinch off at its base under the action of interfacial force according to the Rayleigh-plateau instability. For a conventional inkjet printer in a gaseous environment, if the driving signal is weak and the critical jet velocity cannot be reached, the interface will also oscillate at the orifice (Bogy & Talke Reference Bogy and Talke1984; Zhang et al. Reference Zhang, Li, Liu and Wittstock2018a). However, owing to the insufficient viscosity and density of air, it is nearly impossible to transform the suspended drop into a liquid column during the drainage process and pinch off droplets much smaller than the orifice (Chen & Basaran Reference Chen and Basaran2002).
These analyses may answer why droplets can be pinched off during the suction process and what is the fundamental difference between CIVIJP and traditional inkjet printers in a gaseous environment. The whole process indicates that the CIVIJP in liquid is an interface behaviour dominated by pressure waves generated in the nozzle and the viscous force, inertial force and interfacial force contributed by the carrier liquid. One can see that the mechanism of CIVIJP is totally different from that of conventional inkjet printing (Singh et al. Reference Singh, Haverinen, Dhagat and Jabbour2010; Wijshoff Reference Wijshoff2010).
4.3. Exploration on the various interface behaviour
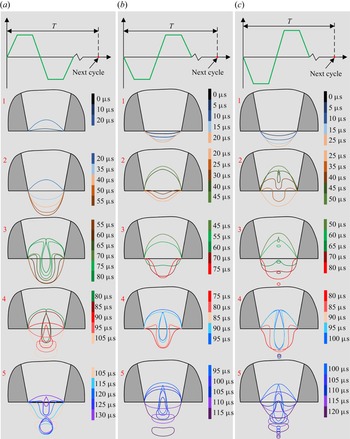
For the experimental research on conventional inkjet printing in a gaseous environment, the driving waveform shown in figure 2 is mostly used to realise the most efficient energy utilisation and to achieve a good droplet jetting effect. As for our CIVIJP technique, there are no special requirements for the driving waveforms as long as the waveforms can realise sufficient deformation of the interface. Here, the conventional waveform and corresponding reversed waveform were utilised to perform two groups of control tests as shown in figures 12(a) and 12(b) to explore the different interface behaviours induced by different waveforms. All the interface contours are extracted from images obtained by the high-speed camera.
Different interface behaviours corresponding to different waveforms: (a) conventional waveform, amplitude  $\pm$10 V; (b) reversed waveform, amplitude
 $\pm$10 V; (c) reversed waveform, amplitude
 $\pm$14 V and all other parameters are consistent with (b).

For the commonly used waveform  $a$, the droplet formation process is as follows. 1. The negative pressure wave reaches the orifice, and the interface begins to withdraw. 2. The positive pressure wave drives the interface outward until it reaches the deformation peak. 3. The interface retracts and causes the liquid column to pinch off under the action of an inward flow field induced by the negative pressure wave. 4. The newly formed interface continues to expand outwardly under the action of the residual energy. If the following interface oscillation amplitude is large enough, a secondary or even a tertiary daughter droplet can be formed in the subsequent oscillation, that is, stage 5 shown in figure 12(a). If the deformation is insufficient to form a new droplet in stage 5, the interface will only vibrate continuously in the following process.
For the reversed driving waveform in figure 12(b), the interface behaviour is different from figure 12(a), and the main process is as follows. 1. A positive pressure wave generated by the piezoelectric ceramic contraction causes the interface to expand outwardly. 2. The superimposed negative pressure wave containing a large amount of energy causes an obvious inward deformation of the interface. 3. Driven by a reflected positive pressure wave, the interface protrudes outward until it reaches its maximum deformation. 4. The retracting interface forms a slender liquid column, and the liquid column pinches off near its base forming a fine droplet. 5. The newly formed interface continues to oscillate driven by the residual energy. The dynamic comparison between waveform  $a$ and
 $b$ is shown in supplementary movie 2.
If the driving energy in figure 12(b) is increased, as shown in figure 12(c), a daughter droplet will be formed in stage  $c2$ when the interface first protrudes and then draws back. Then the interface continues to oscillate and a secondary daughter droplet will be formed in stage
 $c4$. Different from waveform
 $a$, the secondary daughter droplet formed by
 $c$ in stage
 $c4$ is generally larger than the primary daughter droplet formed in stage
 $c2$, which is determined by the greater energy of the second deformation. A tertiary daughter droplet can also be formed in the following oscillation as stated previously. Furthermore, the finer droplets formed in the stage of
 $a5$ and
 $c2$ can be eliminated or suppressed to a certain extent by adjusting the waveform parameters, as shown in supplementary movie 3.
4.4. Analysis of the energy, interface deformation and droplet size
Based on the above analysis, we have a relatively clear understanding of the propagation process of the pressure wave in the nozzle and the overall behaviour of the interface, as well as the specific process of the formation of fine droplets by interface vibration. The fundamental principle of droplet pinching off has also been revealed in detail, but the question of how the interface behaviour dominates the droplet size has not been answered.
Combined with the above analyses, the formation of droplets is determined by the interface behaviour no matter how the parameters of the driving signal are regulated. The initial intuitive impression is that the droplet size is directly related to the interface deformation peak and suction speed. As illustrated in figure 8, for the same ink and carrier liquid system, the interface vibration periods are basically the same, but the volume of the mother droplets are different under different working conditions, which is determined by the flow field induced by the pressure wave:
 \begin{equation} V=\int_{t_{0}}^{t_{m}} {\rm \pi}R_{o}^{2} v \, {\rm d} t,\end{equation}
where  $V$ is the volume of the mother droplet,
 $v$ is the average velocity flowing through the nozzle orifice,
 $t_0$ is the initial time node when the driving signal is applied and
 $t_{m}$ is the time node when the interface reaches the maximum deformation.
It can be seen from (4.14) that the greater the kinetic energy given to the flow field by the pressure wave, the greater the volume of the mother droplet and the greater degree of interface deformation for a basically fixed time interval between  $t_0$ and
 $t_{m}$. Consequently, the reflected negative pressure is endowed with higher energy and the suction velocity will be greater. That is, there is a direct positive correlation ship between the interface deformation peak and the suction speed. Here, the interface deformation peak is considered to represent the energy transmitted by the pressure wave to discuss the influence of system energy on interface behaviour and droplet size.
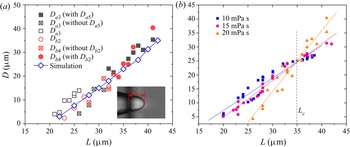
The inset in figure 13(a) illustrates the definition of the interface deformation amplitude  $L$ (the distance between the interface deformation vertex and the nozzle orifice). There are two sets of data in figure 13(a) corresponding to the interface deformation limit
 $L$ and droplet diameter
 $D$ of the waveforms in figures 12(a) and 12(b) under different working conditions respectively. For waveform
 $a$, the regulation of
 $L$ is realised by adjusting the time parameter. For waveform
 $b$, the driving voltage amplitude is adjusted to realise the variation of
 $L$. Then the relationship between the droplet size
 $D$ and the interface deformation limit
 $L$ is explored comprehensively.
Relationship between the interface deformation limit  $L$ and the corresponding droplet diameter
 $D$. (a) The detailed data analysis when the viscosity of the carrier liquid is 20 mPa s. The black box data points are the diameters of daughter droplets obtained by changing the time parameters of waveform
 $a$. The solid box data points denote the droplets formed in stage
 $a3$ of figure 12 under large energy, and the subsequent stage
 $a5$ can still dispense a finer daughter droplet (the hollow box data points). The hollow box data points filled with
 $\times$ are the size of the droplets formed in stage
 $a3$ without subsequent droplet generation in
 $a5$. The red circular data points indicate the relationship between
 $D$ and
 $L$ by changing the voltage amplitude of waveform
 $b$ in figure 12. The solid data points are the diameters of the daughter droplets formed at stage
 $b4$ under large energy, and a finer droplet (the hollow data points) can be formed in stage
 $b2$ accordingly. The hollow data points filled with
 $\times$ are the size of the droplets formed only in the
 $b4$ stage without finer droplet generation in
 $b2$. The blue hollow data points are the simulation results using the driving waveform in figure 12(a). (b) The influence of the carrier liquid viscosity on the droplet size.

With low-energy input, the vibration amplitude of the interface is too small to generate a droplet. Further increasing the input energy will result in the realisation of CIVIJP in a liquid phase. There should be a critical vibration amplitude, below which no droplet will be pinched off. The CIVIJP method can facilely prepare droplets with diameters of about 1  $\mathrm {\mu }$m, but due to the limitation of the observation resolution and large statistical error, the corresponding data are not shown in figure 13(a). With the increase of energy endowed to the interface, the daughter droplet formed in stages
 $a3$ and
 $b4$ also linearly increase. If the energy given to the system continues to increase, droplets can be formed not only in the
 $a3$ and
 $b4$ processes, but also in stages
 $a5$ and
 $b2$. The interface behaviours are shown in figure 12, corresponding to the solid and hollow data points in figure 13(a). All the droplet sizes
 $D$ show very a good linearity with the interface vibration amplitude
 $L$. However, the ink can be ejected into the carrier liquid if the driving energy is strong enough. In this case, the inertial force and viscous force are dominant due to the large volume of the drop. The droplet is ejected out with a long tail, which will not break at the stage of outward expansion, and will not break until the suction reaches a large extent. Then, due to the significant residual energy of the system, the interface will continue to oscillate, and the carrier liquid will be entrapped in ink, which is a very complicated phenomenon and is adverse to the CIVIJP, which is something that CIVIJP is trying to avoid. Furthermore, the two sets of data obtained by changing different parameters to achieve the regulation of interface vibration amplitude to prepare droplets with different size also show a very good coincidence degree.
In addition, it can be found from figure 13(a) that, under the same interface deformation amplitude  $L$, the secondary droplet generated by waveform
 $a$ in stage
 $a5$ is slightly larger than the primary droplet formed in stage
 $a3$, whereas there is no such phenomenon for waveform
 $b$. Combined with the above analysis of interface behaviour, we believe that for waveform
 $a$, the primary daughter droplet generated in stage
 $a3$ is large enough compared with the secondary droplet generated in stage
 $a5$, and has not been pushed to a far distance by the following vibration. Thus, it plays an anchoring role on the interface in the second interface retraction stage,
 $a5$, making the second interface retraction have more obvious stretching under the same
 $L$, forming a slightly larger secondary droplet, as shown in figure 12(a5). When waveform
 $a$ first generates the primary droplet in stage
 $a3$, there is no droplet influence around, then there is no such anchoring effect as stated previously. By contrast, waveform
 $b$ in phase
 $b2$ has not been in a state of maximum energy, the droplet formed in this phase is generally small and its influence on subsequent vibration is not obvious. Moreover, the vibration of phase
 $b4$ is in the maximum energy state, the influence of the prior small droplet is weaker. Therefore, both the interface deformation in stages
 $b2$ and
 $b4$ can be regarded as free vibration. Thus, the size of droplets formed in stages
 $b2$ and
 $b4$ are similar at the same interface vibration amplitude, which have a good coincidence degree. Furthermore, the statistical data of the simulation also have a good coincidence degree with the experimental results.
Then the influence of viscosity of the carrier liquid on the droplet formation is explored to demonstrate the suitability of this CIVIJP technique for different carrier liquid (figure 13b). Interestingly, it can be found that three groups data of different viscosity cross at the same intersection, the corresponding interface deformation amplitude is defined as  $L_{c}$, as indicated by the dashed line in figure 13(b). When the interface deformation is smaller than
 $L_{c}$, the droplet size will decrease with increasing viscosity of the carrier liquid. In contrast, when the interface deformation is greater than
 $L_{c}$, the droplet size will increase with increasing viscosity of the carrier liquid. Because the withdrawal time is fixed, the larger deformation will result in a larger suction speed and greater
 $Ca$. The characteristic capillary number when the deformation is
 $L_{c}$ is defined as
 $Ca^*$. When
 $L$ is greater than
 $L_{c}$, the corresponding
 $Ca$ is greater than
 $Ca^*$, meaning that the viscous force plays a dominant role during the withdrawal process. Therefore, the higher the viscosity of carrier liquid during withdrawal, the more liquid is left behind in the carrier liquid for the same interface deformation. When
 $L$ is smaller than
 $L_{c}$, the effect of interfacial force becomes more significant, especially during the neck pinching-off process. The smaller the viscosity of the carrier liquid, the faster the interface evolves, the more ink can be locked and the larger the droplets that can be formed. We can see that the viscosity of the carrier liquid also has an effect on the threshold of the deformation amplitude. The lower the viscosity of the carrier liquid, the smaller critical vibration amplitude is required for droplet generation.
Figure 13 discussed the relationship between  $L$ and
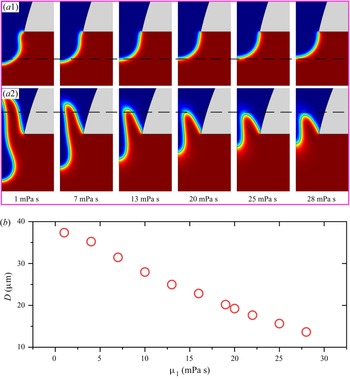
 $D$, and the influence of the carrier liquid viscosity on the output of the CIVIJP technique in the case of the same interface deformation. However, it is difficult to control the interface deformation degree to keep the same in different working scenarios in practice. It is easier to control the driving parameters. Therefore, the influence of the viscosity of the carrier liquid on the printing effect under the same driving parameters and same ink were investigated through simulation. Figure 14(a1) shows the extreme extrusion deformation at the same time when the viscosity of the carrier liquid is different. It is found that when the viscosity of the surrounding medium is low, the interface ultimate deformation is larger. With the increase of the viscosity of the surrounding medium, the deformation decreases. Figure 14(a2) shows the extreme withdrawal deformation at the same time. Similarly, we found that the lower the viscosity of the carrier liquid, the greater the interface deformation during the withdrawal process. Consequently, the corresponding droplets will decrease with the viscosity, as shown in figure 14(b). It can be seen that when the driving parameters are the same, the diameter of the droplet formed by CIVIJP will decrease approximately linearly with the increase of viscosity of carrier liquid
 $\mu _1$.
The influence of the dynamic viscosity on the droplet generation under the same driving parameters. (a) The extreme deformation of the interface during the (a1) extrusion and (a2) withdrawal process for the carrier liquid with different viscosity. (b) The relationship between the diameter of the droplet  $D$ versus the dynamic viscosity
 $\mu _1$ of the carrier liquid.

The above analyses show that the presence of droplets and the size of droplets are comprehensively determined by the energy given to the system by the driving signal and the properties of the liquid phases. The interface behaviour can be easily regulated by controlling the driving signal settings, that is, by the CIVIJP method, the nozzle with an outlet diameter of 60  $\mathrm {\mu }$m can be used to print droplets ranging from 1 to 60
 $\mathrm {\mu }$m in diameter. Figures 15(a)–15(c) show the preparation of droplet of different sizes using the conventional waveform in figure 12(a).
Inkjet printing in the liquid environment by the CIVIJP method. Different printing results are realised using an inkjet nozzle with an inner diameter of 60  $\mathrm {\mu }$m by regulating the interface behaviour. Prepared droplets with diameters of (a) less than 5
 $\mathrm {\mu }$m, (b) about 13
 $\mathrm {\mu }$m and (c) about 30
 $\mathrm {\mu }$m. With the increase of vibration amplitude, the primary droplet is accompanied by a secondary droplet. (d) Three droplets with different diameters were generated orderly by single inverted waveform stimulation at a high-energy state.

The small droplet generated by the previous excitation signal is suspended near the nozzle and can be used to indicate slight interface behaviour, for example, the slight withdrawal at 10  $\mathrm {\mu }$s as shown in figure 15(a). What can be clearly seen is that the greater the deformation peak of the interface, the greater the degree of inward withdrawal and the larger the size of the droplet formed. Figure 15(d) illustrates a large deformation degree of the interface realised by using the waveform in figure 12(b). The interface is first extruded out and then withdrawn back to form a small droplet. After forming a large droplet in the
 $b4$ stage, the residual energy is still large enough to form a small tertiary droplet, which is in good agreement with the previous theoretical analysis. If the energy is strong enough, even four droplets can be obtained with a single excitation signal. Supplementary movie 4 shows the formation process from 0 to 4 daughter droplets.
After the droplet is pinched off, the next task is to realise the manipulation of droplet. In terms of inkjet printing, there are actually two core processes: droplet generation and droplet manipulation, but the conventional printing method basically combines the two into one, that is, droplets are ejected out of the orifice at a certain speed, followed by striking on the target substrate (Lohse Reference Lohse2022). Thus, the possibility of additional control over the motion of the printed droplet is lost. The CIVIJP technique proposed by us divides droplet formation and manipulation into two independent parts. They can be controlled by an external electric field after being generated (Zhang et al. Reference Zhang, Li, Liu and Wittstock2018a) or by controlling the subsequent vibration amplitude of the oil/water interface, which can only vibrate at high frequency without producing droplets, the droplet can be precisely propelled to the target position driven by a directional flow field (Li et al. Reference Li2021). Based on the above description, we provide the opportunity to perform additional control of the droplet motion, making manipulation of the droplet more flexible.
5. Conclusions
In this paper, we have systematically studied how the driving signal dominates the confined oil/water interface behaviour at the orifice and the decisive role of interface behaviour on daughter droplet formation.
We have found that more than 10 times of interface vibrations with regressive amplitude, but constant period, can be triggered by just one stimulation. One-dimensional wave equations of linear acoustics were used to explain the generation, propagation, reflection and superposition of the pressure wave within the nozzle. The theoretical explanation of the propagation of the pressure wave and the vibration behaviour of the confined interface are in good agreement.
The pinch-off process, governed by the interface vibration behaviour, was studied experimentally and numerically. The detailed theoretical analyses of the forces and velocity field during the extrusion, drainage and pinch-off processes were performed based on the experimental results and the simulation calculation to reveal the droplets pinch-off mechanism, which was different from that of traditional inkjet printing in a gaseous environment. For traditional inkjet printing, droplets were formed during the ejection process once the kinetic energy of drops overcomes the surface energy. However, for the CIVIJP, the daughter droplets are formed at the end of the drainage process due to the deformation of the oil/water interface results from the combined effects of the inertial force, viscous force and interfacial force.
The interface behaviours of CIVIJP were comprehensively investigated by using waveforms with different polarity, time and amplitude settings. Both the size and quantity of the pinched droplets by a single stimulation can be regulated. The interface behaviours were reviewed from the perspective of energy. We found that the size of the droplets is linearly dependent on the vibration energy, represented by the interface deformation limit.
Compared with conventional inkjet printing in a gaseous environment, CIVIJP in a liquid phase does lose some efficiency, but it has extended inkjet printing technology to liquid for the first time. Second, the CIVIJP described in this paper can be used to obtain droplets much smaller than the nozzle size, which is difficult to realise with conventional inkjet printing. We believe that the systematic study of this full text expounds the physical process of CIVIJP in liquid, provides a theoretical guidance for understanding the interface behaviour and realising stable CIVIJP in liquid, which will promote the industrial application of CIVIJP technology.
Supplementary movies
Supplementary movies are available at https://doi.org/10.1017/jfm.2022.716.
Acknowledgements
We thank Professor H. Fang, Dr X. Wei and Y. Ren for fruitful discussions on the numerical simulations.
Funding
This work was financially supported by the National Natural Science Foundation of China (grant nos. 52075548 and 51774316), the Taishan Scholar Program of Shandong Province (grant no. tsqn201909068), the Excellent Young Scientists Fund of Shandong Province (grant no. 2022HWYQ-071), the Fundamental Research Funds for the Central Universities (grant No. 20CX06074A), the Science and Technology Support Plan for Youth Innovation of Universities in Shandong Province (grant no. 2019KJB016), the National Key Research and Development Program of China (grant no. 2019YFE0105100) and the Graduate Innovation Project of China University of Petroleum (East China) (grant no. YCX2021073).
Declaration of interests
The authors report no conflict of interest.
Appendix A. Geometric model simplification
We first explored the full-size simulation model, as shown in figure 16(a). It can be seen that the nozzle outlet (diameter 60  $\mathrm {\mu }$m) is very disproportionate to the inkjet channel (diameter is more than 600
 $\mathrm {\mu }$m, length of the channel is about 20 mm). What we need to pay attention to is only a small zone near the initial interface to reveal the evolution of the interface, as indicated by the blue dotted line. Compared with the simplified model, a great amount of calculation is required for the full-size model with the same mesh quality, (the calculation time of the full-size model is 30 times that of the simplified model). According to the previous literature, the velocity field was adopted to drive the simulation, a small zone near the nozzle outlet was selected and obtained satisfactory results (Zhong et al. Reference Zhong, Fang, Ma and Dong2018; Wang et al. Reference Wang, Zhong and Fang2019). After the preliminary study on the full-size simulation model, we found that the same results can be achieved by using the equivalent velocity to drive the intercepted nozzle, which can improve the calculation speed and minimise the loss of details. Three models reduced in size are shown in figures 16(b)–16(d).
Geometric model simplification. (a) The full-scale model. (b–d) The length reduced model.

We compared models of different length and found that the pressure and velocity distribution at the orifice and interface behaviour were basically the same driven by the same equivalent velocity. The velocity profiles obtained from figures 16(b)–16(d) driven by the equivalent velocity field are very consistent. Finally, the model in figure 16(d) was selected in the numerical simulation.
The width of the model  $W$, defined in figure 17(a) also has an effect on the output of simulation. Here we carried out a parametric sweep about this quantity. The results show the simulation results become steady when the model is wide enough. Here,
 $W=0.4$ mm was adapted in our model, which corresponds to the real outer diameter of the inkjet nozzle.
Model stability test. (a) Definition of the model width. (b) The droplet diameter variation with the width of the model.

Appendix B. Detailed settings of the boundary condition
The ink is set as water, as indicated by the light bluish-purple zone of the nozzle; the carrier liquid is set as silicone oil with dynamic viscosity  $\mu _1$ of 20 mPa s in the grey zone of figure 3(a), and the interfacial force coefficient
 $\sigma$ is set as the measured value, 28 mN m
 $^{-1}$. Consequently, the initial interface is set at the orifice of the nozzle. The wetted wall feature under the phase field physics interface was adapted to impose the contact angle between the ink and nozzle. In general, the glass nozzle is hydrophilic. For the inner channel, the receding angle between the glass channel and ink is more important during the process of interface withdrawal. Based on the experimental observation and simulation results, the contact angle between the ink and inner wall of the channel was set as 22.5
 $^{\circ }$. Then considering that the end face of the nozzle is immersed in the carrier oil, it is more reasonable to set the contact angle to about 145
 $^{\circ }$ (according to experimental phenomena and simulation parametric sweep results). At the channel and nozzle walls, the no-slip condition was used under the laminar flow physics interface. The outlet of the model was set as open boundary, across which both inflow and outflow can occur spontaneously.
Appendix C. Mesh independence test
The initial mesh generated by the physics-controlled-mesh method is divided into nine levels: extremely coarse, extra coarse, coarser, coarse, normal, fine, finer, extra fine and extremely fine. The shape of the most-deformed interface and the generated droplet solved by different gird refinement levels were investigated and compared with each other. When the grid refinement level is fine, the result is unsatisfying (the interface evolution is not sufficient, and the boundary layer is too thick). When the refinement levels are finer, extra fine and extremely fine, the interfaces’ behaviours are basically consistent. When the refinement level was finer, the interface was a little thick, because the mesh refinement level is still a little bit coarse. Therefore, we selected extra fine as the mesh refinement level for subsequent calculations.
The mesh area is 0.1632 mm $^2$, and the parameters of the initial mesh grid are as follows: the number of grids is 88 043, the element area ratio is
 $2.12 \times 10^{-7}$ and the area mesh quality is 0.9247. Figure 3(b) shows the initial distribution of the mesh grids near the nozzle orifice. The mesh will be further refined based on the simulation results as the simulation goes on. Figure 3(c) shows the mesh grid distribution near the orifice when the interface approaches the extreme deformation during the extrusion process. The corresponding parameters of the mesh grid are as follows: the number of grids is 165 063; the element area ratio is
 $3.08 \times 10^{-8}$ and the area mesh quality is 0.8974. Figure 3(d) shows the mesh grid distribution near the orifice when the interface approaches the extreme deformation during the withdrawal process. The corresponding parameters of the mesh grid are as follows: the number of grids is 182 042, the element area ratio is
 $3.08 \times 10^{-8}$ and the area mesh quality is 0.9001.
It can be seen that the adaptive mesh strategy doubles the number of grids during the calculation compared with the initial mesh grid. However, only the grids near the nozzle orifice and the boundary are refined, and the grids in the area far from the nozzle exit remain unrefined. This effectively increases the mesh density at the orifice. In addition, we can see from figure 3 that the grids at the interface are not the smallest, and the smallest grids are mainly distributed near the inner boundary of the nozzle and the edge of the nozzle near the orifice, which is believed to resolve the ink flow near the orifice sufficiently. The consistency between the simulation results and the experimental process further proves the rationality of the simulation parameters.