I. INTRODUCTION
M-type hexaferrites (Ba1Fe12O19, abbreviated as BaM), because of their magnetic, chemical, and dielectric properties, have attracted keen interest among researchers for its manifold applications. M-type barium hexaferrites have high coercivity (6700 Oe), Reference Radwan, Rashad and Hessien1 high saturation magnetization (72 emu/g), Reference Gonzalez-Carreno, Morales and Serna2 and high Curie temperature (T C = 502 °C). Reference Cernea, Sandu, Galassi, Radu and Kuncser3 These materials can be used in magnetic hose (to transport magnetic field due to magnetic nature), perpendicular magnetic recording devices, super capacitors, self-biased and millimeter devices, microwave devices (mobile technology), electromagnetic wave absorber, sound devices, and fridge magnets. Reference Bhattacharya, Dhibar, Hatui, Mandal, Das and Das4–Reference Jianxun, Qiguo, Mingyuan and Shen9 For recording media, storage must be in a high number of bits per unit area, known as areal density. It must have a low signal to noise ratio and thermal stability. Nanosized grain with uniform size distribution possesses the properties of recording media. The synthesis of appropriate uniform size particle is a challenging task.
The dual layered structure of BaM contains 2 molecules of BaM having SRS*R* stacks. The hexagonal structure of R and R*, having general formula (BaFe6O11) consists of three oxygen layers, whereas S and S* have a spinel structure with 2 oxygen layers having the formula (Fe6O8). The Asterisk in the stacks signifies their rotation at 180°. A unit cell of hexagonal ferrite contains 38O2−, 2Ba2+ ions, 24Fe3+ ions of which all the Fe3+ ions are situated in trigonal bi-pyramidal site (2b), tetrahedral site (4f1), and octahedral sites (12k, 2a and 4f2). The presence of 24Fe3+ ions shows good magnetic properties, but out of these 5 crystallographic sites, two sites have spin down ions (4f1 and 4f2) causing a reduction in the average magnetic moment of the molecule. Reference Thakur, Singh and Barman10,Reference Pereira, Junior, Santos, Sohn, Freire, Sasaki, de Paiva and Sombra11 The cations like transition metals with magnetic moment can be substituted at a spin down site to change the magnetic properties of BaM.
Several researchers have tried to substitute the cations Reference Khademi, Poorbafrani, Kameli and Salamati12–Reference Soman, Nanoti and Kulkarni31 in hexaferrite. Due to their small ionic radii, rare earth metals and transition metal may replace the barium ions and ferric ions, respectively.
The properties of BaM can be tailored by substituting cations for making it suitable for different applications. Many routes available to synthesize BaM are sol gel method, Reference Ataie and Mali32 microwave induction method, Reference Safronov, Samatov, Medvedev, Beketov and Murzakaev33 micro emulsion method, Reference Liu, Wang, Gan, Ng and Ding34 citrate precursor method, Reference Dimri, Kashyap and Dube35 sputtering, pulsed laser deposition, Reference Li, Huang, Li and Su36 and milling method. Reference Gonzalez-Angeles, Mendoza-Suárez, Grusková, Tóth, Jančárik, Papánová and Escalante-Garcı37 Of these, the optimal technique, the sol gel method offers low temperature, procedural simplicity, uniform crystallite size, and low operational cost.
This study addresses the synthesis process by single phase crystallization reaction mechanism and in detail study of substituted M-type barium hexaferrite Ba1−x La x Co x Fe12−x O19 (x = 0–0.61) (BLCM) synthesized via sol–gel auto combustion method. In the present research work, we have noted the significant enhancement in coercivity of BaM after substitution of La–Co.
II. EXPERIMENTAL PROCEDURE
M-type barium hexaferrites Ba1−x La x Co x Fe12−x O19 (x = 0–0.61) powders are synthesized via modified Pechini sol gel combustion method Reference Qin and Verweij38 using AR grade chemicals, such as La(NO3)3·6H2O (LOBA Chemie., 99% purity), Fe(NO3)3.9H2O (LOBA Chemie., 98% purity), Ba(NO3)2 (LOBA Chemie., 99% purity), Co(NO3)2·6H2O (LOBA Chemie., 99% purity), and citric acid (LOBA Chemie., 99.5% purity). Iron and metal salts are dissolved in distilled water separately in stoichiometric proportions, then making a mixture by adding solutions at ambient temperature with constant magnetic stirring. Afterward, citric acid is added to the salt solution to facilitate the reaction with cations to citric acid molar ratio of 1:1.5. For neutralization of the solution, ammonium hydroxide (NH4OH) solution is added drop wise. The solution is heated at 80–85 °C for 4–6 h with continuous stirring using a magnetic stirrer.
With heat treatment, occurrence of evaporation of water leads to the conversion of liquid into a homogenous brown colored gel. The viscous brown colored gel has been dried over a hot plate at 280–300 °C for 3 h to form the precursor material. Presintering has been done at 500 °C for 2 h at the rate of 23 °C/min to remove impurities. Then the precursor material is calcined at 900 °C at the rate of 23 °C/min for 5 h to form hexaferrites.
III. CHARACTERIZATION TECHNIQUES
Structural properties have been investigated using x-ray diffraction powder patterns obtained from Bruker AXS D8 Advance x-ray diffractometer (Karlsruhe, Germany) in the range 20°–80° using Cu Kα radiation operating at 40 kV and 35 mA having step size of 0.02°. Attached functional groups have been analyzed by Fourier transform infrared spectra [FT-IR interferometer IR prestige-21 FT-IR (model-8400S, Kyoto, Japan)] in the range of 400–4000 cm−1. Thermogravimetric analyzer (TGA) under N2 atmosphere (NETZSCH TG 209F1 Libra TGA209F1D-0105-L, Selb, Germany) with a heating rate of 30 °C/10 min from 0 to 1000 °C is used for thermal analysis. Magnetic properties have been studied with vibrating sample magnetometer (Lakeshore 7410, Westerville, OH) at room temperature. Dielectric analysis has been performed with an LCR meter (Model: 6440B, London, UK) at 20Hz–3 MHz. Surface features have been taken from field emission-scanning electron microscope (FE-SEM) (TESCAN MIRA II, Brno, Czech Republic) at an operating voltage of 5–25 kV. The band gap study has been carried out using UV–Vis–NIR (Model: Varian Carry 5000, Santa Clara, CA at room temperature with 0.2 nm resolution). For better analysis of surface morphology, transmission electron microscope (TEM) instrument, model JEOL JEM-2100 (Peabody, MA), has been utilized. For TEM testing, the sample was dispersed in isopropanol.
IV. RESULTS AND DISCUSSIONS
A. Microstructural properties
BaLCM [Ba1−x
La
x
Co
x
Fe12−x
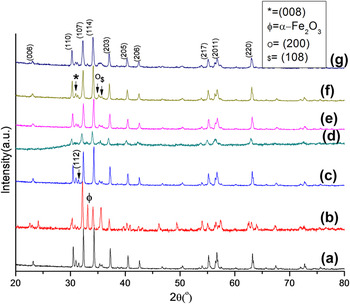
O19 (x = 0–0.61)], heat treated at 900 °C for 5 h, have been investigated by well-known nondestructive x-ray powder diffractometer technique and presented in Fig. 1. Before characterization, material is ground into fine powder. All the synthesized samples show crystalline phase and absence of impurities (except sample having x = 0.11). The presence of apparent peaks having hkl values 110, 008, 112, 107, 114, 200, 108, 203, 205, 217, 2011, and 220 confirms the hexagonal structure of BaLCM powders and are similar to peaks in standard pattern JCPDS# 39-1433 and JCPDS# 84-0757. This proves that the substituted ions have occupied the crystallographic sites. Due to an incomplete reaction between reactants, peaks of α-Fe2O3 (JCPDS #-33-0664, symbolized as
 $\phi$
) that is an impurity phase, appear in the sample having x = 0.11, but it disappears with an increase in substitution because lanthanum and cobalt have good solubility. No undesired phases are present in other samples. This affirms the occurrence of a complete crystallization reaction, formation of a homogeneous mixture of starting compound solutions, and synthesis of pure substituted BaM. Lattice constants (a and c) have been obtained (tabulated in Table I) from x-ray data using equation
Reference Zhao, Wei, Cheng, Tang and Zhang39
:
 $${1 \over {d_{hkl}^2}} = {4 \over 3}\left[ {{{{h^2} + hk + {k^2}} \over {{a^2}}}} \right] + {{{l^2}} \over {{c^2}}}\quad ,$$
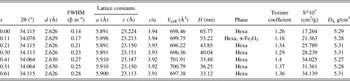
where d hkl is the d spacing value, hkl are the miller indices for peaks in XRD powder patterns. It has been found that at x = 0.41 and 0.51, lattice constant “a” has the highest value (5.910 Å), and “c” is varying with substitution from 23.224 to 23.113 Å. But the ratio of lattice constant c/a is almost constant for all the samples. Lattice constant variation after substitution depends on the electron affinity, oxidation state, and ionic radii. The substitution of cations can expand the lattice. The interaction of the atoms with neighbor atom can also affect the bond length between them and cause variation in lattice expansion. Here, the substitution of transition metal may cause weak interaction with neighbor atoms and hence increase in bond length which causes the expansion of lattice. Volume of the cell has been calculated from Reference Iqbal and Ashiq40 : V cell = 0.8666 a 2 c. It can be seen that the sample, having x = 0.41, has attained the highest volume (701.91 Å3) due to maximum value of lattice constant “a”. X-ray density has been calculated from following expression Reference Iqbal and Ashiq40 :
 $${D_{\rm{x}}} = {{ZM} \over {{N_{\rm{A}}}{V_{{\rm{cell}}}}}}\quad ,$$
where Z is the number of molecules per unit cell, M is the molecular weight, N A is the Avogadro's number (6.023 × 10²³), and V cell is the cell volume. Crystallite size (D) has been estimated from the Scherer formula Reference Ali, Islam, Awan, Ahmad and Iqbal41 :
 $$D = {{k\lambda } \over {\beta {\rm{cos}}\,\theta }}\quad ,$$
where λ is x-ray wave length (1.54056 Å), β is the full width at half maxima (in radian) and θ is the Bragg angle and k is the shape factor having unit value for hexagonal structure. Crystallite size ranges between 65.77 and 33.12 nm (Table I). With an increase in concentration of dopants, the crystallite size decreases except for x = 0.41. This may be due to small ionic radii of La (0.935 Å) and Co (0.625 Å) than Fe (0.63 Å) and Ba (1.11 Å). Reference Thakur, Singh and Barman42 Surface area has been calculated (shown in Table I) from the expression Reference Thakur, Singh and Barman10 :
X-ray diffraction powder pattern for (a) BaM, BaLCM at (b) x = 0.11, (c) x = 0.21, (d) x = 0.30, (e) x = 0.41, (f) x = 0.51, and (g) x = 0.61.

Diffraction angle (2θ), d spacing (d), full width at half maxima (β), lattice constants (a and c), volume of cell (V cell), x-ray density (D X), bulk density (D b), crystallite size (D), phase present and surface area (S) with substitution for BaLCM.

 $S = {{6000} \over {D{D_{\rm{x}}}}}$
, where D is the crystallite size and D
x is the x-ray density. The specific surface area increases from 17.264 × 10⁷ to 34.139 × 107 cm2/g. Crystallite size is the dominant factor for variation in surface area. As the crystallite size decreases, the more number of atoms appear at the surface.
In crystal coordinate system, crystal can orient in many directions as according to structure but particle in the volume preferred one particular direction. Quantification of data has been done with texture coefficient. Preferential orientation of crystal growth can be calculated by using intensities of the peaks from the following formula Reference Ilican, Caglar and Caglar43 :
 $${T_{\rm{C}}} = {{{{{I_{(hkl)}}} \mathord{\left/ {\vphantom {{{I_{(hkl)}}} {{I_{{\rm{o}}(hkl)}}}}} \right. \kern-\nulldelimiterspace} {{I_{{\rm{o}}(hkl)}}}}} \over {\left( {{1 \mathord{\left/ {\vphantom {1 N}} \right. \kern-\nulldelimiterspace} N}} \right)\left[ {\sum\limits_N {{{{I_{(hkl)}}} \mathord{\left/ {\vphantom {{{I_{(hkl)}}} {{I_{{\rm{o}}(hkl)}}}}} \right. \kern-\nulldelimiterspace} {{I_{{\rm{o}}(hkl)}}}}} } \right]}}\quad ,$$
where I o(hkl) is the standard intensity of the corresponding peak in standard data (JCPDS), T C is the texture coefficient, N is the number of reflections, and I (hkl) is the observed intensity in obtaining data (Table I). The intensity of peaks having hkl value (101), (102), (006), (110), (008), (112), (107), (114), (203), (217), (304), (2011), and (220) is used for texture coefficient calculation. Calculated texture coefficient indicates that the sample having x = 0.41 shows highest value i.e., 1.4. This means that with the substitution, samples orient themselves in a particular direction and causes enhancement in structural properties and leads to more single phase presence. Reference Thakur, Singh and Barman42
B. Fourier transform infrared spectroscopy
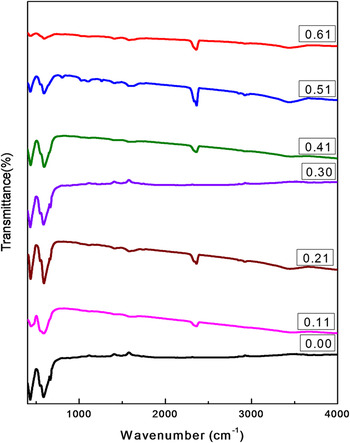
From FT-IR spectra analysis (Fig. 2), the information regarding attached molecular bands or presence of functional groups, which are remains of chemicals used in the synthesis process, can be obtained. Two prominent peaks arise near 430 and 580 cm−1 indicate the formation of hexaferrite. The stretching vibrations of metal–oxygen bond are the reason for these peaks. The bands near 420–480 cm−1 and 550–590 cm−1 attribute to the vibration of the ferric crystallographic site (octahedral and tetrahedral). Reference Song, Shen, Xiang and Song44 The spectra for x = 0. 21, 0.3, and 0.41 show the less transmittance area with relatively more prominent peaks. This shows that the cations have been substituted at the ferric sites accompanying strong interaction than other samples. Due to the presence of CO2, a peak at 2400 cm−1 appears in FT-IR spectra. There is no CO2 peak in sample x = 0 and sample x = 0.30. This may be due to complete combustion of starting materials. No nitrate ions appear in the sample (near 1300 cm−1). No band near 2900 cm−1 occurs, indicating the absence of moisture absorbed by the sample. Reference Tehrani, Daadmehr, Rezakhani, Akbarnejad and Gholipour45–Reference Tang, Zhao and Hu47
Mid infrared region spectra for BaLCM at x = 0, x = 0.11, x = 0.21, x = 0.3, x = 0.41, x = 0.51, and x = 0.61.

C. Thermal analysis
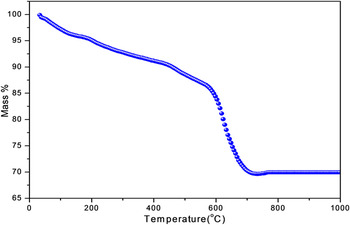
Thermal gravimetric analysis has been performed to investigate the effect of heat on mass of the sample and the formation temperature of hexaferrite. The resultant TGA curve of M-type hexaferrite Ba1−x La x Co x Fe12−x O19 (x = 0.30) (BaLCM) powder has been shown in Fig. 3. The reduction of weight between 0 and 600 °C is due to decomposition of remaining organic matter. An oxidation reduction reaction between the metal nitrates and citric acid is the reason for decomposition. The weight loss in this range indicates the occurrence of evolution of gases like NO2, CO2 resulting in bondage of citric and nitrate ions and evaporation of water molecules. Between 600 and 700 °C, there is a weight loss due to decomposition of precursor, crystallization, and conversion from hematite to hexaferrite structure. Reference Tang, Zhao and Hu47,Reference Poorbafrani, Kameli and Salamati48 After 700 °C, weight loss becomes approximately constant which indicates the formation of BaLCM. The reaction interval for the BaLCM is Tf − Ti = 100 °C.
Thermogravimetric diagram for Ba0.7La0.3Fe11.7Co0.3O19 precursor.

D. Morphology
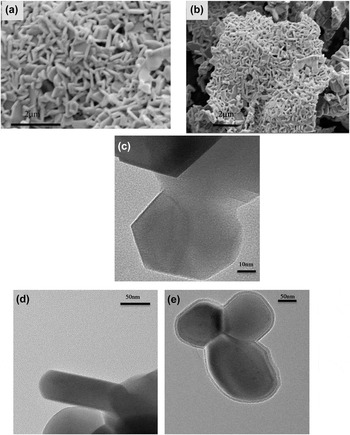
The FE-SEM and TEM micrographs are showing surface morphology of BaLCM (in Fig. 4) at room temperature with La and Co substitution calcined at 900 °C. For FE-SEM scale is 2 µm with magnification 20,000x–40,000x and for TEM scale is 10 and 50 nm with magnification 120,000x and 80,000x, respectively. It is observed from the FE-SEM micrographs [Figs. 4(a) and 4(b)] that the particles have uneven distribution and showing hexagonal shape. The presence of clusters in some parts can be seen. TEM micrographs [Figs. 4(c)–4(e)] are exhibiting the crystallite size in nano range which is supported by XRD data. A hexagonal structure of hexaferrite can be visualized from TEM images. Grain boundaries are looking merged with each other so less distinction of edges can be seen. This may attribute to the large interaction of ions between each other. Flawless hexagonal structure can be visualized in TEM micrographs and estimated crystallite size seems to be in range 40–100 nm.
FE-SEM micrographs for (a) BaLCM and (b) x = 0.30, and TEM micrographs for (c) BaLCM and (d) x = 0.11, (e) x = 0.21.

E. Dielectric study
The capacitance has been recorded using an LCR meter in a range 20 Hz to 3 MHz using a pellet (with 8 tonne pressure) of BaLCM sintered ceramics coated with silver metal powder. Dielectric constant has been calculated from parallel plate capacitor equation Reference Singh, Narang, Singh, Pandey and Kotnala49 :
 $$K = {{Cd} \over {{\varepsilon _0}A}}\quad ,$$
where K is the dielectric constant, C is the capacitance of the palette, d is the thickness of sample palette and A is cross section area and ε0 is the permittivity of free space (8.85 × 10⁻¹² F/m).
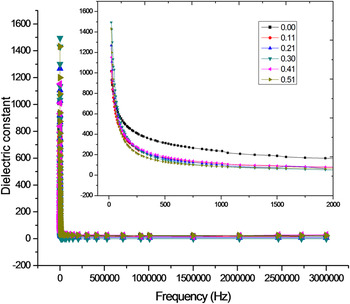
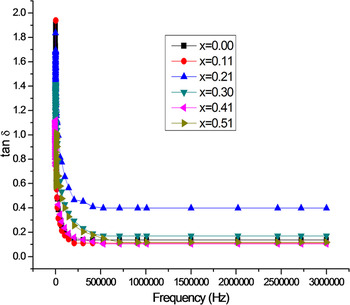
A normal behavior of ferrite has been shown by BaLCM (Fig. 5) toward frequency that is dielectric constant is high for low frequency but decreases at high frequency. Koop's phenomenological theory and Maxwell Wagner theory can be used to explain such nature of BaLCM. According to their theory, there may be an electron exchange between Fe3+ and Fe2+ which results in the displacement of the ionic charges and also responsible for polarization. At low frequencies, the effective contribution may also come from the presence of grain boundaries. The structure of the material is supposed to be made of conducting grains separated by less conducting grain boundaries. Reference Ali, Islam, Awan and Ahmad50 They may be created during heat treatment. The hopping between Fe2+ and Fe3+ causes dispersion at low frequency. The electrons have been displaced by applied field and causes polarization, but when half of alternating field becomes more than hopping time, the displacement does not happen. So the dielectric constant will decrease at high frequency. Reference Narang and Hudiara51 It is observed that substituents have affected the values of dielectric constant. With the increase in substitution, dielectric constant slightly decreases. The replacement of ferric ions by cobalt is responsible for the reduction of ferrous ions that causes polarization. Because of low eddy currents and high dielectric constant prepared material can play a significant role in the electronics market as an application point of view in as radiation absorber or high frequency component. Dielectric loss (Fig. 6) can be calculated by using expression Reference Ali, Islam, Awan and Ahmad52 :
 $$\varepsilon \Prime \, = \,\varepsilon \prime {\rm{tan}}\,\delta \quad ,$$
where ε′ is the dielectric constant and ε″ is a dielectric loss factor. Dielectric losses are also high at low frequency.
Variation of dielectric constant with frequency for BaLCM, inset showing the magnified area of graph having a prominent effect.

Plot of tangent loss with frequency for BaLCM.

As described earlier in this section, hopping is the reason for high dielectric constant, similarly loss tangent behavior can be explained on this basis. Dielectric loss tan δ decreases with increase in frequency. Maximum of loss tangent may be observed when the hopping is nearly equal to that of the externally applied electric field. After the maxima, hopping time becomes more than the applied signal so cause a decrease in loss tangent.
F. UV–VIS spectroscopy
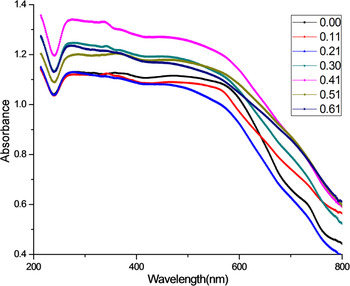
The band gap study is required for making the design of optical devices. The optical properties of BaLCM in the optical region (200–800 nm) have been studied by using UV–Vis–NIR absorption spectra. To plot a graph, the absorption coefficient has to calculate as a function of photon energy Reference Karmakar, Mondal, Pal and Mukherjee53 :
 $$\alpha = {{A{{\left( {h\nu - {E_{\rm{g}}}} \right)}^n}} \over {h\nu }}\quad ,$$
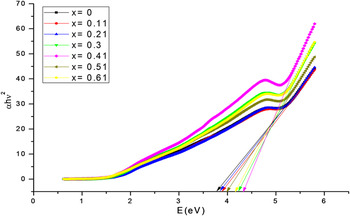
where α is the absorption coefficient, A is a characteristic parameter of transition which depends on the value of n that can have values 1/2, 2, 3/2, and 3 for allowed direct, allowed indirect, forbidden direct, and forbidden indirect transitions, respectively, E g denote the optical band gap energy, h is the Planck constant and ν is the incident photons frequency. Figures 7 and 8 show the plots for UV absorption spectra for prepared samples. The plotted graphs are showing direct allowed band gap. So the value of n will be 1/2. The value of direct band gap energy can be determined from extrapolation of a liner portion of the plots.
Graph for optical band gap for BaLCM (x = 0–0.61) at 900 °C.

Absorption spectra for BaLCM (x = 0–0.61) at 900 °C.

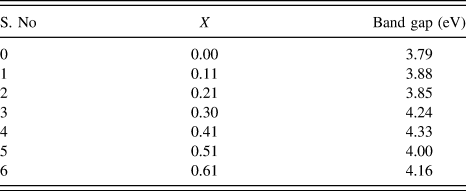
The band gap of pure barium hexaferrite has been obtained 3.79 eV (Table II). It is observed that the band gap energy increases with increase in substitution concentration from x = 0 to x = 0.41 and shows maximum value 4.33 eV at x = 0.41 and after x = 0.41, band gap energy decreases. BaM shows low value of band gap than BaLCM. Due to its band gap values, prepared material can be used in photo catalytic process. The band gap of BaLCM is higher than barium hexaferrite (3.18 eV) and barium hexaferrite thin films (2.32 eV) as reported by Karmakar et al. and Safia Anjum et al. Reference Karmakar, Mondal, Pal and Mukherjee53–Reference Rawat and Yadav55 The increase in band gap may be due to the occurrence of more quantum confinement. From UV–NIR absorption spectra (Fig. 8), it has been concluded that the absorption region for hexaferrites is ∼200–600 nm.
Band gap values with substitution for BaLCM.

G. Magnetic properties
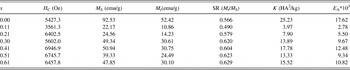
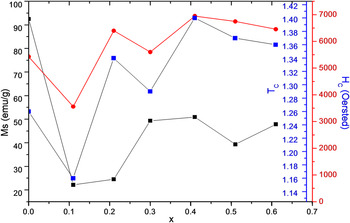
The magnetic properties evaluated from hysteresis curve have been summarized in Table III. The effect of substitution of La3+ and Co2+ has been seen on retentivity, saturation magnetization texture coefficient and coercivity (Fig. 9). Saturation magnetization (M S) value for pure barium hexaferrite is 92.53 emu/g. M S value for BaM is more than substituted samples.
Summary of Coercivity (H C), saturation Magnetization (M S), Retentivity (M r), Squareness ratio (SR) and Anisotropy constant (K) with substitution for BaLCM.

Variation of saturation magnetization, texture coefficient, and coercivity with substitution for BaLCM.

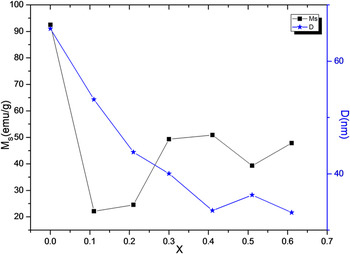
The lowest value for M S is 22.17 emu/g for x = 0.11. It may because of the impurities present in samples as discussed in XRD analysis. The magnetic properties of hexaferrite is strongly depends on the routes of synthesis, site occupation, ionic radii, substituted cations, and density. M S depends on the magnetic moment of a particle. The substituted samples show less M S value than that of BaM. In pure hexaferrite (BaM), the increase in M S may attribute to the site occupying by the Fe ions with spin up rather than spin down. With increasing substitution (x = 0.11, 0.21, 0.30, 0.41), M S increases from 22.17 to 50.94 emu/g. It may attribute to the increase in density (Fe = 7.874 g/cm3, Co = 8.90 g/cm3, Ba = 3.51 g/cm3, La = 6.162 g/cm3) with the substitution. Increase in density leads to increase in magnetic dipoles per unit volume. There is also a decrease in the crystallite size of BaLCM which increases the number of magnetic domains (Fig. 10) in BaLCM powder samples. Ionic radii also affect the M S values. With decrease in ionic radii (Fe = 0.63 Å, Ba = 1.11 Å, Co = 0.625 Å, and La = 0.935 Å), the distance between magnetic particles decreases and hence enhances the superexchange interaction which results increase in M S. But for sample having x = 0.51 and 0.61 saturation magnetization decreases, this may attributed to the disturbance of ferromagnetic order and environment distortion induced by more substitution of rare earth ion. Further, the substitution rare earth element results in setup of a cationic vacancies that originate spin canting effect causes reduction in M S and responsible for a rise of nonlinear plot.
Effect of substitution on saturation magnetization M S and crystallite size (D) for BaLCM.

Coercivity values have been surprisingly increased with substitution. The possible reason for this may be the texture coefficient and anisotropy constant.
 $${H_{\rm{C}}} = {{2{\mu _0}K} \over {{M_{\rm{S}}}}}\quad ,$$
where µ0 is the universal constant of permeability in free space and is equal to 4π × 10−7 H/m and K is the anisotropy constant. Coercivity also realized over the energy barrier because of its direct dependency. For spin reversal of particles, an energy is required that is called energy barrier and can be expressed as E A = KV sin2θ. Among substituted samples, x = 0.41 has highest energy barrier and hence highest coercivity. Coercivity also depends on structural properties, defects, and crystallite size. Coercivity shows a similar trend in variation as texture coefficient (Fig. 9). This may happen because of the preference of particles to orient in one direction and that causes more interaction between them and more magnetism in one direction. Reference Thakur, Singh and Barman42 The obtained coercivity value is highest (6946.9 Oe) for La–Co substituted hexaferrite than reported by Nourbakhsh et al. (H C = 4710 Oe), Reference Nourbakhsh, Vahedi, Nemati, Noorbakhsh, Mirsatari, Shaygan and Mackenzie56 Masoudpanah et al. (H C = 4100 Oe), Reference Masoudpanah, Seyyed Ebrahimi and Ong57 Nishio et al. (H C = 300 kA/m or 3750 Oe, H C = 441 kA/m or 5512 Oe), Reference Nishio, Minachi and Yamamoto58,Reference Nishio and Yamamoto59 Olive et al. (H C = 6700 Oe), Reference Oliva, Bercoff and Bertorello60 F. Kools et al., Reference Kools, Morel, Grossinger, Le Breton and Tenaud61 Lechevallier et al. Reference Lechevallier, Le Breton, Teillet, Morel, Kools and Tenaud62 Such high coercivity material can be utilized in recording media.
V. CONCLUSION
The formation of hexagonal structure takes place and the morphology of the surface of the as-prepared samples is nonhomogenous but TEM analysis confirms the hexagonal shape and nano size of the crystallites. It has been observed that the hexaferrite phase forms at a temperature of 680 °C. Samples show normal ferrite dielectric behavior. UV–Vis–NIR reveals that the band gap of as-prepared samples increases with substitution. From analysis, it is observed that coercivity, volume, band gap, surface area, saturation magnetization show maximum values at x = 0.41. Such material can advantageously utilize in the formation of the thermally stable, perpendicular magnetic recording media having ultrahigh areal recording densities in several Gbit/in2.
ACKNOWLEDGMENTS
We are thankful to STIC-Kochi (Ernakulum) for XRD and UV–Vis–NIR, IIT Madras for VSM. We are highly thankful to Lovely Professional University for providing financial support (No. LPU/DRD/IPF/Sac/004) for this research work.