INTRODUCTION
Selenium (Se) is an essential micronutrient for humans, being derived primarily from dietary sources (Fairweather-Tait et al., Reference Fairweather-Tait, Broadley, Collings, Ford, Hesketh and Hurst2011). However, Se deficiency reaches about 1 billion people worldwide (Combs, Reference Combs2001). Contributing to this scenario, it was recently found in a global survey that Se contents in staple food, namely in rice, was too low to meet the nutritional requirement of populations (Williams et al., Reference Williams, Lombi, Sun, Scheckel, Zhu, Feng, Zhu, Carey, Adomako, Lawgali, Deacon and Meharg2009). Se deficiency resulting from suboptimal dietary might lead to adverse health outcomes, as cardiovascular disorders, impaired immune function and some types of cancer. Nevertheless, suboptimal Se intake by the human population can be ameliorated through agronomic biofortification of staple food.
As a staple food, rice is an excellent source of energy, prevailing its consumption in over 30 countries and providing about 80% of daily caloric intake to ca. 3 billion individuals (Lucca et al., Reference Lucca, Poletti and Sautter2006). Rice also represents about 21%, 14% and 2% of global energy, protein and fat meal, respectively (Kennedy and Burligame, Reference Kennedy and Burlingame2003). The daily Se intake recommended for humans is about 55 µg day−1, while some reports also point as much as 300 µg day−1 to reduce the risk of cancer (Navarro-Alarcon and Cabrera-Vique, 2008). To overcome Se deficiency, the breeding approach (i.e., genetic biofortification) for biofortifying rice crops is largely dependent on the available Se pool in soils (ranging widely between 0.5 and 47.7 mg kg−1, Sun et al., Reference Sun, Liu, Williams and Zhu2010). Hence, the genetic capacity of the newly developed (biofortified) cultivars to absorb sufficient amount of Se from soil and accumulate it in grains may not be expressed to the full extent. To ensure the success of genetic biofortification programs with Se, agronomic biofortification must additionally be applied, using foliar fertilizers and testing different chemical forms of Se (i.e., sodium selenite and sodium selenate). In fact, the efficiency of biofortification programs can improve only by considering genotype specificity and directing the breeding to high Se cultivars.
Selenite and selenate (both water-soluble) are the main chemical forms absorbed by plants and foliar fertilization is one of the most effective and safest approaches, as applied agrochemicals might enter in leaves through the cuticle or via stomata (Fang et al., Reference Fang, Zhang, Catron, Chan, Hu and Caruso2009). Foliar fertilization with Se has been successfully applied in rice, wheat and lettuce (Chen et al., Reference Chen, Yang, Xu, Yun, Hu, Zhang and Pan2002; Ramos et al., Reference Ramos, Faquin, Guilherme, Castro, Avila, Carvalho, Bastos and Oliveira2010) and it has suppressed nutritional deficiencies in human populations (Nestel et al., Reference Nestel, Bouis, Meenakshi and Pfeiffer2006; Meenakshi et al., Reference Meenakshi, Johnson, Manyong, DeGroote and Javelosa2010). Nevertheless, the threshold of toxicity, the negative effects on the contents of other minerals in plants or the chemical Se forms used as foliar fertilizers must be considered to avoid decreases in crop yield (Longchamp et al., Reference Longchamp, Angeli and Castrec-Rouelle2013; Poblaciones et al., Reference Poblaciones, Rodrigo, Santamaría, Chen and McGrath2014). In rice, different factors, such as genotypes, edaphoclimatic conditions and the technological design of fertilization can differentially affect the efficiency of selenite and selenate for biofortification. In this context, Wang et al. (Reference Wang, Wang and Wong2013) showed that rice spraying with sodium selenite (10.5 g Se ha−1) increased grain Se contents up to 51-fold (from 0.03 µg g−1 to 1.54 to µg g−1). Zayed et al. (Reference Zayed, Lytle and Terry1998) and Li et al. (Reference Li, McGrath and Zhao2008) also reported that the accumulation of Se in rice and wheat through foliar application with selenite also was higher than with selenate. Moreover, Chen et al. (Reference Chen, Yang, Xu, Yun, Hu, Zhang and Pan2002) pointed that Se concentration in rice increases after foliar fertilization with sodium selenite, with such increase being 36% higher when using sodium selenate. Hu et al. (Reference Hu, Chen, Xu, Zhang and Pan2002) also reported a 10-fold increase on Se contents of rice grains after a single foliar spraying (14–18 g Se ha−1) at the heading stage with sodium selenate.
Considering that the main hypothesis of this work was centered in the foliar application of Se to attain the agronomic biofortification of rice crops (using selenite and selenite as foliar fertilizer), the aims of this study was to assess the potential of increasing Se concentrations during grain filling of four rice genotypes, further considering the implications of nutrient accumulation and deposition in grains for industrial processing.
MATERIALS AND METHODS
Experimental design
Field trails were carried out in Salvaterra de Magos, Ribatejo, Portugal (39.03°N; 8.74°W) for two consecutive years (2013 and 2014). Soil composition had 0.85% to 1.36% of organic matter, coarse texture, acid pH and 61, 25 and 56 mg kg−1 of P2O5, K2O and Mg, respectively. Considering these parameters, the basal fertilization was performed with NPK 20-8-10 (300 kg ha−1) and sulfamide (37% N, 150 kg ha−1). The conductivity of the irrigation water was 0.327–0.623 dS m−1, whereas the pH kept between 6.53 and 6.55 and contents (in mg L−1) of HCO3, Na, K, Ca and Mg were 73.2–136.4, 65.7–125.4, 3.82–4.42, 16.7–43.1 and 6.40–18.12, respectively.
Four rice (Oryza sativa L.) genotypes Ariete, Albatros, OP1105 and OP1109 were sown in the paddy/wetland fields, being crop cycle completed after about four months (Supplementary Figure. S1 (available online at https://doi.org/10.1017/S0014479718000157)). Field trails were flooded 15 days after plant emergence, being the water kept (20 cm above soil level) until the physiological maturity. Biofortification was carried out by foliar application with solutions of sodium selenite (Na2O3Se, 45% Se) and sodium selenate (Na2O4Se, 41% Se). In the first year of the experimental design, randomized blocks and a factorial arrangement (5 concentrations × 2 forms Se × 4 varieties × 4 replicates = 160 plots) with a surface area of about 3 m2 (2.5 m × 1.2 m) were used. Foliar application with selenite and selenate was performed three times (at the booting, at the development of the panicle and during grain filling), with 0, 4, 20, 30 and 60 g Se ha−1. In the second year, the experimental design was similar to that adopted in the first-year testing, with four concentrations. To further increase grain Se levels without reaching the threshold of toxicity, foliar biofortification considered the application of 0, 120, 180 and 300 g Se ha−1, also using selenite and selenate solutions. Each plot had about 4 m2 (2.68 m × 1.5 m).
Determination of yields and Se concentration
For each genotype and treatment, 1000 grains were picked randomly and weighed in triplicate. The plots were harvested manually and grains were dried to 13% moisture and then peeled and weighed. The concentration of Se was determined in powdered grains harvested from controls and after foliar fertilization with selenite and selenate at 30, 60, 120, 180 and 300 g Se ha−1. Grains were subjected to cyclical analysis through neutron activation (Galinha et al., Reference Galinha, Freitas, Pacheco, Coutinho, Maçãs and Almeida2013), being the samples irradiated with a neutron flux of 1.7 × 1012 cm2 s−1, in a fast-pneumatic system. Grain X-ray analysis was done using a Niton Thermal Scientific XLT, as described by Pataco et al. (Reference Pataco, Lidon, Ramos, Oliveira, Guerra, Pessoa, Carvalho, Ramalho, Leitão, Santos, Campos, Silva, Pais and Reboredo2017).
Localization of minerals in grain tissues
The localization of minerals in rice grain, grains harvested from controls and after foliar fertilization with selenite and selenate at 300 g Se ha−1 was determined using the µ-EDXRF system (M4 Tornado™, Bruker, Germany). The X-ray generator was operated at 50 kV and 100 µA without the use of filters, to enhance the ionization of low-Z elements. To a better quantification of heavy elements, a set of filters between the X-ray tube and the sample was used, composed of three foils of Al/Ti/Cu with a thickness of 100/50/25 µm, respectively. All measurements with filters were performed with 600 µA current. Detection of fluorescence radiation was performed by an energy-dispersive silicon drift detector, XFlash™, with 30-mm2 sensitive area and energy resolution of 142 eV for Mn Kα. To better measure the distribution mapping of the elements, rice grain was cut in half with a stainless steel surgical blade. Measurements were taken under 20 mbar vacuum conditions and performed directly on the two sides of grains, first in the mapping mode, and then with point analysis on interest sites. These point spectra were acquired during 200 s.
The relative proportions of minerals in the embryo, equatorial zone and apical region of grains (Fig. S2) were assessed and evaluated in grains harvested from controls and after foliar fertilization with selenite and selenate at 60 and 300 g Se ha−1. Such analyses were done through scanning electron microscopy images, using a JEOL JSMT330A model coupled with an Energy Dispersive X-Ray Spectroscopy (EDS) and a Tracor Northern Series II microanalyzer. The grains were cut transversely and longitudinally, being previously dehydrated and dried in CO2 using a Balzers Union CPD 020 system. Thereafter, grains were adhered to 13 mm aluminium stubs with conductive carbon adhesive pads and sputter-coated with a 60/40 Au/Pd alloy, to an approximate thickness of 10–15 nm, using a Polaron Equipment coating unit. Sputter-coated were examined, imaged and analyzed at 20 Kv, using an static electron beam that interact with the sample producing a variety of emissions, including characteristic X-rays of different elements. The abundance of specific elements was determined in 200 s and after 5000 readings, with the EDS system software.
Statistical analysis
Data were statistically analyzed using a two-way ANOVA (P ≤ 0.05) to assess differences between treatments and experimental periods. Based on the results, the Tukey test was performed for mean comparison, considering a 95% confidence level.
RESULTS
Grain weight
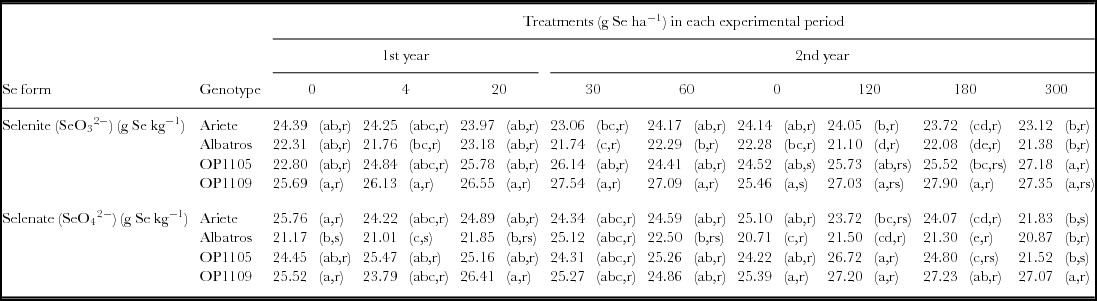
After foliar fertilization up to 20 g Se ha−1, the lowest significant weight of 1000 grains occurred in Albatros with selenate fertilization, but thereafter and until 60 g ha−1 the lowermost value was found after selenite application (Table 1). Moreover, the highest values of weight of 1000 grains were detected in OP1109 in the control plants and in those ones supplied with selenite until 60 g Se ha−1. Comparing the weight of 1000 grains among genotypes, Albatros showed the lowest values in the control and also under 4 g Se ha−1, as selenate. Albatros also showed the lowest weight of 1000 grains after fertilization with selenite (120 and 300 g Se ha−1) and selenate (180 g Se ha−1), whereas the highest values were found in OP1109 with application of selenate (120 g Se ha−1) or selenite (180 to 300 g Se ha−1).
Mean of 1000-grain weight of rice (n = 3) submitted to foliar application of selenite or selenate.

For the same year, different letters in columns and lines indicate significant differences between genotypes within the same treatment (a–c), and between treatments for the same genotype (r and s), respectively (P < 0.05).
Selenium in rice grains
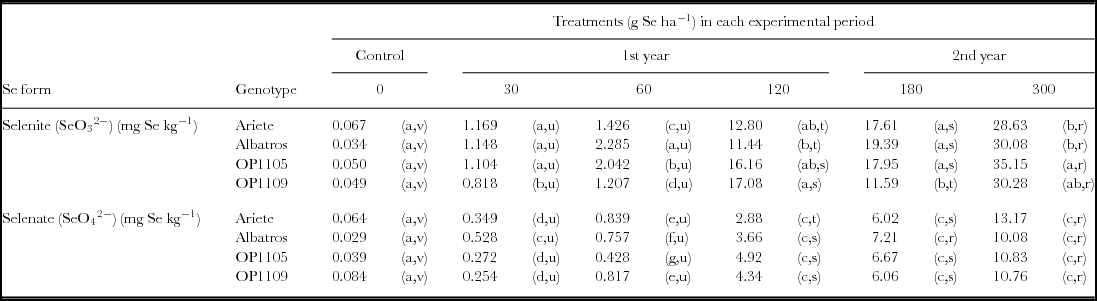
A progressive increase of Se was found in the biofortified grains of all genotypes when using selenite and selenate up to 300 g Se ha−1, with exception of OP1109 supplied with selenite (Table 2). Considering the first experimental year, significant increases in grain Se content were found from the control onwards. In the second year, between 120 g Se ha−1 and the highest treatment, Se contents also increased significantly among the genotypes. Considering both experimental years and compared to control plants, fertilization with selenite triggered 427-, 884-, 703- and 617-fold increases of Se contents in grains of Ariete, Albatros, OP1105 and OP1109, respectively. Moreover, fertilization with selenate caused 205-, 347-, 277- and 128-fold increases of Se contents in grains of Ariete, Albatros, OP1105 and OP1109, respectively (Table 2). In general, Albatros and OP1105 showed the highest accumulation of Se in grains, regardless the fertilizer form.
Concentrations of Se in rice grains (n = 3).

For the same year, different letters in columns and lines indicate significant differences between genotypes within the same treatment (a–g), and between treatments for the same genotype (r–v), respectively (P < 0.05).
Selenium accumulation in rice crops
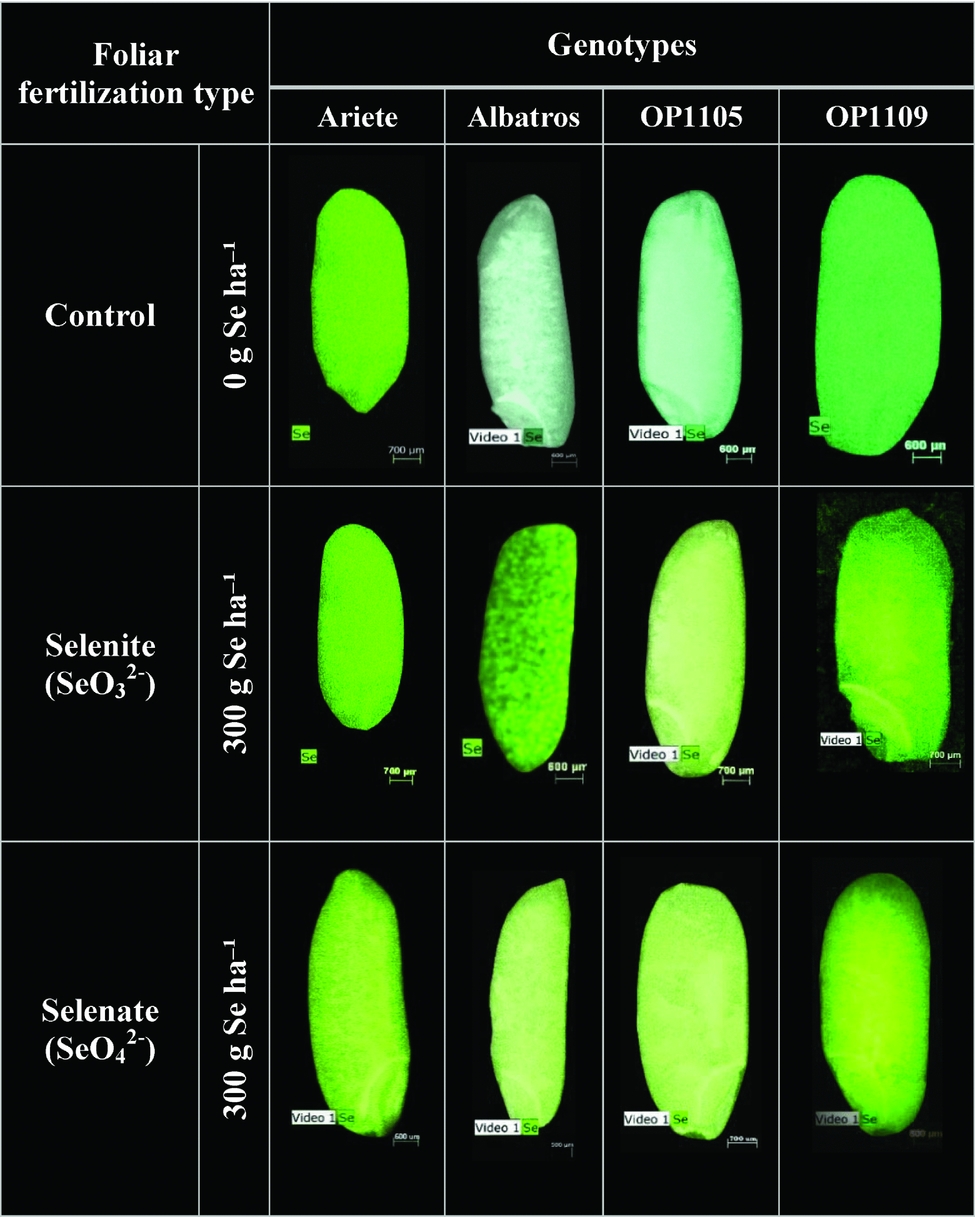
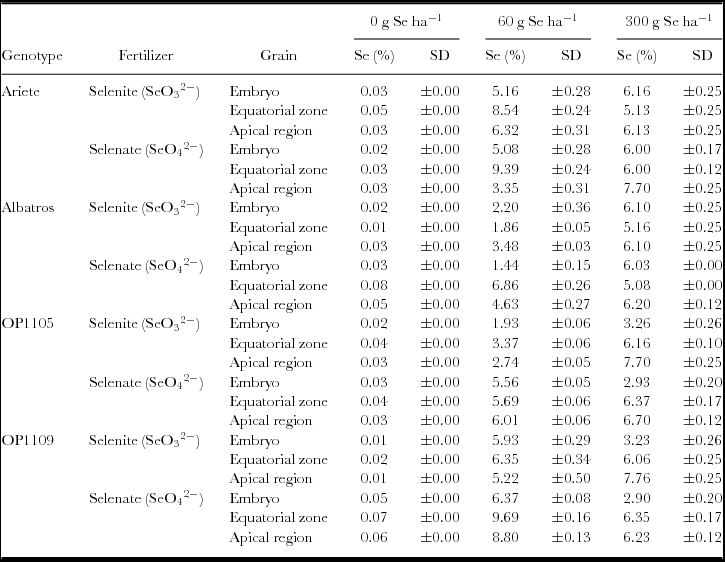
Among rice genotypes and regardless fertilizer form, Se was found in all grain tissues (Figure 1). Fertilization with selenite or selenate at 60 g Se ha−1 triggered higher Se contents in the equatorial grain region of all genotypes (Table 3), with the exception of Albatros and OP1105 fertilized with selenite and selenate, respectively. For both fertilizer forms, the highest Se depositions were found in the equatorial grain zone in Ariete (about 8.5–9.4%). In OP1109 fertilized with selenite, Se accumulation in the equatorial grain region also reached high values (9.7%). Against these trends, Albatros showed the lowest accumulation in the equatorial grain zone (1.9%). Foliar application of selenite induced lower Se accumulation in the embryo of Ariete and OP1105, with this latter showing the lowest values (1.9%). This trend further prevailed with the application of selenate, with Albatros showing the lowest values (1.4%). After application of selenite at 300 g Se ha−1 (Table 3), the relative proportions of Se decreased in all tissues of OP1109, in the embryo of OP1105 and in the equatorial grain zone of Albatros and Ariete. When selenite was sprayed, the relative proportions of Se decreased in the equatorial zone and apical region of Ariete grains and decreases were also found in the embryo and equatorial grain zone of OP1109.
Localization of Se in rice grains of control samples and with foliar applications of sodium selenite and sodium selenate at 300 g Se ha− 1. Analysis performed by X-ray fluorescence.

Selenium accumulation in rice grains (embryo, equatorial zone and apical region) of four genotypes supplied with selenite and selenate (control, 60 and 300 g Se ha−1).

Each value is the relative proportion of Se, considering the concentrations of all nutrients (being the sum 100%).
Macro and microelements accumulation in rice grains
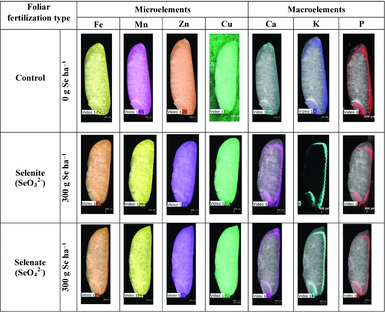
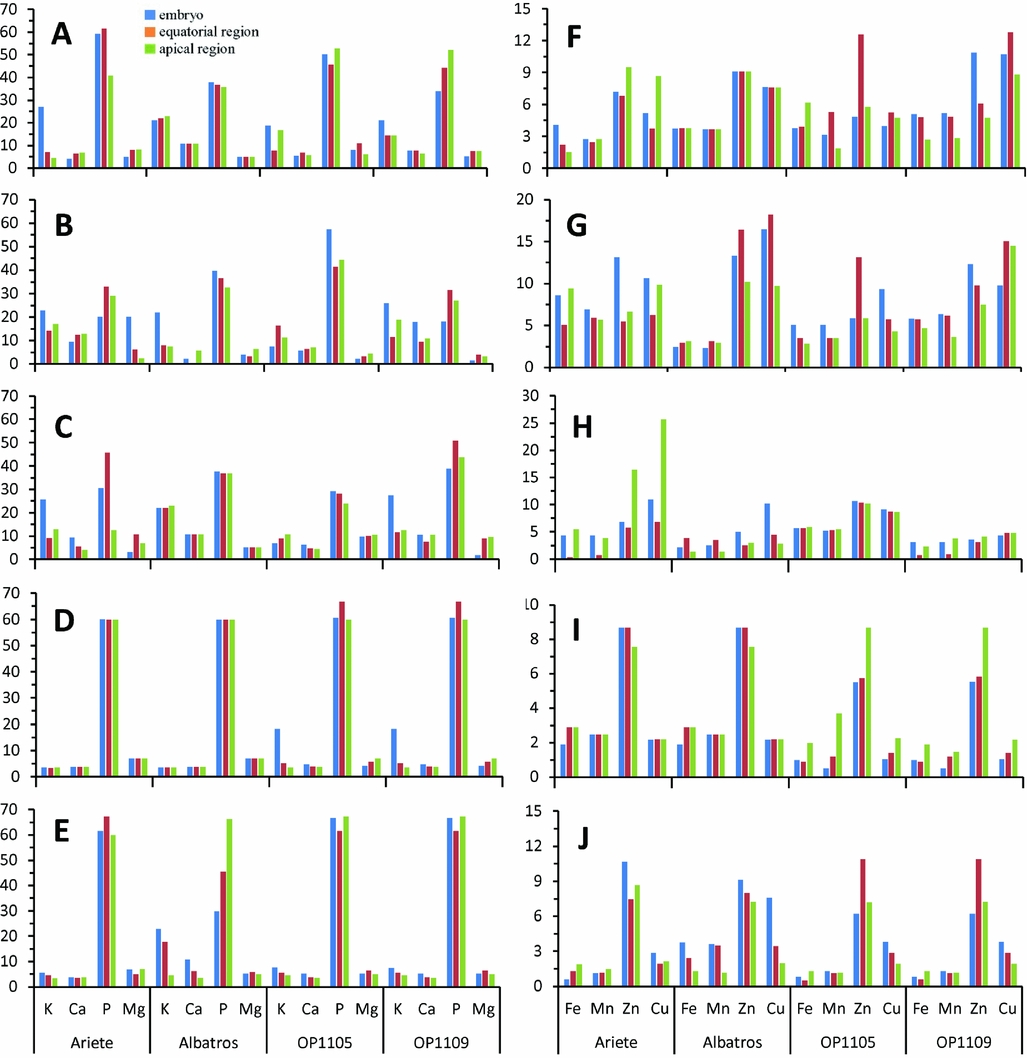
Among genotypes, the analysis performed with X-ray fluorescence showed large deposits of Ca, K and P in the rice bran and external grain layers, whereas Fe, Mn, Zn and Cu revealed a dispersive accumulation in all tissues (Figures 2 and 3). In control plants and also in those ones supplied with 60 and 300 g Se ha−1, K, Ca, P, Mg, Fe, Mn, Zn and Cu contents showed large variation in genotypes fertilized with selenite and selenate (Figures 2 and 3). In the control and after fertilization with 60 g Se ha−1, the relative proportion of P kept the highest values among all macronutrients, prevailing in OP1105 and OP1109 fertilized with selenite and selenite, respectively (Figure 3B and C). Applying selenate, rice treated with 60 g Se ha−1 showed the highest proportions of Ca in all grain tissues of Albatros and OP1109, whereas fertilization with selenite triggered higher levels in grain tissues of Ariete and OP1109. In the control and in plants treated with 60 g Se ha−1, the relative proportions of K prevailed in the embryo, excepting for OP1105. Biofortification with 60 g Se ha−1 using selenite caused the highest values of Mg in the embryo of Ariete. Using selenate at 60 g Se ha−1, Mg became well distributed in all tissues of OP1105. In the control and 60 g Se ha−1, both fertilizer forms triggered the highest relative proportions of Zn and Cu among micronutrients. In general, Fe and Mn became uniformly distributed among tissues in all genotypes. After fertilization with 300 g Se ha−1, the relative proportions of P prevailed among the grain tissues, excepting in Albatros that showed the lowest P content in the embryo when supplied with selenate. The other macronutrients consistently showed much lower values among the grain tissues, although K was higher in the embryo of OP1105 and OP1109 supplied with selenite and of Albatros supplied with selenate. Among micronutrients, the relative proportions of Zn prevailed among the grain tissues in all genotypes. After application of selenite (300 g Se ha−1), the proportions of Fe, Mn and Cu prevailed and became uniformly distributed in all grain tissues of Ariete and Albatros. With selenate fertilization, Albatros also had the highest proportions of Fe, Mn and Cu in grain tissues.
Analysis performed with X-ray fluorescence for localization of the mineral elements in grains from Albatros (control and from foliar fertilization with selenite and selenate at 300 g Se ha−1). The localization in Ariete, OP1105 and OP1109 grains showed similar patterns.

Relative proportions of macro (A–E) and micronutrients (F–J) in rice grains: control (A,F); biofortification with 60 g Se ha−1 through foliar fertilization with selenite (B,G) and selenite (C,H); biofortification with 300 g Se ha−1 through foliar fertilization with selenite (D,I) and selenite (E,J). In all cases, the standard errors were equal or lower than 8%.

DISCUSSION
Our study showed that the effects of Se supplying on rice yields are associated with the applied rates and form (i.e., optimised addition of selenite) and also with genotype characteristics, as found by Wang et al. (Reference Wang, Wang and Wong2013). Higher Se concentrations in OP1109 (Table 1) stimulated the production of larger grains and shortened crop cycle, leading to a faster maturity. Considering that foliar fertilization was the sole variable during plant growth, as also pointed by Sors et al. (Reference Sors, Ellis and Salt2005), our data suggest that the farraginous masses developed by all rice genotypes are linked to different assimilation rates of selenate and organic Se compound absorption (which is an active process), whereas selenite seems to be accumulated through passive diffusion. Interesting was to notice that this characteristic is genotype-dependent. Under Mediterranean conditions, Poblaciones et al. (Reference Poblaciones, Rodrigo, Santamaría, Chen and McGrath2014) found that grain yield and quality of durum wheat were not affected by Se-biofortification (10, 20 and 40 g ha−1). Accordingly, Fang et al. (Reference Fang, Wang, Xin, Zhao, An and Hu2008) reported no significant effect of foliar Se application (at the panicle growth stage) on rice yield and weight of 1000 grains.
Our data also revealed that although foliar Se application might be successful for rice biofortification, its efficiency when using selenite is higher (Table 2). Moreover, Chen et al. (Reference Chen, Yang, Xu, Yun, Hu, Zhang and Pan2002) found that selenate is more available for rice uptake by roots than selenite, eventually because is taken up through the sulphate transport system (Shinmachi et al., Reference Shinmachi, Buchner, Stroud, Parmar, Zhao and McGrath2010). Although selenite and phosphate use a common transporter (Zhang et al., Reference Zhang, Feng, Chan and Larssen2014), the successful rice biofortification with selenite found herein might be a consequence of longer periods under flooded conditions. This can result in higher concentrations of total and extractable Se. Indeed, flooding might lead to reductive dissolution of iron oxyhydroxides, which are important sorbents of Se forms like selenite (Li et al., Reference Li, Liu and Chen2016).
Following an agronomic perspective, independently of the foliar fertilization with selenite or selenate, our data further show that Se accumulates in the embryo of wheat grains, but is also distributed evenly throughout the whole grain (Figure 1). Ultimately, the distribution of Se and sulphur are coincident, being uniformly dispersed throughout the aleurone layer surrounding the endosperm and concentrated in the protein area around the starch granules of starchy endosperm cells (Moore et al., Reference Moore, Schröder, Lombi, Zhao, McGrath, Hawkesford and Grovenor2010). In fact, the distribution of Se and sulphur are similar since they share the same mechanisms of absorption and transport (Feeney et al., Reference Feeney, Heard, Zhao and Shewry2003). Furthermore, selenate is likely transported via sulphur assimilation pathway (Write et al., 2007; Carey et al., Reference Carey, Scheckel, Lombi, Newville, Choi, Norton, Price and Meharg2012), being converted to selenite and therefore into organic species (SeCys and SeMet), replacing Cys and Met in proteins. As Se accumulates in all rice grain and there is a considerable interest in increasing the contents of Se in the edible part of crops, industrial processing (dehusking, whitening and milling) has little effect on grain Se concentrations. In fact, it must be noticed that without biofortification the content of Se in rice remains very low to meet the requirements of dietary intake of human populations (Carey et al., Reference Carey, Scheckel, Lombi, Newville, Choi, Norton, Price and Meharg2012; Sun et al., Reference Sun, Liu, Williams and Zhu2010; Williams et al., Reference Williams, Lombi, Sun, Scheckel, Zhu, Feng, Zhu, Carey, Adomako, Lawgali, Deacon and Meharg2009).
Independently of selenite or selenate fertilization, macronutrients distribution in rice crops followed a similar trend (Figures 2 and 3). The relative proportions among tissues and genotypes also displayed relevant variations, which is in agreement with White and Broadley (Reference White and Broadley2005), who found considerable genetic deviation in concentrations of minerals in the edible portions of most food-bearing species. Among micronutrients, we could not verify a clear trend for Zn accumulation among tissues, but the embryo of biofortified grains with selenite at 60 g Se ha−1 presented higher Zn content than the control (Figure 3). Grain Zn concentration usually varies between 15.9 and 58.4 mg kg−1 (Graham et al., Reference Graham, Senadhira, Beebe, Iglesias and Monasterio1999; Wissuwa et al., Reference Wissuwa, Ismail and Yanagihara2006), prevailing in the embryo (Duarte et al., Reference Duarte, Prom-u-thai, Amaral, Faquin, Guilherme, Reis and Alves2016; Graham et al., Reference Graham, Senadhira, Beebe, Iglesias and Monasterio1999; Takahashi et al., Reference Takahashi, Nozoye, Kitajima, Fukuda, Hokura, Terada and Nishizawa2009; Wissuwa et al., Reference Wissuwa, Ismail and Yanagihara2006) and a similar pattern was found in our study.
The distribution of Fe and Mn remained similar in the grain with Se supplying, whereas Cu accumulation had a synergistic trend with Zn (Figures 2 and 3). Bashir (Reference Bashir, Takahashi, Akhtar, Ishimaru, Nakanishi and Nishizawa2013) also reported that Fe distribution occurs in all tissues of the grain, with different concentrations in the aleurone layers, endosperm and embryo scutellum. Moreover, Takahashi et al. (Reference Takahashi, Nozoye, Kitajima, Fukuda, Hokura, Terada and Nishizawa2009) found that most of Fe is associated with the embryo and the aleurone layer, being such distribution dependent on soil pH, carbonate concentration, and water conditions. Large amounts of Fe and Zn are bound to free proteins and amino acids in the embryo and bran, being less concentrated in the endosperm (Cakmak et al., Reference Cakmak, Pfeiffer and McClafferty2010; Ozturk et al., Reference Ozturk, Yazici, Yucel, Torun, Bagci, Ozkan and Sayers2006). This is an issue for human nutrition as rice processing (i.e., dehusking, whitening and milling) eliminates these tissues decreasing the nutritional value. Grinding is another factor that can contribute to the difference in the proportion of the minerals. In fact, Wang et al. (Reference Wang, Wu, Li, Zhang, Yang and Shi2011) verified that the minerals in the brown rice decreased with intensity of grinding and Itani et al. (Reference Itani, Tamaki, Arai and Horino2002) found that the concentration of some minerals (P, K, Mg, Ca and Mn) decreased from the outermost fraction to the inner part. In contrast, milling had little detectable effects on Zn and Se contents because macroelements are concentrated in the outer layer and the microelements such as Zn and S are relatively evenly distributed in rice grain.
CONCLUSION
Independently of the chemical form of Se used for foliar fertilization, Se prevails in all grain tissues. Se biofortification of rice grains of OP1109 with selenite spraying triggered the best grain weight and Se contents. Although the endosperm is the most important grain fraction for human nutrition, a large deposition of minerals occurred in the embryo and aleurone. Our study further supported that aleurone in Se biofortified grains is a storage reservoir for positively charged metals, such as Ca, Mg, K, Zn and Fe. As our mapping data on Se biofortification revealed that a large amount of nutrients is in the embryo, removal of husk, embryo and aleurone layer during peeling and polishing substantially reduces the nutritional value (mostly macronutrients) of rice grains. In this context, the industrial processing must consider that rice bran is a very valuable source of nutrients, and that brown rice is health-preferable as it contains more nutritional mineral components than milled rice.
Acknowledgements
This research was partially supported by a grant from CAPES, Brazil (Proc. 153113-1).
SUPPLEMENTARY MATERIAL
For supplementary material for this article, please visit https://doi.org/10.1017/S0014479718000157