Introduction
Table grapes own a prominent position in human nutrition since ancient times while their production have reached 21.1 million tons globally in 2015 (FAS/USDA, 2015). Table grape quality is affected by various parameters such as spatial environmental variability, weather conditions and agronomic practices (Rather et al., Reference Rather, Wani, Haribhushan and Bhat2011; Mohsen, Reference Mohsen2011; Kelany et al., Reference Kelany, Abdel-Wahab, Abdel-Hafeez and Emam2011; Sen et al., Reference Sen, Oksar and Kesgin2016). Precision Viticulture (PV) is regarded as the application of Precision Agriculture (PA) in vineyards. PV is a continuous ring process (Bramley et al., Reference Bramley, Pearse and Chamberlain2003) that consists of field data collection, data analysis, management decisions and evaluation of the applied practices. The main objective of PV is to manage vineyards at sub-field scale by delineating management zones. Within the delineated management zones, the effect of soil and other abiotic factors on grapevine parameters (yield, vigour, grape composition) is considered similar (Kitchen et al., Reference Kitchen, Sudduth, Myers, Drummond and Hong2005) and the consequent fruit quality and quantity comparable. (Keller, Reference Keller2010).
Different types of field data have been employed in delineating management zones. These data include elevation, soil electrical conductivity, slope, spectral vegetation indices (e.g. NDVI), cation exchange capacity, organic matter, pH, soil nutrient content and other data (Fridgen et al., Reference Fridgen, Kitchen, Sudduth, Drummond, Wiebold and Fraisse2004; Li et al., Reference Li, Shi, Li and Li2007; 2010; Tagarakis et al., Reference Tagarakis, Liakos, Fountas, Koundouras and Gemtos2013). Peralta and Costa (Reference Peralta and Costa2013) suggested that soil electrical conductivity has been successfully associated with the spatial distribution of soil properties and some nutrients and thus in delineation of management zones. Guastaferro et al. (Reference Guastaferro, Castrignano, De Benedetto, Sollitto, Troccoli and Cafarelli2010) referred to the different algorithms that can be used in management zones delineation, such as fuzzy c-means, non-parametric density method and the ISODATA method.
However, delineation of management zones has been proven to be a complex task due to the large number of parameters involved and therefore selection of the appropriate methods is quite difficult (Santos et al., Reference Santos, Molin and Saraiva2013). For this reason, selection of different methods may result in different management zones and thus in different spatiotemporal stability (Guastaferro et al., Reference Guastaferro, Castrignano, De Benedetto, Sollitto, Troccoli and Cafarelli2010; Peralta et al., Reference Peralta and Costa2013; Shaddad et al., Reference Shaddad, Madrau, Castignano and Mouazen2016). Research on precision viticulture application in table grapes vineyards is significantly less compared to wine grapes (Permanhani et al., Reference Permanhani, Miguel Costa, Conceicao, de Souza, Vasconcellos and Chaves2016). For this reason, the aim of this study was to assess the spatiotemporal stability of table grapes yield and quality parameters and to evaluate the use of NDVI as a non-destructive method for this purpose.
Materials and methods
The study was conducted in a commercial table grape vineyard located in Southern Greece during years 2015 and 2016. It was planted in 2006 with Vitis vinifera L. cv. Thompson seedless (37ο 54.532’ N, 22ο 44.798’ E, Corinth, Greece) at 1.4 ha. The field exhibited variation in soil texture having two different soil types (sandy clay loam and clay loam). Table grapes were trained to a double cross arm trellis system and spaced by 1.8×2.6 m. The vineyard received numerous vineyard operations (canopy management) to adjust the more vigorous vegetation. In addition, plant growth regulators and fertilizers were excessively used to reach the commercial standards regarding the berry diameter and sugar content along with high yield.
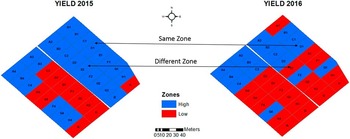
A regular grid of 36 cells (0.0298–0.0404 ha per cell) was set up to facilitate field sampling in order to assess crop vigour, yield and grape quality covering the total area (Tagarakis et al., Reference Tagarakis, Liakos, Fountas, Koundouras and Gemtos2013; Farid et al., Reference Farid, Bakhsh, Ahmad and Mahmood-Khan2016) (Figure 1). Soil electrical conductivity was measured using the EM38 sensor (Geonics Ltd., Ontario, Canada). This measurement was used for delineating the number of the management zones that would be used as the basis for investigating the spatiotemporal stability of the measured crop parameters. Crop vigour at 5 different developmental stages of the vine (flowering (F stage), pea size berries (P stage), majority of berries touching (BT stage), veraison (V stage) and berries ripe for harvest (H stage)) was assessed by measuring the Normalized Difference Vegetation Index (NDVI). A Crop Circle NDVI sensor (ACS-470, Holland Scientific Inc., Lincoln, NE, USA) with the sensor located at 1.5 m height from the soil surface and 1.2 m horizontally from the vines was used for scanning the side canopy area. The table grapes were harvested by hand during September 2–3 2015 and August 21–222016. The actual yield was estimated during harvest period by measuring the total number of bins per cell and multiplying it with the average bin weight with harvested table grapes. Samples of 50 berries were taken from each vineyard cell at harvest from different grapevines and clusters. Berry diameter was estimated adopting the image analysis software ImageJ 1.46r (Research Services Branch, NIMH, Bethesda, USA). For this reason, each berry of the berry sample lots was placed in a custom made berry holder in an upright position and photographed with a digital camera Konica Minolta Dimage Z2 (4.0 Mpixel). The retrieved digital image was imported in the ImageJ for calculating Feret’s diameter of every berry, where the mean value for every berry sample lot was calculated. Individual berry fresh weight was determined on each sample of 50 berries per vineyard cell using a digital scale. The initial sample of 50 berries per cell was split in half for measuring the deformation force in each of the 25 berries (deformation distance was taken as 1 mm based on Bourne (Reference Bourne2002) and the rest of the 25 berries the maximum force to detach the berry’s peduncle; texture analysis was carried out in a Texture Analyser TA-XT2i (SMS, Surrey, England). After these measurements the berries were pressed for extracting juice. The extracted juice was used to measure the total soluble solids (oBrix) by a digital refractometer (SR400), the titratable acidity by a Fruit Acidity Meter GMK-708 (G-won Hitech Co., Seoul, South Korea) and the pH by a pH meter AD8000 (Adwa Hungary Kft., Szeged, Hungary). The ripeness index is important for table grapes market and was calculated by dividing total soluble solids with titratable acidity (Munoz-Robredo et al., Reference Munoz-Robredo, Robledo, Manriquez, Molina and Defilippi2011). Another product quality index was calculating the interaction between total soluble solids and berry diameter. This index is based on the importance that these parameters have to the table grapes market.
DOA of yield zones between 2015 and 2016

Management Zone Analyst 1.0.1 (MZA) (University of Missouri, Columbia, USA) was used to delineate the number of management zones of the table grapes vineyard based on the soil electrical conductivity. The MZA uses fuzzy c-means clustering algorithms for doing this as it is described by Fridgen et al. (Reference Fridgen, Kitchen, Sudduth, Drummond, Wiebold and Fraisse2004). Then, the MZA was used to allocate each parameter to a management zone based on the already delineated number of zones from soil electrical conductivity.
The degree of agreement (DOA) was calculated by measuring the number of cells that belong to the same zone between these two years based on the methodology that is described by Tagarakis et al. (Reference Tagarakis, Liakos, Fountas, Koundouras and Gemtos2013). The ability of NDVI to delineate management zones of different vine parameters was assessed through Pearson’s correlation and by comparing the DOA of the NDVI that presented the highest correlation with the most important parameters.
Maps of the aforementioned measurements were generated in ArcGIS 10.2.2 (ESRI, California, USA). The statistical analysis included Pearson’s correlation matrices and descriptive statistics for all the measurements and was conducted with the statistical software SPSS 23 (IBM Corp., New York, USA).
Results and discussion
Analysis showed that two management zones were considered as the most stable number of zones against the three and four management zones. The two management zones assumption presented both the lowest fuzziness performance index (0.0071) and normalized classification entropy (0.004) compare to the three (0.0293 and 0.0156 respectively) and the four management zones (0.0206 and 0.0145 respectively). As a result, there were two management zones (one of high value and one of low value) for each measured parameter and each year that were compared.
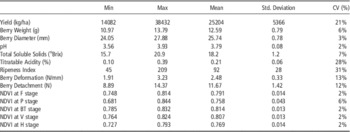
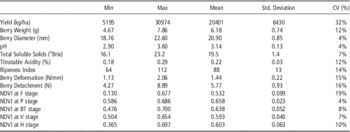
Table grapes production presented higher output in terms of quantity and quality characteristics in 2016 in comparison to 2015 harvest year (Tables 1 and 2). Specifically, mean yield was 5 t/ha higher during 2015, while berry weight was two-fold higher during 2015 against 2016 and the mean berry diameter was 1/5 bigger compared to 2016. Total soluble solids and pH were lower in 2015 compared to the 2016, while ripeness index and titratable acidity were almost the same between these two harvest years. Ripeness index and titratable acidity also presented higher variability in 2015 (CV=31% and 28%) compared to 2016 (CV=14% and 12% accordingly). Consumer parameters (berry deformation and berry detachment) were twofold higher in 2015 compared to 2016 which means that the berries during the first harvest year were crunchier and detached much less from their peduncle than the berries of the 2nd harvest year. NDVI at different crop stages presented the same pattern as the most crop parameters (lower NDVI values in 2016 compared with 2015) suggesting that the quantity and quality parameters were affected by the crop vigour of table grapes.
Descriptive Statistics of 2015

Descriptive statistics of 2016

The main reason for the different performance of the vineyards during the two cultivation years was due to the difference of the weather conditions since the farmer followed the same cultivation practices in both years. In 2015, there were mild weather conditions with 32.8 mm of precipitation from flowering until harvest that helped table grapes production in terms of yield and quality. While in 2016, warm and dry (0.8 mm of precipitation) climate conditions from flowering until harvest were recorded. The previous climate conditions resulted in lower vigour due to extended crop water stress. Water stress conditions affected not only the total yield but other parameters as well. Specifically, berries presented two fold decrease in weight and 20% decrease in diameter while they had higher total soluble solids due to their lower water content (Tables 1 and 2).
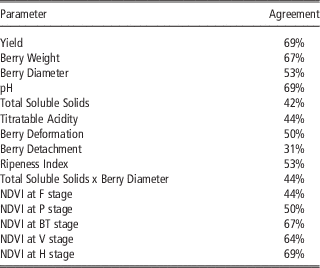
The preliminary results showed different DOA among the measured crop parameters and the two harvest years as it can be seen in Table 3. Only yield, berry weight, pH and NDVI presented high DOA between the two harvest years. Berry diameter and total soluble solids that are considered as the most important quality parameters for the market and the farmer as well presented poor DOA (53% and 42% accordingly). This trend indicates that the management zones delineation based on table grapes quality was shifted between the two harvest years and therefore delineation should be dynamically adjusted each growing season. However, these parameters are also affected by cultivation practices such as the use of crop growth regulators. DOA between NDVI values of different crop stages were above 60% only from BT stage to H stages making them appropriate for delineating management zones based on crop vigour.
DOA of the same parameter between 2015 and 2016

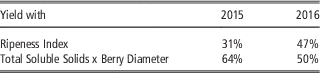
As it can be seen in Table 4, there was poor agreement between yield and ripeness index among the two harvest years (<50%). This indicates that selective harvesting based on different harvesting time would not be applicable for this field. However, there was above 50% agreement between yield and yield quality (total soluble solids x berry diameter) for each year. Consequently, spatial based selective harvesting would be more profitable for the farmer.
DOA between yield with ripeness index and total soluble solids x berry diameter

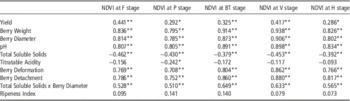
NDVI at veraison mainly presented the highest correlations with quantity and quality parameters (Table 5). Only titratable acidity and ripeness index were not correlated with NDVI at the three crop stages. NDVI was correlated positively with all the table grapes’ parameters except from the total soluble solids and titratable acidity. This is in accordance with previous studies in wine grapes (Fiorillo et al., Reference Fiorillo, Crisci, De Filippis, Di Gennaro, Di Blasi, Matese, Primiceriom, Vaccari and Genesio2012; Fountas et al., Reference Fountas, Anastasiou, Balafoutis, Koundouras, Theoharis and Theodorou2014).
Pearson’s correlation matrix between NDVI and measured parameters

**Correlation is significant at the 0.01 level (2-tailed).
*Correlation is significant at the 0.05 level (2-tailed).
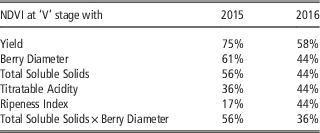
DOA between NDVI at veraison stage and crop parameters was higher in 2015 except of titratable acidity and ripeness index. Only the DOA between NDVI and yield was higher than 50% for these two years, with 75% of agreement in 2015. NDVI at veraison stage presented equal or higher degree of agreement between berry diameter, total soluble solids and titratable acidity compared with the combinations of them for each year. DOA between NDVI at veraison stage and yield, berry diameter, total soluble solids and total soluble solids and berry diameter was higher in 2015 compared with 2016 (Table 6). These findings indicated that extended crop water stress affected spatial variability.
DOA between NDVI at ‘V’ stage with yield, berry diameter, total soluble solids, titratable acidity, ripeness index and total soluble solids x berry diameter

Conclusions
Table grapes presented lower spatial stability in quality parameters compared to yield, berry weight and NDVI for the two years of study. This indicates that the latter parameters can be used for management zones delineation more efficiently compared to quality parameters. NDVI at various crop stages presented significant correlations with yield and quality parameters with NDVI at veraison had the highest performance. However, NDVI at this crop stage didn’t present high spatiotemporal stability with them.
Acknowledgements
We would like to thank Pegasus Coop and especially Dimitris Theodorou for his contribution at our field experiments. Also, we would like to thank Stamatia Voulgaraki, Eirini Karagianni, Anna Mesimeri, Essam Sh. Mohamed, Vangelis Dimitriou, Christos Karavas, Giorgos Kyriakogkonas, Dimitris Arapis, Panagiotis Kostopoulos and Giannis Chamatzolas for their precious contribution at field and laboratory measurements.