Introduction
After one year from the ratification of this article the manufacture, sale, or transportation of intoxicating liquors within, the importation thereof into, or the exportation thereof from the United States and all territory subject to the jurisdiction thereof for beverage purposes is hereby prohibited.
Article XVIII, Section 1, Constitution of the United States
The Eighteenth Amendment propelled the United States into one of the most curious and controversial period of its history. The 13-year US prohibition of alcohol (1920–33) continues to fascinate generations of historians and yielded voluminous literature from the sociology and political sciences. That fascination stems in part from the fact that in the land of individual freedom and minimalist government, this extreme form of government intervention into regulating people's behavior has always been considered somewhat of a paradox.
Much less well known is that the prohibition movement was international and that many other countries went through vigorous struggles over the issue.Footnote 1 A particularly interesting case is New Zealand, which could well have been the very first prohibitionist country in the world in 1911, a decade before the United States, if its first referendum in 1911 had had its majority threshold set at 50 percent instead of at 60 percent. However, New Zealand's uniqueness lies in its astonishing number of 24 national referendums on alcohol prohibition held over much of the twentieth century, from 1911 to 1987.
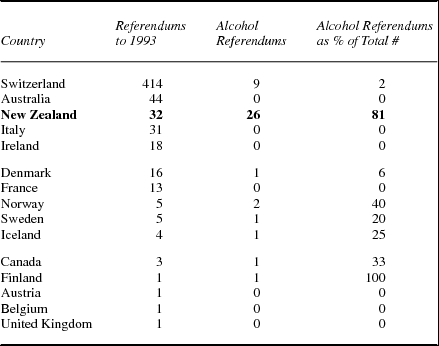
The international comparison in table 1 is persuasive. New Zealand, a country with less than 1 percent of the world's population, held more than 60 percent of the total number of national referendums on alcohol (26 out of 42). No other government initiated binding nationwide prohibition referendums at every general election for almost eight decades. This is surprising because, in a parliamentary system such as New Zealand's, referendums are atypical because they run against the fundamental principle of a British type of representative government. In New Zealand's entire history, there were 38 referendums, and 26 of them concerned alcohol: the 24 triennial polls on prohibition and the two special ones (in 1949 and 1967) on the extension of bars’ closing time from 6 p.m. to 10 p.m.Footnote 2
National referendums in 15 countries to 1993
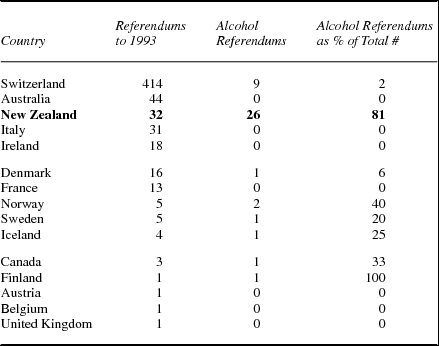
Source: Butler and Ranney (Reference Butler and Ranney1994 [Reference Butler and Ranney1978]) in Christoffel (Reference Christoffel2006: 62).
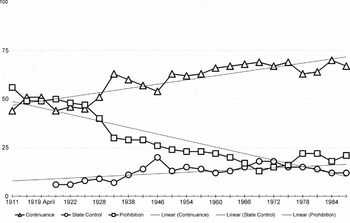
Figure 1 shows the outcome of the 24 referendums over the eight decades. Only in the very first in 1911 did prohibition reach a majority of the vote (56 percent), but because the threshold was then set at 60 percent of the vote, prohibition was not implemented. The threshold was reduced to a 50 percent majority in 1919, and prohibition then came tantalizingly close to winning with 49 percent of the vote. In the 1920s, the Dry vote remained close to 40 percent, and after that decade, it declined to 30 percent or less.
National Licensing Referendums in New Zealand 1911-87.

Because alcohol was an extremely divisive social and political issue at the turn of twentieth century in many Western countries, particularly those of Anglo-Saxon culture,Footnote 3 referendums may have played the role of a safety valve, reassuring the government that its action would be supported by a majority of voters, somewhat like polls today. Referendums on prohibition are particularly useful tools to evaluate the strengths and stakes of the prohibitionists and their opponents. Therefore, a quantitative analysis of referendums provides additional insights into the primarily qualitative historical and sociological literature on the prohibition of alcohol.
Following Deacon and Shapiro's (Reference Deacon and Shapiro1975) now seminal article, a large number of quantitative studies have been conducted on American state or local referendums held on a variety of policy issues: environmental (Kahn and Matsusaka Reference Kahn and Matsusaka1997; Kotchen and Powers Reference Kotchen and Powers2006), health (Costa Reference Costa1995), education (Romer et al. Reference Romer, Rosenthal and Munley1992), and fiscal behavior (Matsusaka Reference Matsusaka1995). Far fewer studies have been conducted on referendums on alcohol prohibition. Although there were close to 100 American statewide referendums on alcohol prohibition and more than 20 outside the United States during the 1880–1930 period, very few of these have been the subjects of empirical analyses.
Four of those empirical analyses focus on a single American state: Wasserman (Reference Wasserman1989) on Missouri; Wasserman (Reference Wasserman1990) on California; Dinan and Heckelman (Reference Dinan and Heckelman2005) on Oregon; and Endersby (Reference Endersby2012) on Texas. A more comprehensive study is Lewis (Reference Lewis2008), which analyzed 30 referendums in 25 states over the period from 1907 to 1919, and the most recent work by Dinan and Heckelman (2014) on the state referendums to select delegates to ratify the Twenty-First Amendment, which repealed prohibition in 1933. Outside the United States, there seems to be only one study, by Dostie and Dupré (Reference Dostie and Dupré2012) on the Canadian 1898 referendum.
This article focuses on the first five referendums held in New Zealand from 1911 to 1922, a particularly critical period for the prohibition movement. This is because, in New Zealand as well as in many other countries, the first 20 years of the twentieth century were the years when the struggle between Drys and Wets reached its highest intensity (as Bollinger [Reference Bollinger1967 (Reference Bollinger1959)]: 45] wrote: “the high watermark of the movement”). As a result, it was at that time that four countries, the United States, Russia, Finland, and Norway, became prohibitionist, and that New Zealand, as we will see in the following text, came tantalizingly close to prohibition on three occasions. In New Zealand, the 1910s were also a period of innovation and experimentation for the New Zealand government that first proposed a choice between local and national prohibition in 1911 and 1914, and then included the possibility of financial compensation to the option of prohibition in April 1919. This possibility was withdrawn a few months later, in December 1919, and replaced by the introduction of a third scenario, state control. It is also during that decade that two majority thresholds were experimented with 60 percent in 1911 and 1914 and 50 percent thereafter. After the 1910s, these experimentations stopped and the referendum questions remained the same for next seven decades.
Our empirical analysis has two components. The district-level referendum results present rare features such as the participation rate by gender in 1911; parallel voting on local and national prohibition in 1911 and 1914; the identification of the military votes in the two referendums of 1919; the option of prohibition with compensation in 1919; and from 1919 on, the addition of a state-control regime as a third option. We first investigate how the different referendum designs influenced voting patterns.
We also investigate the role of the main determinants of voting behavior identified in the historical and sociological literature on temperance and prohibition: religious affiliation, women's participation, urbanization, and population heterogeneity. Despite some important data limitations, we find evidence consistent with an important role played by religion and gender: Evangelicals seemed more likely to support prohibition as opposed to the more moderate Anglicans and Catholics, and women seemed more likely to vote Dry.
We do not find statistical evidence that urbanization and population heterogeneity played much of a role in explaining voting patterns. This latter finding can be explained by the fact that immigrants to New Zealand were very different from immigrants to the United States. Although New Zealand was also an immigrant society, with 30 percent of its population foreign-born at the turn of the twentieth century, 93 percent of those immigrants were of Anglo-Saxon origin. This means immigrants to New Zealand were sharing much more cultural and linguistic backgrounds than immigrants to the United States. However, there is some evidence that districts with a higher share of Maori are more likely to prefer the Dry option.
The rest of the article is organized as follows. The second section outlines the history of the prohibition issue in the nineteenth century setting New Zealand in a comparative perspective, more specifically with the United States. The third section details the story up to the 1920s, focusing on New Zealand's unique triennial national polls on prohibition. The outcome of the five referendums is discussed and the way the different referendum designs influenced the votes is explored. The fourth section specifies the political economy model. The fifth section explains the particular challenges of the data, and the sixth section discusses the estimation results.
The Nineteenth-Century Historical Background: From Temperance to Prohibition
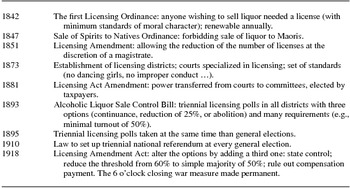
New Zealand belonged to the international movement, which was particularly vigorous in the Anglo-Saxon world, to increase restrictions on alcohol in the late nineteenth and early twentieth centuries. Indeed, there seems to be a consensus among New Zealand historians that alcohol has constituted a morally and socially suspect commodity in New Zealand for much of its history.Footnote 4 Like in the United States, the story of the New Zealand temperance movement's struggle to suppress the liquor trade went through three phases: individual abstinence pledges in the 1840s–60s, local option bans in the 1880s–90s, and finally, the drive to national-level prohibition in the 1900s–10s. Table 2 lists the most important pieces of legislation from 1842 to 1918.
A chronology of New Zealand alcohol legislation 1842–1918

Sources: Bollinger (Reference Bollinger1967 [Reference Bollinger1959]); Prince (Reference Prince1996); Ministry for Culture and Heritage (2009); New Zealand Yearbooks, various years.
In colonial New Zealand, like in other frontier societies, heavy drinking was commonplace. In the first half of the nineteenth century, New Zealand society was primarily comprised of young single males who were inclined to binge drink after their physical exertions of gold digging and clearing the bush. In such a social setting, levels of drunkenness were high, and social order was not easily maintained.Footnote 5 Alcohol consumption at that time, particularly in the form of spirits, was higher than in any other period in New Zealand history.Footnote 6
The temperance movement arose out of concerns that this behavior was evil for the individual and disruptive for society. At both levels, the movement led by Protestants, particularly the Methodist and Presbyterian denominations, was focused on salvation. The first temperance society founded in England in 1835, the Order of Rechabites, was established in New Zealand in 1843. In the 1860s and 1870s, other temperance organizations such as the Band of Hope (centered on young people), the Order of Good Templars, and the Sons and Daughters of Temperance were set up in New Zealand some 10 to 20 years after their foundation in England and the United States. They required their members to sign abstinence pledges. Those individual pledges were very popular but were not satisfactory for the social reformers who wished to eliminate alcohol entirely. They turned to the government and lobbied for the imposition of restrictions and even bans, first at the local level.
In the 1880s, the temperance movement gained momentum with the establishment of the branches of the (first American and by then international) Women's Christian Temperance Union (WCTU)Footnote 7 and of the New Zealand Alliance for Total Suppression of the Liquor Trade (NZA), which gathered together the numerous temperance organizations. In 1895, Parliament ruled that licensing polls were to take place at the same time as general elections. This invigorated the temperance movement, which was increasingly turning into a prohibitionist movement. What was happening in New Zealand is quite similar to what was happening in the United States with the creation of the Prohibition Party in 1869, the formation of the WCTU in 1874, and the establishment of the Anti-Saloon League in 1895.
Thus, even if the ultimate goal of the temperance organizations in both countries was nationwide prohibition, the main policy they fought for and obtained was local option bills that banned the sale of alcoholic beverages in a given district following a poll taken at given intervals. In New Zealand, the no-license vote at the local option polls reached a majority nationally in 1905 and 1908 (Grigg Reference Grigg1983: 164). However, this did not translate into a large number of dry districts; the three-fifths majority was attained in only 12 of the 68 districts.Footnote 8 As a result, there was never more than 16 percent of the New Zealand population living in a dry district.
In the first decade of the twentieth century, the New Zealand temperance movement shifted its political action from the local to the national level, trying to push prohibition through nationwide referendums. This was also happening in the United States at the state level, where more than 60 referendums in 37 states were held between 1880 and 1918. In both countries, direct democracy was an important tool for the temperance movement. In 1910, the NZA finally obtained from the government a law that allowed national prohibition plebiscites at every general election.Footnote 9 However, the threshold was not set at a simple majority but at 60 percent, a “vexatious handicap” for the NZA. To use Prince's (Reference Prince1996: 50) terms, the Liberal government showed “great strategic cunning” by responding positively to the prohibitionists demand for referendums while ensuring that they would be quite difficult to win. Regarding the liquor issue, the Liberal government's (in power from 1891 to 1912) strategy seems to have been that a concession given to one side was balanced by a move to assist the other.
A Referendum on Alcohol Every Three Years: A New Zealand Institution
New Zealanders were asked different questions from 1911 to 1919 and then were asked the same question for the 21 next referendums in the following 70 years. In 1911 and 1914, they had to choose between continuance and prohibition at both at the national and local levels.Footnote 10 In the special referendum of April 1919, the prohibition option was modified to include financial “compensation” to the alcohol industry. Then, in the regular referendum of December 1919, a third option was added: state control and purchase. The questions remained the same hereafter: continuance, prohibition (without compensation), and state control and purchase (with compensation).Footnote 11
One might be intrigued by these systematic triennial polls over much of the twentieth century. There is a consensus among New Zealand political scientists and historians that the main reason was to keep the very sensitive issue of alcohol out of party politics and of the arena of parliamentary politics.Footnote 12 Because of the moral nature of the question, there were sharp divisions within the Liberal Party (in power from 1891 to 1912) and within the other political parties that followed. By putting the liquor issues to the vote of “the people,” prime ministers Richard Seddon in the 1890s and Sir Joseph Ward in the 1900s, succeeded in removing them from parliament. In this, they received strong support from the prohibitionist movement that was—in New Zealand as in North America—very favorable to direct democracy.
Once in place, the liquor referendums held in conjunction with every general election proved extremely difficult to budge. As Christoffel (Reference Christoffel2006: 75) argued, prohibitionists were a minority (less than 30 percent by 1935 and less than 20 percent by the 1960s) but a minority with strong convictions. The fear of upsetting them by abolishing a referendum that validated their importance every three years was too great for governments of all persuasions. This was acutely observed by Bollinger (Reference Bollinger1967 [Reference Bollinger1959]: 48–49): “in many electorates, the Prohibition vote (less than 20 percent) is a great deal bigger than the difference between candidates. If something was done to offend prohibitionist susceptibilities the fate of a government might be sealed.”Footnote 13
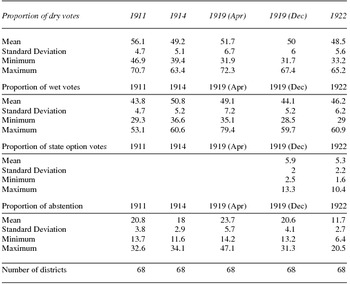
Table 3 presents the descriptive statistics of the Dry, the Wet, and the State votes and the Abstentions for the first five referendums. A noticeable feature is the turnout rate of 80 percent or more, which is very high and quite unusual for that type of referendum.Footnote 14 One might think that it was precisely the reason why the referendums were set up on the same day as general elections. Turnout remained high until the end in 1987 even though the issue had lost most of its salience and the liquor polls had become anachronistic.
Descriptive statistics

Notes:
• The 68 districts are very similar in size (12,000 to 15,000 people), except for the four districts of the cities of Auckland, Christchurch, Dunedin, and Wellington (32,000 to 45,000). In 1928, these four urban districts were split in order to reduce their size to a figure similar to the one prevailing in the rest of the country.
• The New Zealand Representation Commission redistributes the electoral districts systematically every five years to maintain their comparability in terms of population. This means that the five referendums fall into three different electoral maps: the first three were under the Redistribution of 1911, the fourth was under the Redistribution of 1918, and the fifth was under the Redistribution of 1922 (McRobie Reference McRobie1989). Almost all districts kept their original names but a significant number of them had different borders.
• Statistics for 1919 (Apr) and 1919 (Dec) do not include the military vote (it was counted separately).
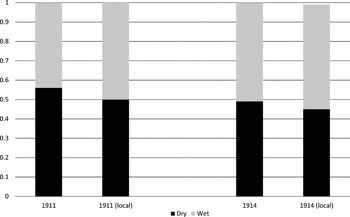
The results of the 1911 referendum were astounding: 55.8 percent voted in favor of national prohibition. Without the 60 percent threshold, New Zealand would have become the first prohibitionist nation in the world, eight years before the United States and three years before Russia. As observed in figure 2, national prohibition received even more support than local no-license in the two referendums of 1911 and 1914, in which people could vote on separate ballots for local and national prohibition. At first sight, this voting result is surprising because it would seem to be easier to live in a dry district knowing that there were wet districts nearby. Furthermore, in a country as geographically isolated as New Zealand, national prohibition would have really been dry because it would have been much less difficult to enforce prohibition than in a country such as the United States, which shares enormous borders with Wet neighbors Canada and Mexico. The second national referendum of December 1914 took place a few months after the outbreak of World War I. The vote for nationwide prohibition dropped a few points from 55.8 percent to 49 percent and remained slightly higher than the cumulative vote for local no-licensing.
New Zealand National Referendum of 1911 and 1914: Votes for National and Local Prohibition.

At the end of the war, the liquor issue returned to the forefront with the 1918 adoption of the Licensing Amendment Act, which featured important changes concerning the referendums: the lowering of the majority requirement from 60 percent to 50 percent, a clause of “compensation to all those engaged in the industry” in the event of prohibition, and a special provision for a national referendum to be held in April 1919, separately from the general election of December, which included the votes of military members who were abroad or on returning troopships.Footnote 15
This special liquor referendum of April 1919, like the first national referendum of 1911, had a quite dramatic outcome. As observed in table 3, the Dry vote obtained a majority 51.7 percent, which should have been sufficient to impose prohibition under the new rule of simple majority. However, that result did not factor in the military ballots. Their 40,000 votes, 80 percent of which were, unsurprisingly, against prohibition, tipped the balance to a Dry vote share of 49 percent, barely 2,000 votes short of victory. Those were extremely frustrating results for the prohibitionists.
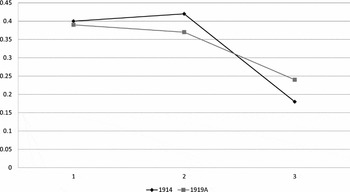
In that April 1919 referendum, for the first and only time, the choice was between prohibition with compensation or continuance.Footnote 16 This feature would have given a unique opportunity to explore the influence of financial compensation on voting, were it not for the fact that this referendum was also the only one to be held outside a general election. When we compare in figure 3 the outcome of this special referendum with the 1914 regular referendum, we observe that the share of the Dry vote remained constant whereas abstention increased at the expense of the Wet vote. This is an interesting finding that suggests that the Drys were more mobilized and ideologically driven than the Wets.
The Special Referendum of April 1919 in New Zealand: A Comparison with 1914.

Eight months later, in December 1919, a second referendum was held in conjunction with the general election. Compensation in the event of prohibition had been abolished, and a third option, state purchase and control (with compensation), was added. Once again, prohibition obtained a score of 49.7 percent, extremely close to a majority. The state option obtained a meager 6 percent of the vote.
The government decision to add the option of state control is somewhat puzzling because there was apparently no significant movement in New Zealand that requested this option. State purchase was intended to be with compensation in the case of the nationalization of the liquor trade.Footnote 17 Hardline Drys deeply disliked this new option and were outraged by the moral legitimization given to this evil product by a state sale system.Footnote 18 The Wets seemed more ambivalent. On the one hand, the liquor trade was only lukewarm to a state takeover of its business, even if the option came with a compensation clause. On the other hand, the liquor lobby expected the state control option to capture votes from moderate Drys, thereby splitting the vote for prohibition and making it less likely to succeed (Christoffel Reference Christoffel2008: 159).
In the referendums of 1919 and 1922 the Dry vote share remained stable, whereas the Wet vote share declined (see table 3, last two columns). Because the participation rate increased in 1922 (and in the subsequent referendums of 1925 and 1928), we might conjecture that the third option attracted some citizens who were rather indifferent about the liquor issue and had not voted before. The fact is that state control always remained a marginal choice in New Zealand. Its vote share was below 6 percent in 1919 and 1922, increased slightly to 8 percent in 1925 and 1928 and stayed under 20 percent afterward.
Prohibition did not disappear from the political battlefield after the two dramatic referendums of 1919. In the 1922 and 1925 referendums, prohibitionists still attracted 48.5 percent and 47.3 percent of the votes, quite close to a majority. The American adoption of prohibition in 1919 provided, in its earliest stage, a boost to the prohibitionist movement around the world, making it a reality and no longer only a theoretical concept. In the referendum of 1928, the Dry vote fell sharply to 40 percent. It was the beginning of the end: it never reached 30 percent afterward (see figure 1). Ironically, the American Prohibition experience, by the late 1920s, had played in favor of the antiprohibitionists around the world: the evils of a ban could be compared to the evils of drinking. However, the end of the prohibitionists’ dream came with the Great Depression of the 1930s and, of course, with the abolition of the prohibition in the United States in 1933.
The Political Economy of Prohibition
New Zealand's unique series of referendums can be exploited as an indicator of the preferences of its population for different alcohol regimes, particularly for its most extreme form of control, prohibition. To explain the results of these referendums, we have to investigate who the protagonists were of the two camps, the Drys and the Wets, and their respective strengths and weaknesses. From that discussion, we can infer which explanatory variables should be included in a model of the voting shares of the Drys, Wets, and Abstentions.
A number of potential factors to explore can be drawn from the very substantial historical and sociological literature on the American Prohibition. Unsurprisingly, because the temperance and prohibition movements were international in scope and were particularly vigorous within the Anglo-Saxon world, we found that the factors explaining voting behavior emphasized by the New Zealand literature on alcohol control were very similar to the ones identified in the US literature (see, e.g., the doctoral theses by Grigg Reference Grigg1977 and Christoffel Reference Christoffel2006).
The first important factor is religion. In New Zealand and in the United States, the temperance movement was Protestant-based, and particularly supported by evangelical denominations. Presbyterians, Methodists, Baptists, and Congregationalists were the churches most involved in the New Zealand prohibitionist movement.Footnote 19 The adherents of these four churches represented in the 1911 Census 35.6 percent of the New Zealand population, a smaller proportion than the 46 percent in the United States.Footnote 20
The Church of England and the Roman Catholic Church found prohibition to be too extreme a measure to limit alcohol consumption.Footnote 21 They both favored moderation over prohibition and mostly stayed away from prohibitionist movements, disliking their so-called fanaticism. Although there were some divisions within the Church of England on the best method to address the social problem of drinking, the position of the great majority and of its most prominent members was against prohibition (Cocker and Murray Reference Cocker and Murray1930: 2, 6; Eldred-Grigg Reference Eldred-Grigg1984: 186, 188). In New Zealand, these two churches represented a majority of the population with 40 percent of the population being Anglicans and another 14 percent Roman Catholics (New Zealand Census 1911).
There is a consensus among New Zealand historians that religion played a crucial role in the political struggle over prohibition in New Zealand. The most recent study by Christoffel (Reference Christoffel2006: 39–40) is unequivocal: “An important reason for the success of Prohibitionism in New Zealand is its close association with religion, particularly pietist non-conformist churches.” The sample of the temperance leaders during the period from 1894 to 1914 conducted by Grigg (Reference Grigg1977: 58) provides useful information to support this hypothesis. From a sample of 403 temperance leaders, he found that 238 of them (59 percent) were ministers of religion. Of this figure, only 7 percent were Anglicans or Roman Catholics. This result is consistent with the American findings about a clear opposition between two religious views of the world: ritualistic (or Episcopalian) and evangelical (or pietistic).Footnote 22
The second factor is gender. In all countries with a temperance movement, women were on the forefront of the movement. Intemperance was generally a male problem and more specifically a husband problem.Footnote 23 The temperance cause has been linked to women's suffrage by many authors.Footnote 24 In New Zealand, when women's suffrage came before the legislature in 1893, the temperance forces threw their weight behind it with the expectation that women voters would support their cause because they were the homemakers and child bearers and were often perceived as the moral guardians of the family.
However, New Zealand women did not seem to have voted as dry as prohibitionists had hoped. As early as 1898, contemporary analysts such as William Reeves noticed that “[t]hey [women voters] clearly favor temperance reform, but are by no means unanimous for total prohibition. On the whole, the most marked feature of their use of the franchise is their tendency to agree with their menkind.”Footnote 25 In his 1983 article devoted to the issue of women and prohibition in New Zealand, Grigg reiterated this argument. His data show that throughout the period from 1893 to 1915, the WCTU membership represented a very small minority of less than 1 percent of New Zealand adult women (Grigg Reference Grigg1983: 153).
The third factor is rural-urban opposition. Since Hofstadter's study (Reference Hofstadter1955), the temperance movement in the United States has often been considered the ultimate rural grassroots attack on the big cities full of sin and foreigners. In New Zealand, it is true that the first no-license districts were in rural South Island but after the turn of the century, some urban districts joined them in becoming dry. Newman (Reference Newman1975), who examined the 1911 poll by dividing the districts into five categories, did not find clear evidence that the rural electorates were more prohibitionists. However, he did find that the poorer inner cities of Auckland and Wellington were more Wet, and the suburbs and the well-established farming areas more Dry.
In the United States, the fact that rural areas were more supportive of prohibition may reflect in part the difference in the homogeneity of the population between rural and urban settings. American immigrants tended to be concentrated in large cities, making the population of those cities much more heterogeneous. There is a consensus in the literature that the largely WASP (White Anglo-Saxon Protestant) middle-class prohibitionist movement was deeply suspicious and hostile toward the “Un-American low class, low race” new immigrants filling the large cities (Blocker Reference Blocker1976; Gusfield Reference Gusfield1963; Timberlake Reference Timberlake1963).
There is a crucial difference here between the United States and New Zealand in that respect. Although both were immigrant societies with, respectively, 15 and 30 percent of their population being foreign-born at the turn of the century, the diversity of the immigrants’ origins was much lower in New Zealand than in the United States. According to the 1900 US Census, the proportion of foreign-born inhabitants coming from Anglo-Saxon countries, defined as England, Scotland, Ireland, and English-Canada (which is to say less “alien” in terms of their cultural and linguistic backgrounds), was 34 percent of the total number of foreign-born people. Thus, two-thirds of the 10.5 million immigrants came from other countries. The equivalent group for New Zealand, defined as those born in England, Scotland, Ireland, Australia, and the United States, represents 93 percent of foreign-born inhabitants. This is one important reason to believe that immigration did not drive voting behavior as much in New Zealand compared to the United States.
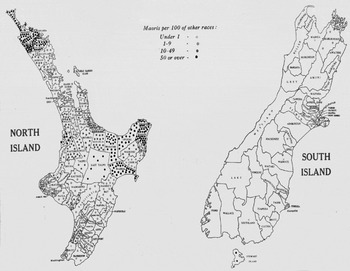
However, an idiosyncratic characteristic of New Zealand's society is the presence of the Maori, the indigenous people of the country. As early as 1847, special rules were put in place by the government to protect Maori from the “evils” of alcohol like the ordinance forbidding the sale of liquor to them. They were thus effectively under an imposed prohibitory regime and were not allowed to vote in the alcohol referendums before 1949. Still, we may speculate that their presence in a given district might have influenced the voters. These voters might have wanted to get rid of alcohol when living close to a Maori tribe because they were afraid of the effect more widespread availability of alcohol might have on them.Footnote 26 In the period of our concern, Maori represented only 5 percent of the population but as figure 4 shows, they were very unevenly distributed over the territory.
Distribution of Maoris and Proportion to Other Races.

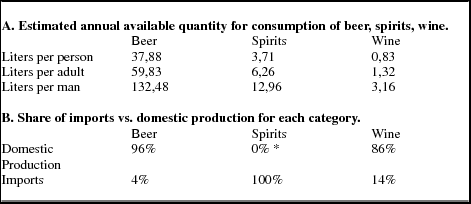
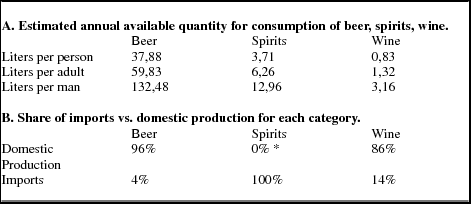
Based on the economic interest rationale, we would expect all segments of the alcohol industry (producers, wholesalers, pub owners) to be combative Wets. At the time, beer was by far the main drink consumed by New Zealanders and the only one that was domestically produced (see table 4). Thus, the antiprohibition lobby was dominated by the beer industry. Brewers, hotel/pub owners, and managers were the ones with the most at stake, along the spirit and wine merchants and importers.
Alcohol consumption, domestic production and importation in New Zealand for the period 1880–1915
Source: Calculated from decennial data in Eldred-Grigg (Reference Eldred-Grigg1984: 283–84) for the period 1880–1915.
* This 0% does not take into account moonshining production, seemingly quite important. Eldred-Grigg reported a police spokesman estimate for 1888 at 860,000 liters, that is almost half of the official imports of that year.
Until the 1920s, the New Zealand beer industry was characterized by a large number of small-sized breweries and thousands of pubs/hotels, which were typically “tied” to a brewery by an exclusive dealing agreement. This considerable number of agents made it very arduous for them to organize to present a united front in the 1890s and early 1900s. During the war, they succeeded in forming an organization that represented the three main groups: brewers, pub owners, and spirits and wine merchants (Bollinger Reference Bollinger1967 [Reference Bollinger1959]: 61). This organization was called the National Council of the Licensed Trade of New Zealand. Its mission was to fight for the abolition of the triennial polls because they generated much uncertainty, particularly when the vote was close in the 1910s and 1920s. Failing to achieve abolition of the triennial polls, the liquor lobby continued to campaign hard for the Continuance (Wet) vote.
By contrast, in the United States, the big business support of the prohibitionist movement seems to have played a much more critical role. Scientific management reinforced the case against drinking. John Rockefeller, Henry Ford, and many others contributed money, speeches, and interventions to the prohibitionist cause.Footnote 27 Christoffel's thesis (2006: 17) does provide evidence of some business involvement in the dry movement in New Zealand, where it was argued that prohibition could be linked to national efficiency concerns. Alcohol was depicted as wasteful, not only to the individual who consumed it but also to national resources, particularly during wartime. Some businessmen supported the cause of prohibition, but most certainly not to the same extent as in the United States.
In summary, the prohibitionist camp was largely made up of Evangelical Protestant middle-class men and women, along with a portion of the big business community concerned with efficiency. The adversaries to prohibition were people in the biggest cities working class, Anglicans and Catholics, and people in the brewing industry.
Data Issues and Limitations
The nature of the New Zealand data in that time period provides serious challenges to any empirical investigation of the effect of the determinants of voting behavior identified in the previous section. One important difficulty is the matching of the data at the electoral district level to the census district level in a satisfactory way. This is difficult because the referendum results, our dependent variable, are reported at the electoral district level (68 districts), whereas almost all potential important explanatory variables (religious denominations, birthplace, ratio of Maori/white population) are only available at the level of 228 census districts (118 administrative counties plus 110 boroughs). The sole variables published at the electoral district level are the urban proportion of the population and the number of voters by gender, the latter for the 1911 referendum only.
In order to be able to assess the impact of the main factors outlined in the previous section, we attempted to match the 1911 administrative boundaries of the census data to the electoral boundaries.Footnote 28 This matching process can be divided in four steps:
-
1. The most disaggregated data in the 1911 Census are available for 228 units: 118 administrative counties or geographical units that exclude boroughs and town districts, thus akin to rural districts, and 110 boroughs and town districts. These boroughs and town districts are not legally part of the county in which they may be geographically situated, as they are independently administrated. In 1911, the New Zealand population of one million was split about half and half between the 118 administrative counties and the 110 boroughs. We use these census data to construct descriptive variables on religious affiliation, place of birth, and ethnicity.
-
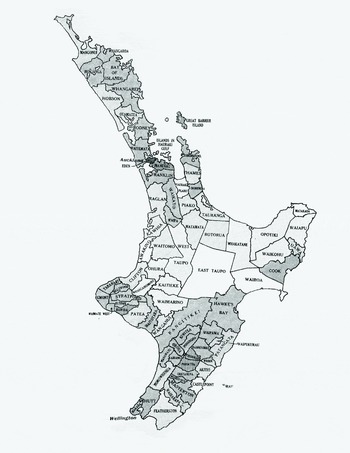
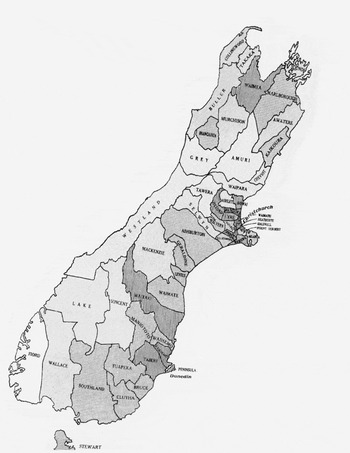
2. Then, we use information on boroughs and town districts localization to match them to their correct administrative county. This was done using a table (XXII) in the 1911 Census that presents boroughs according to the counties in which they were situated. The 118 geographical counties (GC) obtained are equal to their administrative county (AC) + boroughs (BO) (if present). These are shown in figures 5 (North Island) and 6 (South Island).
-
3. Next, for the most complicated step, we superimposed the reconstituted census map (with 118 districts) to the electoral map (with 68 districts).Footnote 29 Some census districts fitted perfectly with an electoral district, but most did not and had to be fractioned approximately based on shared areas. Moreover, in the case of the four main urban areas (Auckland, Wellington, Dunedin, and Christchurch), we looked at more detailed fine-printed 1911 historical maps to allocate as best as we could the numerous boroughs involved. Population data were used to verify the accuracy of the fit. Comparing the population of the constructed electoral districts with the real electoral districts, we find that the fit seems to be excellent. Out of a population of 1 million, only 7,000 people could not be allocated.
-
4. We finally compiled the data for our eight variables for the 68 constructed electoral districts by adding up numbers from each of their components.
Map of New Zealand Census districts: North Island.

Map of New Zealand Census districts: South Island.

To illustrate this matching process, take, for example, the electoral district of Bruce. By superimposing the census map on the electoral map, we find that this electoral district corresponds to the Bruce census district as well as approximately 50 percent of the Tuapeka census district. Moreover, the Bruce census district represents an administrative county, but also includes two boroughs, Kaitangata and Milton, whereas the Tuapeka census district includes three boroughs: Lawrence, Roxburgh, and Tapanui. Therefore, once numbers from the boroughs are added to the administrative counties, figures for the Bruce electoral district are obtained as the sum for the Bruce census district plus 50 percent of the numbers from Tuapeka. All the tables describing the application of this procedure are available upon request.
Census data are also available at the much more aggregated level of “provincial districts,” a legacy of the nineteenth-century short-lived experience of New Zealand as a federation. The first six provinces were created in 1852, four others were added from 1858 on, and all were abolished in 1876. After their abolition, the provincial districts remained in use for statistical purposes because the boundaries of the provinces remained the same thereafter.Footnote 30 In the period of our concern, there were nine of them. It is thus possible to match the 68 electoral districts into each province to take into account province-level explanatory variables in our regression analysis.
Another concern is that in the New Zealand political system, a Representation Commission redistributes the electoral districts systematically every five years (taking into account new census population data) to maintain their comparability in terms of population.Footnote 31 This means that the five referendums under study fall into three different electoral maps: the first three referendums (1911, 1914, and April 1919) were under the Redistribution of 1911, the referendum of December 1919 was under the Redistribution of 1918, and the next one in 1922 was under the Redistribution of 1922 (McRobie Reference McRobie1989). Almost all districts kept their original names but a significant number of them had different borders. To make things even worse, the redistribution was somehow endogenous to the liquor issue because in addition to numerical equality, the Representation Commission wished to avoid disturbing the balance between dry and wet licensing districts (which were identical to electoral districts).Footnote 32
Empirical Analysis
Likely because of these data limitations, there are almost no empirical investigations of the New Zealand referendums. Of course, a country with such a rich and, often almost incredible, history of alcohol policies has attracted the attention of a number of scholars, primarily historians. It started in 1959 with Bollinger's now classic, colourful, and hard-hitting book Grog's Own Country.Footnote 33 Two decades later, Grigg wrote a PhD thesis in history (1977; and articles 1981, 1983) on New Zealand's prohibition movement from 1894 to 1914. At about the same time, Newman (Reference Newman1975) published a historical analysis of the first national referendum of 1911. Another historian, Eldred-Grigg, devoted to alcohol a substantial part of his book (Reference Eldred-Grigg1984) on sins in colonial New Zealand.
More recently, in his PhD thesis in history (2006; and article 2008 on the 1919 referendum), Christoffel produced a comprehensive and thorough analysis of New Zealand alcohol restrictions over the entire period from 1881 to 2005. In addition to these historical studies, a few political science studies focused on New Zealand's prohibition history: Prince's (Reference Prince1996) article on the alcohol referendums from 1919 to 1987 and Atkinson's (Reference Atkinson2003) essay that addressed the issue of those referendums within the larger topic of the history of the vote in New Zealand.
However, using data obtained by our matching process as described in the previous section, we are able to provide a much more elaborate investigation of the New Zealand 1911 referendum. To do so, we use a multivariate linear regression framework in which the dependent variable is the proportion of the dry votes and the explanatory variables can be classified into four groups according to the main determinants of voting behavior identified in the fourth section.Footnote 34
These four groups are (1) religion as identified by the percentage of the population that identified with three main religious affiliations: the proportion of Anglicans, Catholics, and Evangelicals;Footnote 35 (2) gender as captured by the proportion of women; (3) urbanization as measured by the proportion of the population living in an urban area; and (4) ethnicity as measured by the proportion of foreign-born and of Maori living in the district.
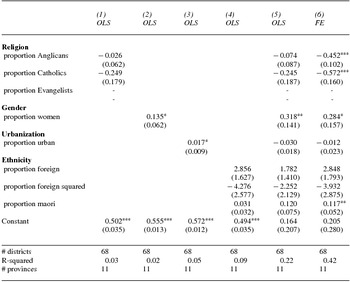
Our more detailed regression results for the 1911 Referendum are presented in table 5 and discussed in details in the following text. The first four columns present simple associations between the four groups of explanatory variables and the proportion of the Dry vote. Column 5 shows coefficient estimates of a multivariate regression in which all possible determinants are included simultaneously. Finally, column 6 (FE) shows the results from estimating the same regression with province fixed effects or provincial dichotomic variables. These province fixed effects capture any provincial influence on the vote that is constant across districts of the same province. These influences could be related to the economic or occupational structure of the province, for example.
Coefficient estimates of the determinants of dry vote—OLS and FE models

Robust standard errors in parentheses
* significant at 10%. ** significant at 5%. *** significant at 1%.
Religion and Prohibition
According to the literature on temperance and prohibition, the most important explanatory variable is the religious denomination of the district's constituents. Particularly interesting is the proportion of Evangelicals (i.e., Methodists, Presbyterians, Baptists, and Congregationalists), the group at the spearhead of the temperance movement.
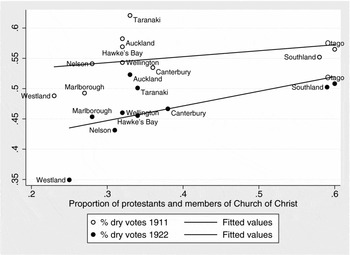
It is comforting to note that figure 7 shows evidence that New Zealand follows the same pattern as other countries with respect to the influence of Evangelical Protestantism and prohibition. Moreover, the relationship remains positive for both 1911 and 1922.
Gender provincial ratios and the Dry vote, 1911 and 1922 Referendums.

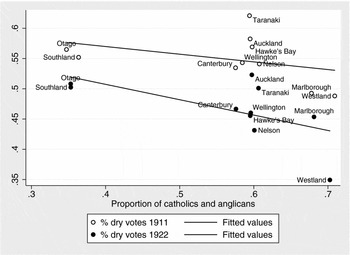
Similarly, in figure 8, we use the same data and show that provinces in which the proportion of Anglicans and Catholics are higher are less likely to support prohibition. Figures 7 and 8 show that religion played the expected role in explaining the proportion of Dry votes, although doubts remain about the strength of that influence.
Evangelical Protestants and the Dry vote, 1911 and 1922 Referendums.

Column 1 of table 5 shows that correlations between religion and the Dry votes using our matched data set come out as expected, although they are not statistically different from zero. As the proportion of Anglicans increase, the Dry vote becomes weaker. The coefficient for the proportion of Catholics is also negative and much stronger.Footnote 36 Partial correlations remain virtually identical in our multivariate regression framework (column 5) and stronger in addition to statistically significant once we take into account unobservable interprovincial differences.
Overall, these last results show a strong and sizeable association between religion and the strength of the Dry vote. Interpreted causally, this would mean, for example, that an increase of 10 percent in the proportion of Catholics would diminish the proportion of Dry votes by 5.7 percentage points.
Women and Prohibition
In the 1911 referendum, and in all general elections until 1954, the number of registered electors and recorded votes were reported by gender. It is not obvious why men and women's voting rates should have been recorded because it was not the case in most other countries. New Zealand data thus provide a good opportunity to investigate women's participation in the first national poll on prohibition.
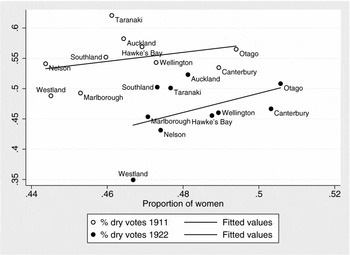
The conventional wisdom is that women tended to be much more prohibitionist than men, and the temperance cause has been linked by many authors to women's suffrage. In all New Zealand liquor referendums, women voted, but unfortunately we do not have much information in the official statistics. Using information on gender ratios at the provincial level available from the 1911 and 1921 censuses and matching it to results from the 1911 and 1922 referendums, figure 9 shows evidence of a weak relationship between the share of women in the province and the share of the Dry vote.Footnote 37 It also appears that the relationship between women and prohibition became steeper in 1922.
Catholics, Anglicans and the Dry vote, 1911 and 1922 Referendums.

We can investigate the relationship between women and the strength of the Dry vote further for the 1911 referendum for which we have detailed demographic data at the district level: for each district, we have information on the proportion of women among the total number of votes. Ideally, it would be better to have this information for eligible voters to have a greater understanding of the preferences of women. For example, the interpretation of this variable would be particularly difficult if there were constraints to voting participation or if abstentions varied according to preferences with respect to alcohol prohibition.
The coefficient from the second column (ordinary least squares [OLS]) is positive as expected (and as observed from the previous figure). The estimated association implies that increasing the share of female voters from 43 percent to 53 percent would raise the share of the Dry vote by 1.4 percentage points. However, many other factors, such as urbanization, ethnicity, and religion, also have an impact on the Dry vote. Once we take into account these other factors in a multivariate regression framework in column 5, the estimated impact of the proportion of women on the Dry vote triples and is even more significant. The estimated impact does not bulge once we take into account unobservable differences between provinces in column 6 (FE) by adding province fixed effects.
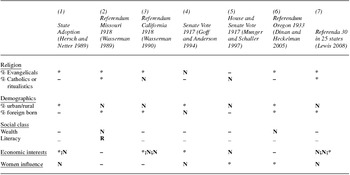
Overall, the regression results presented here offer new evidence that women did play a role in explaining the strength of the Dry movement in New Zealand. This is an interesting result as the availability of rather rare data on ballots by gender allows us to use a better proxy variable than in North American studies, which even had to use the year women obtained suffrage in a given state or the proportion of women in the population in a given district (see table 6).
Comparative results of empirical studies on alcohol prohibition

Urbanization
Similar to gender, information about urbanization is also available at the district level for the 1911 referendum. Following the North American literature on prohibition, we would expect to find a negative relationship between the proportion of the population living in an urban area and the strength of the Dry vote. To the contrary, column 3 of table 5 shows a weak positive association between the two variables. However, this correlation becomes nonstatistically significant once we take into account other determinants of voting behavior in columns 5 and 6. In sum, we find no statistical evidence that the degree of urbanization played a significant role in explaining voting behavior.
Population Heterogeneity
For reasons explained in the fourth section, we did not expect to find a strong association between the size of the immigrant population and voting behavior. In fact, all coefficients on the proportion of foreign-born in the population are nonstatistically different from zero in all specifications. Coefficient estimates imply that districts with more immigrants are more likely to vote dry, although the estimated impact decreases as the population of immigrant increase (because of the negative coefficient on the proportion of foreign squared).
However, as expected for reasons outlined in the fourth section, when we use the ratio of Maori to the white population in a given district, we do find some evidence in our last specification (column 6) that districts with a higher share of Maori are more likely to prefer the Dry option.
Comparison with the North American Literature
How do our results for New Zealand compare with those of North American studies with empirical results? Table 6 provides a summary of the results of the studies discussed in the first section, as well as those from three public choice studies by Goff and Anderson (Reference Goff and Anderson1994), Munger and Schaller (Reference Munger and Schaller1997), and Hersch and Netter (Reference Hersch and Netter1989). Among those three, the first two contrast the support for prohibition in 1917 (Congress votes) to the repeal in 1933, while the third is concerned with the timing of the adoption of statewide prohibition prior to 1919.
All of these studies include religious affiliation as an explanatory variable for voting behavior and the majority obtains statistically significant coefficients like ours. All studies also include urbanization with mixed results: in about half, it was statistically significant; in the other half, it was not. In contrast to our result for New Zealand, most of the studies estimate negative and statistically significant impacts of the proportion of foreign-born. This divergence can probably be explained by the high degree of homogeneity of the immigrant population in New Zealand. Six studies include some measure of the influence of women. Only two obtained statistically significant results similar to ours, but as we pointed out, our data allow us to better capture the real role of women.
With respect to economic interests, many studies (seven) use different variables to capture the importance of the alcohol industry. These include the value of output of beer, spirits, or wine or the number of breweries and/or retailers. In New Zealand at that time, beer was by far the main alcohol domestically produced (as shown in table 4). There is data on some characteristics of the industry: number of establishments, value and volume of output, wages, cost of capital, and so forth. Unfortunately, these were only published at the provincial district level in the census of 1911 (not of 1921).
Finally, some studies incorporate wealth and/or literacy to test the hypothesis that upper social classes would try to impose prohibition on lower classes. Results for these two proxy variables were generally not statistically significant. We did not consider including them in our analysis because in New Zealand, there was virtually no variance in literacy between the districts and no disaggregated data for wealth.
Conclusion
Direct democracy was a fundamental feature of the Progressive Era in the United States. It was then perceived as a tool for returning power to the people. The prohibitionist movement was a keen supporter of direct democracy, as it was perceived as the best political weapon to fight the liquor interests. This article shows that the same can be said of New Zealand. Not only were the prohibitionists pushing for direct democracy but so was the government. Prime Minister Seddon and, later on, Prime Minister Ward wished to get that “hot potato” issue out of the parliamentary arena.
However, prohibitionists were not as successful in New Zealand as in the United States, although they came extremely close to victory in the 1910s in three separate referendums. If the majority threshold had been 50 percent instead of 60 percent in 1911, New Zealand would have been the first in the world to adopt a nationwide prohibition of the production, sale, and importation of alcohol, eight years before the United States. This may not be surprising because the two countries, despite being far away from each other geographically, shared many sociocultural features:Footnote 38 largely Anglo-Saxon and Protestant with a strong women's movement.
Despite some serious data limitations, the results presented provide some support for two of the most important variables in the literature on prohibition: women and religion. The conventional wisdom is that women tended to be much more prohibitionist than men. We present new evidence that women did play a role in explaining the strength of the dry movement in New Zealand. We also find, for both the 1911 and 1922 referendums, that New Zealand followed the same pattern as other countries with respect to the positive relationship between Evangelical Protestantism and prohibition.
Acknowledgments
We would like to thank Pierre-Luc Dallaire for research assistance, Daniel St-Laurent for map infographics, and participants at the CEA-CNEH conference as well as two referees for comments. The authors also acknowledge financial support from HEC Montréal. The typical caveats apply.