1. Introduction
Legislators' responsiveness to voters is the central tenet of democratic governance. Elections provide voters with the opportunity to bend public policy to their favor, and in turn incentivize legislators to be responsive to voter needs. Assessing the extent to which elections constrain legislators has been a core focus of political science research. Although electoral considerations are widely considered crucial for legislators' constituency work (Mayhew, Reference Mayhew1974; Cain et al., Reference Cain, Ferejohn and Fiorina1984; Ashworth and Mesquita, Reference Ashworth and de Mesquita2006), empirical studies have produced mixed results. One body of work suggests that legislator responsiveness is primarily driven by extrinsic motivations based on electoral considerations, while another body of work points out that responsiveness of legislators may be largely driven by intrinsic motivations based on an internal desire to connect to voters or a sense of duty (e.g., for a useful overview of the recent empirical literature see, Grose, Reference Grose2014). Extrinsic motivation generally refers to a tendency of individuals to perform activities based on the anticipation of external rewards, while intrinsic motivation refers to behavior that is driven by an internal desire to act rather than for some separable consequence (Deci and Ryan, Reference Deci and Ryan2000).
The debate about which motivations drive responsiveness to constituency service requests has made a revival in recent years as researchers started conducting field experiments in which simple voters messages were sent to legislators via email or letters (Butler, Reference Butler2014; Grose, Reference Grose2014). This experimental work stresses that both types of motivations are important for understanding variation in constituency effort (Butler and Broockman, Reference Butler and Broockman2011; Dropp and Peskowitz, Reference Dropp and Peskowitz2012; Broockman, Reference Broockman2013). Yet, it leaves one important element unaddressed, namely how do intrinsic and extrinsic motivations interact? Social psychologists (e.g., Deci, Reference Deci1975; Wilson et al., Reference Wilson, Hull and Johnson1981) and behavioral economists (e.g., Frey and Oberholzer-Gee, Reference Frey and Oberholzer-Gee1997; Fehr and Falk, Reference Fehr and Falk1999; Gneezy and Rustichini, Reference Gneezy and Rustichini2000) have demonstrated important ways in which extrinsic and intrinsic motivations interact and in conjunction affect human behavior (for a critique see, Beretti et al., Reference Beretti, Figuiares and Grolleau2013). Specifically, these studies show that extrinsic motivations “crowd out” intrinsic motivations. The reasoning is that the presence of external rewards shifts the justification for an action from an internal desire to perform to an external one. This is something that behavioral economists call the crowding out effect (Frey and Oberholzer-Gee, Reference Frey and Oberholzer-Gee1997), and social psychologists refer to it as the overjustification effect (Leppner et al., Reference Leppner, Greene and Nisbett1973). By presenting evidence from a field experiment with candidates for the 2015 election of the Swiss legislature, we examine how the interaction of extrinsic and intrinsic motivations affects constituency work.
To capture the importance of intrinsic and extrinsic motivations and explore the possibility of a crowing out effect, we compare the response rates to service requests from voters who reside within the candidate's district, in the Swiss context in-canton voters, to those outside the district, out-canton voters. The response rate to voters residing within the candidate's district (out-canton voters) captures intrinsic motivations for constituency service as these voters cannot affect the legislators' election prospects. To examine the crowding out of intrinsic motivations by extrinsic ones, we explore how the response rate to voters residing outside a candidate's district (out-canton voters) changes with the degree of electoral safety. If crowding out exists, we should find that candidates whose seats are less secure are less likely to respond to messages of voters residing outside their district (out-canon voters) compared to candidates who are more electorally safe. Less electorally safe legislators need to fight for every vote and will concentrate their efforts on service requests from voters residing within their district (in-canton voters) as only those can affect their (re-)election. While we can randomly assign the source of constituency service requests, in-canton versus out-canton voters, we cannot randomly assign electoral safety. In order to overcome this problem, we examine a variety of different operationalizations of electoral safety. All these measures yield the same result: as electoral safety decreases, response to voters who reside within a candidate's district (in-canton voters) increases at the expense of those residing outside (out-canton voters). This finding is consistent with the notion that extrinsic motivations can crowd out intrinsic motivations for constituency work.
Overall, the evidence presented suggests that the response rate among Swiss candidates to voters' service requests is considerable (66 percent), and remains considerable even for voters residing outside a candidate's district (out-canton voters) (59 percent). Yet, we do find significant variation in response rates based on electoral safety. As the electoral safety of a seat decreases, candidates are more likely to respond to service requests of voters who reside in their own district and can affect the election outcome (in-canton voters). This latter finding is especially interesting as it extends current work on how intrinsic and extrinsic motivations might interact to affect human behavior from the domains of economics and psychology to the context of legislative behavior (see also Grimmer, Reference Grimmer2013). While political scientists often assume that electoral competition is good for democracy as it allows voters to incentivize legislators to act in accordance with their interests (e.g., Downs, Reference Downs1957; Pitkin, Reference Pitkin1967; Dahl, Reference Dahl1971; Manin et al., Reference Manin, Przeworski, Stokes, Przeworski, Stokes and Manin1999), our evidence provides a rather mixed assessment. Although we find that electoral incentives raise the overall levels of constituency effort legislators engage in, they also lead to more skewed responses. This suggests that the relationship between electoral competition and responsiveness might not always be as straightforward as we might expect.
Our study also allows for some important comparative insights. First, most recent field experimental evidence stems from the US context characterized by a personalized ballot structure and campaign content (for an overview see, Grose, Reference Grose2014), an environment that makes constituency service crucially important for securing re-election. This case selection could bias evidence in favor of extrinsic motivations. An exploration of the Swiss case helps us to explore if existing findings are applicable in a wider comparative context. Moreover, Switzerland is an interesting case as it is one of the relatively rare systems that allows for intra-party competition. It provides citizens with the possibility of changing the ordering of candidate lists. Our Swiss evidence suggests that many of the existing findings from the US context might travel to a wider setting of (European) political systems characterized by less professionalized and more party-based competition.
We proceed as follows. First, we elaborate our theoretical framework and expectations. Next, we present our research design, ethical considerations and data. Finally, we present our results and discuss their implications for the study of constituency service more generally.
2. Theoretical framework
Responding to constituency serviceFootnote 1 requests is one way in which legislators can be responsive to the preferences of ordinary voters. Yet, the time constraints for constituency work can be substantial (Butler, Reference Butler2014), especially in systems other than the US and UK in which legislators often lack staffers and cannot rely on volunteers. Why do legislators engage in constituency work even when they may have little time and resources to do so? The literature thus far has provided two competing answers. One strand of the literature suggests that electoral incentives are crucial (Mayhew, Reference Mayhew1974; Cain et al., Reference Cain, Ferejohn and Fiorina1984; Ashworth and Mesquita, Reference Ashworth and de Mesquita2006). Responding to voter queries is one of the easiest ways for legislators to connect to voters and cultivate a personal vote. In their classical study on the US and the UK, Cain and colleagues (Reference Cain, Ferejohn and Fiorina1987: 213–4) for example suggest that legislator responsiveness is primarily driven by electoral incentives, especially in marginal districts. Echoing this conclusion, recent experimental work from the Texas state legislature suggests that electoral incentives affect legislators' provision of legislative public goods and increases the number of bills legislators author (Dropp and Peskowitz, Reference Dropp and Peskowitz2012).
This explanation is challenged by authors who suggest that although electoral incentives surely exist, constituency work is more likely to be driven by the internal motivations of legislators, such as a sense of duty or an inner satisfaction. Studies of representation have demonstrated that legislators' beliefs and role perceptions are important for understanding their legislative activities (Searing, Reference Searing1985a,Reference Searingb; Norris, Reference Norris1997). Recently, authors have argued that responding to constituency service requests is a powerful tool through which legislators can express group norms (Butler and Broockman, Reference Butler and Broockman2011; Broockman, Reference Broockman2013). In his study of black legislators in the US, Broockman (Reference Broockman2013) for example finds that they are likely to respond to black constituents even if the electoral incentives to do so are limited. In line with theories of descriptive representation, this work suggests that legislators act in accordance to group norms and beliefs by demonstrating certain group loyalties through their activities.
These two sets of explanations reflect the core motivations, intrinsic and extrinsic, that drive human behavior more generally as defined by social psychologists and behavioral economists (e.g., Deci and Ryan, Reference Deci and Ryan2000; Benabou and Tirole, Reference Benabou and Tirole2003). Activities based on extrinsic motivations are based on instrumental considerations and the prospect of external rewards or punishments. It is a force to act in order to attain some separable outcome (Deci and Ryan, Reference Deci and Ryan2000). Intrinsic motivations signify behaviors driven by internal rewards, such as an innate desire to fulfill psychological needs or a desire for relatedness. An intrinsic motivation to engage in an activity originates from inside the individual in order to enhance personal satisfaction or fulfillment (e.g., White, Reference White1959; Deci and Ryan, Reference Deci and Ryan2000). Applying this distinction to the activities of legislators, we expect constituency effort to be primarily driven by extrinsic motivations when legislators respond to enhance their chances of (re-)election (Mayhew, Reference Mayhew1974; Cain et al., Reference Cain, Ferejohn and Fiorina1984; Ashworth and Mesquita, Reference Ashworth and de Mesquita2006), while responding to voter messages due to intrinsic motivations is mostly based on a desire to comply with internal norms about how a legislator is supposed to act or with the aim of achieving some degree of job satisfaction (Searing, Reference Searing1985a,Reference Searingb; Norris, Reference Norris1997). Surely, in practice, these motivations need not be mutually exclusive. Yet, aiming to understand which type dominates is important as it gives us a sense of the role that electoral competition plays in constituency work and thus may inform scholarly and public debate on institutional reform.
Motivations for behavior are difficult to measure empirically. Recent experimental workFootnote 2 from the US context aims to capture the contrast between extrinsic and intrinsic motivations by examining response rates of black legislators to service requests from black voters residing inside and outside a legislator's district (Broockman, Reference Broockman2013). The idea here is that if a legislator is equally responsive to voter messages from voters residing within her/his district compared to those from outside, the behavior of the legislator is likely intrinsically motivated as only in-district voters can affect her/his (re-)election prospects. We follow this approach and compare response rates to service requests from voters residing inside a candidate's district (in-canton voters) to those residing outside the candidate's district (out-canton voters). Intrinsic motivations for constituency efforts are captured by the response to requests of to voters residing outside a candidate's district (out-canton voters) as these voters cannot affect the election outcome, while extrinsic motivations are measured through the response rate to service requests of voters residing within the candidate's district (in-canton voters).
Our study goes beyond existing work to examine how extrinsic and intrinsic motivations interact. Social psychologists (e.g., Deci, Reference Deci1975; Wilson et al., Reference Wilson, Hull and Johnson1981) and behavioral economists (e.g., Frey and Oberholzer-Gee, Reference Frey and Oberholzer-Gee1997; Fehr and Falk, Reference Fehr and Falk1999; Gneezy and Rustichini, Reference Gneezy and Rustichini2000) have demonstrated important ways in which different types of motivations might affect each other. Specifically, they demonstrate that extrinsic motivations “crowd out” intrinsic motivations. The presence of external rewards is argued to shift the justification for an action from an internal desire to perform to an external one. This is referred to as the overjustification effect in social psychology (Leppner et al., Reference Leppner, Greene and Nisbett1973) or the crowding out effect in behavioral economics (Frey and Oberholzer-Gee, Reference Frey and Oberholzer-Gee1997). A substantial body of experimental evidence suggests that the presence of external rewards or punishments can sometimes be in conflict with intrinsic motivation (for a more critical perspective see, Beretti et al., Reference Beretti, Figuiares and Grolleau2013).
We examine the interaction between intrinsic and extrinsic motivations, specifically, we expect that candidates' intrinsic motivations to respond to voter messages to decrease as the extrinsic motivations to do so increase. We test this expectation by examing how response rates to voters who live outside a candidate's district, here out-canton voters, change when electoral competition intensifies. A burgeoning theoretical and empirical literature demonstrates that electoral safety affects constituency service (e.g., Mayhew, Reference Mayhew1974; Fiorina, Reference Fiorina1977; Cain et al., Reference Cain, Ferejohn and Fiorina1984; Heitshusen et al., Reference Heitshusen, Young and Wood2005; Ashworth and Mesquita, Reference Ashworth and de Mesquita2006; Dropp and Peskowitz, Reference Dropp and Peskowitz2012). The argument is that (re-)election is a necessary condition for achieving any other legislative goal. The uncertainty about (re-)election prospects forces legislators to allocate at least some of their time and resources to constituency efforts in the expectation that this will help them to secure enough votes. When the marginality of the seat increases, we expect these efforts to be more intense. Proportional electoral systems with open-lists, like the Swiss case examined here, offer incentives to cultivate a personal vote (Carey and Shugart, Reference Carey and Shugart1995). Intra-party competition is key as a high list placement is one of the most decisive factors for (re-)election. Candidates thus want to distinguish themselves from party peers in order to secure (re-)election. We explore the possible crowding out of intrinsic motivations due to the presence of extrinsic motivations by examining response rates to voters who live outside a candidate's district (out-canton voters) among candidates who are electorally safe (placed higher on the party list) to those of candidates who are less electorally safe (placed lower on the party list). When our intuitions are correct, we should find that as electoral safety decreases, the response rate to voters who reside outside a candidate's district (out-canton voters) should decrease, while response rate to voters inside a candidate's district (in-canton voters) should increase. A candidate who has a lower position on a party list, and less certain that she/he will get (re-)elected, is expected to fight for every vote that can aid her/his (re-)election. By consequence then, the time and effort she/he will spend on constituency work will be geared towards those voters that can actually make an electoral difference, i.e. voters inside her/his district (in-canton voters). The strategic incentives to respond to voters outside her/his district (out-canton voters), who cannot affect her/his (re-)election, should be significantly lower.
3. Experimental set-up
In order to examine our crowding out hypothesis, we conducted a field experiment with candidates in the elections for the Swiss legislature in 2015 who were contacted by Swiss voters with a short, easy request. We gathered the email addresses of candidates from the five largest parties for the 2015 election via internet searches in order to mimic the search activities of ordinary citizens. We recruited volunteers to send emails to these current and prospective members of the Swiss Parliament (MPs and candidates) asking them about information about regulations concerning lobbying.
We chose “lobbying” as the topic of the constituency emails for several reasons. First, it is a timely topic in Swiss politics that also geared up considerable media attention during the campaign. Starting with the so-called “Markwalder affair” in spring 2015 in which the efforts to influence Swiss parliamentarians by the regime of President Nursultan Nazarbayev of Kazakhstan were uncovered, Swiss media devoted considerable time to reporting about the topic and making lobby-data accessible to ordinary citizens. Second, the topic is not covered by any other source, e.g. it is not covered by the Voting Advice Application (VAA) device for Switzerland. So, if citizens want to know something about a candidate's stance on the topic, they have to contact the candidate personally. Third, the topic is not structured along party lines in Switzerland as there are MPs and candidates fighting for tighter regulation and against any transparency in lobbying on both sides of the aisle.
Our sample comprises all candidates from the five largest parties running in the elections for the Swiss legislature in 2015. Since we are interested in the effects of electoral competition, we cannot limit our sample to incumbent MPs only. Unlike the US context characterized by a clear incumbency advantage, the turnover rate in the Swiss parliament is quite substantial, namely one third. This means that new candidates have a realistic chance of making it to parliament. For these reasons, we include candidates from the five largest parties in Switzerland that field candidates in all cantons. This gives us about 1,000 potential subjectsFootnote 3 and provides us with the statistical power necessary to examine our expectations. Importantly, our robustness checks show that all results presented in the next section hold when we control for incumbency status or exclude all incumbents from the analysis (see Tables A10, A11, and Figures A8, A9 in the Appendix).
In order to avoid the deception accompanied by the use of fake email aliases, we have recruited 86 participants from 19 cantonsFootnote 4 who were eligible to vote in the 2015 Swiss elections and asked them to send emails in their own name and native language to randomly selected candidates.Footnote 5 Mostly these were French or German speakingFootnote 6 university students who were informed about all the details of the experiment and consented to participate. In return they received 10 Swiss Francs. The experiment was conducted between the 2 and 4 October 2015, about three weeks before the election.
Participants sent copies of their correspondence to the project email address and forwarded any reply they received from a candidate. In addition, they were free to communicate further via email (or otherwise) with the candidate they contacted but were asked not to disclose the fact that the initial email was part of an experiment. If they had not heard back from the candidate by Election Day, they sent an email stating that “the candidate has not responded” to the project email address. In accordance with existing practice, we do not count automatic replies as answers (e.g., Butler, Reference Butler2014). When a candidate first sent an automatic reply, but later provided a substantive response, we counted the second response as the response.
An issue might be that the answers come from the staff rather than the candidate herself/himself. This issue is not very relevant in the Swiss case as electoral campaigns are not very professionalized and candidates usually do not employ any staff. According to the official Swiss Election Study candidate survey from 2015 only 10 percent of candidates report to employ staff (SELECTS, 2016). Most MPs do not rely on staff to aid with their work. We did check all answers manually and did not find any answers sent by assistants or staff.
We operationalize intrinsic and extrinsic motivations by varying the origin of the sender. We randomly allocated candidates to receive either an email of a voter living in the same electoral district, i.e. an in-canton voter, or a voter living outside, i.e. an out-canton voter, who is not eligible to vote for the candidate (see also Broockman, Reference Broockman2013).Footnote 7 The residential municipality of the sender was mentioned in the opening statement of the email.Footnote 8 We also varied whether the email mentioned that the sender voted for the same or a different party in the last elections. Switzerland employs an open-list proportional electoral system, personal votes can also come either from your own list by the cumulation of a candidate's name or from other lists, so-called “panachage votes” (Selb and Lutz, Reference Selb and Lutz2015). As a consequence, both treatment conditions, in- or out-party, tap into extrinsic motivations as both in-party and out-party voters can be very beneficial for cultivating personal vote. Hence, we expect to find no significant differences between these treatments.
The text of the email is presented in the box below, the elements that were manipulated are shown in brackets.
Dear [candidate name]
My name is [name of voter] and I live in [municipality of voter]. There are elections coming up and I am making up my mind whom to vote for. Last time, I voted [did not vote] for your party.
Different topics cross my mind but I particularly care about lobbying. Related to this topic, I have a question for you. The answer will be important for my decision whom to vote for. Are you in favor of tighter regulation regarding lobbying in the National Council?
Thank you very much in advance
[Name of voter]
In order to test our expectation that extrinsic motivation crowd out intrinsic ones, we explore heterogenous treatment effects based on the electoral safety of an individual candidate. Unfortunately, we cannot randomly assign electoral safety. We aim to measure it by relying on observational measures that we interact with our treatment.Footnote 9 We employ two different measures. Although neither one is ideal in and off itself, by cross-validating them we aim to increase the confidence in our results. Our first measure Electoral Safety is based on a comparison of individual election results while the second captures individual list places. Electoral safety compares a candidate's election result, i.e. the number of votes receivedFootnote 10, to the result of the candidate elected with the least amount of votes on the same list. We use the following formula to construct an electoral safety index: safety = 100/voteselec × votescand, where voteselec is the number of votes of the candidate elected with the least votes. votescand is the number of votes the candidate of interest obtained. This index takes a value >100 if the candidate is elected with a better result than another elected candidate on the same list. It is lower than 100 if the candidate does not win a seat (gets less votes than the candidate elected with the least amount of votes), and it is exactly 100 if the candidate is the candidate elected with the least votes. In theory, electoral safety would be 0 if a candidate does not receive a single vote. Empirically, the lowest score we observe is 2.3.Footnote 11 Since only 16 percent of the subjects in our dataset obtained a seat in the parliament, most candidates obtain a value lower than 100. The average electoral safety is 60 and the maximum score is 185 (see density plot A2). We also explored a non-linear relationship between electoral safety and response rates as one could argue that response rates are highest closest to the electoral threshold. We find some weak evidence supporting this idea, see Appendix A8.
We use a second measure as there might be a concern that the first one measures electoral safety after the election and could potentially capture other elements such as the performance of the other candidates on the same list or special events (e.g., gaffes or favorable news coverage). Our second measure Ballot Position is based on the positions of candidates on the party list on the ballot, the idea being that higher positions on the ballot are more electorally safe than lower ones. Since this will also depend on district magnitude, we divide ballot position by the number of seats in each canton and standardize our measure so it can take values between 0 (bad ballot position) and 1 (good ballot position). Please note that not all lists in Switzerland are non-alphabetical, so this measure is inferior to the electoral safety variable discussed above in terms of sample coverage.
4. Ethical considerations
Field experiments with legislators raise several ethical concerns that are important to consider. First, field experiments should ideally avoid deception. Recent scholarship has raised concerns about deliberately deceiving public officials (Butler et al., Reference Butler, Karpowitz and Pope2012). We share this concern and rely on real voters who use their own name and residence as well as send emails from their own mail accounts for our experiment rather than aliases. These voters participated on a voluntary basis and their participation was incentivized (they received 10 Swiss Francs). Second, the experiment was designed to place only a minimal burden on legislator's time. The service requests sent by email were short and asked information about a specific topic that had featured widely in the news. Providing an answer should be fairly straightforward for a candidate. Third, to minimize any harm to subjects included in this study, we refrain from referring to any particular candidate. The replication data does not include information that could reveal the identity of single candidates. Such a precaution is particularly relevant in the context of field experiments with public officials as it reduces potential costs for future researchers. Finally, we obtained ethical approval for our experiment from the University of Geneva (School of Social Sciences ethical approval committee).
5. Data
The Swiss political system is in many ways comparable to the institutional setting of the US. There are two parliamentary chambers at the federal level, the Nationalrat which is the equivalent to the US House of Representatives and the Ständerat which is the Swiss counterpart of the US Senate. The 200 members of the Nationalrat are elected according to a proportional electoral system with preferential voting options.Footnote 12 The Members of Parliament are elected in electoral districts which correspond to the Swiss cantons. The number of seats per canton is proportional to the number of voters, with a minimum of one seat per canton. Consequently, MPs are only accountable to the voters of their electoral district, i.e. their canton of origin. Elections are called every four years and no options for earlier election dates exist.
Currently, 10 parties are represented in the lower Chamber of parliament. We contacted candidates from the five largest Swiss parties representing over 80 percentFootnote 13 of the vote, namely the Swiss People's Party (SVP), the Social Democratic Party (SP), the Liberals (FDP), the Christian Democratic Party (CVP), and the Green Party (GPS). Except for the Green party, they competed in all electoral districts.Footnote 14 Moreover, the parties represent different political ideologies ranging from the left (SP, GPS) to the right (SVP). The FDP and the CVP are center parties.
Based on these criteria we compiled a list with 1,018 potential subjects for our experiment. A total of 268 of the potential candidates were not contacted due to volunteers that dropped out of the study. In 13 cases we received mail delivery errors. In 77 cases we were not able to find an email address or an online contact form.Footnote 15 This leaves us with a total number of 660 contacted candidates.Footnote 16 An overview of the social and political characteristics is provided in Appendix A2.
To assess the integrity of the randomization process, we performed a series of balance checks (Appendix A1). The aim of these is to demonstrate that the correlation between the covariates and the assigned treatment (in-canton/out-canton) is not greater than what we would expect based on chance. We do not find that the mean values of the covariates differ systematically between the two groups. Furthermore, we cannot predict the assignment to the treatment based on the covariates.Footnote 17 Finally, we simulate a large number (5,000) of random treatments and run logistic regressions with the usual set of input variables. The collection of the log likelihood statistics of these models represents the sampling distribution under the assumption that the assigned treatment is perfectly balanced. By locating the log likelihood statistic of the model predicting our actual treatment in this distribution, we can then test if the imbalance in our treatment is larger than we would expect based on chance (see Gerber and Green, Reference Gerber and Green2012, 108). This is not the case. In sum, these tests increase our confidence that the assignment to the treatment is indeed balanced.
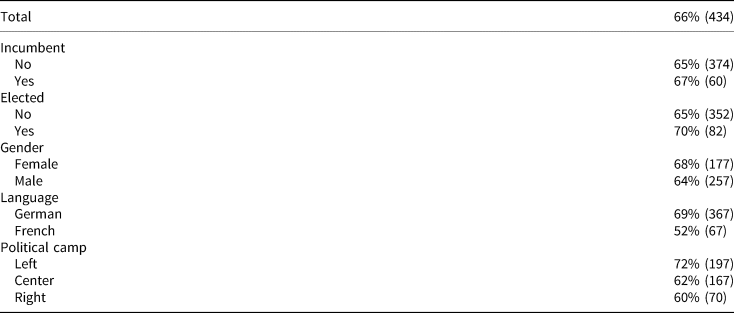
Next, we provide some information on the data structure and the descriptives. Table 1 gives a first overview of the results. The overall response rate was rather high with 66 percent.Footnote 18 Even when we consider incumbents only (as most previous studies do), the response rate remains high (66 percent), and exceeds the rates found in many US studies (Costa, Reference Costa2017). One reason for this high level of responsiveness could be the electoral campaign context that makes candidates especially responsive or the specificities of Swiss political culture.Footnote 19 The political culture in Switzerland, characterized by frequent use of direct democracy for example, could be favorable towards maintaining close linkages to constituencies and influence the role perception of Swiss politicians (e.g., Searing, Reference Searing1985b). Women respond slightly more often to constituency requests as did German-speaking politicians. When it comes to political ideology, we see a tendency for leftist politicians to answer more frequently.
Response rate

Note: N in parentheses.
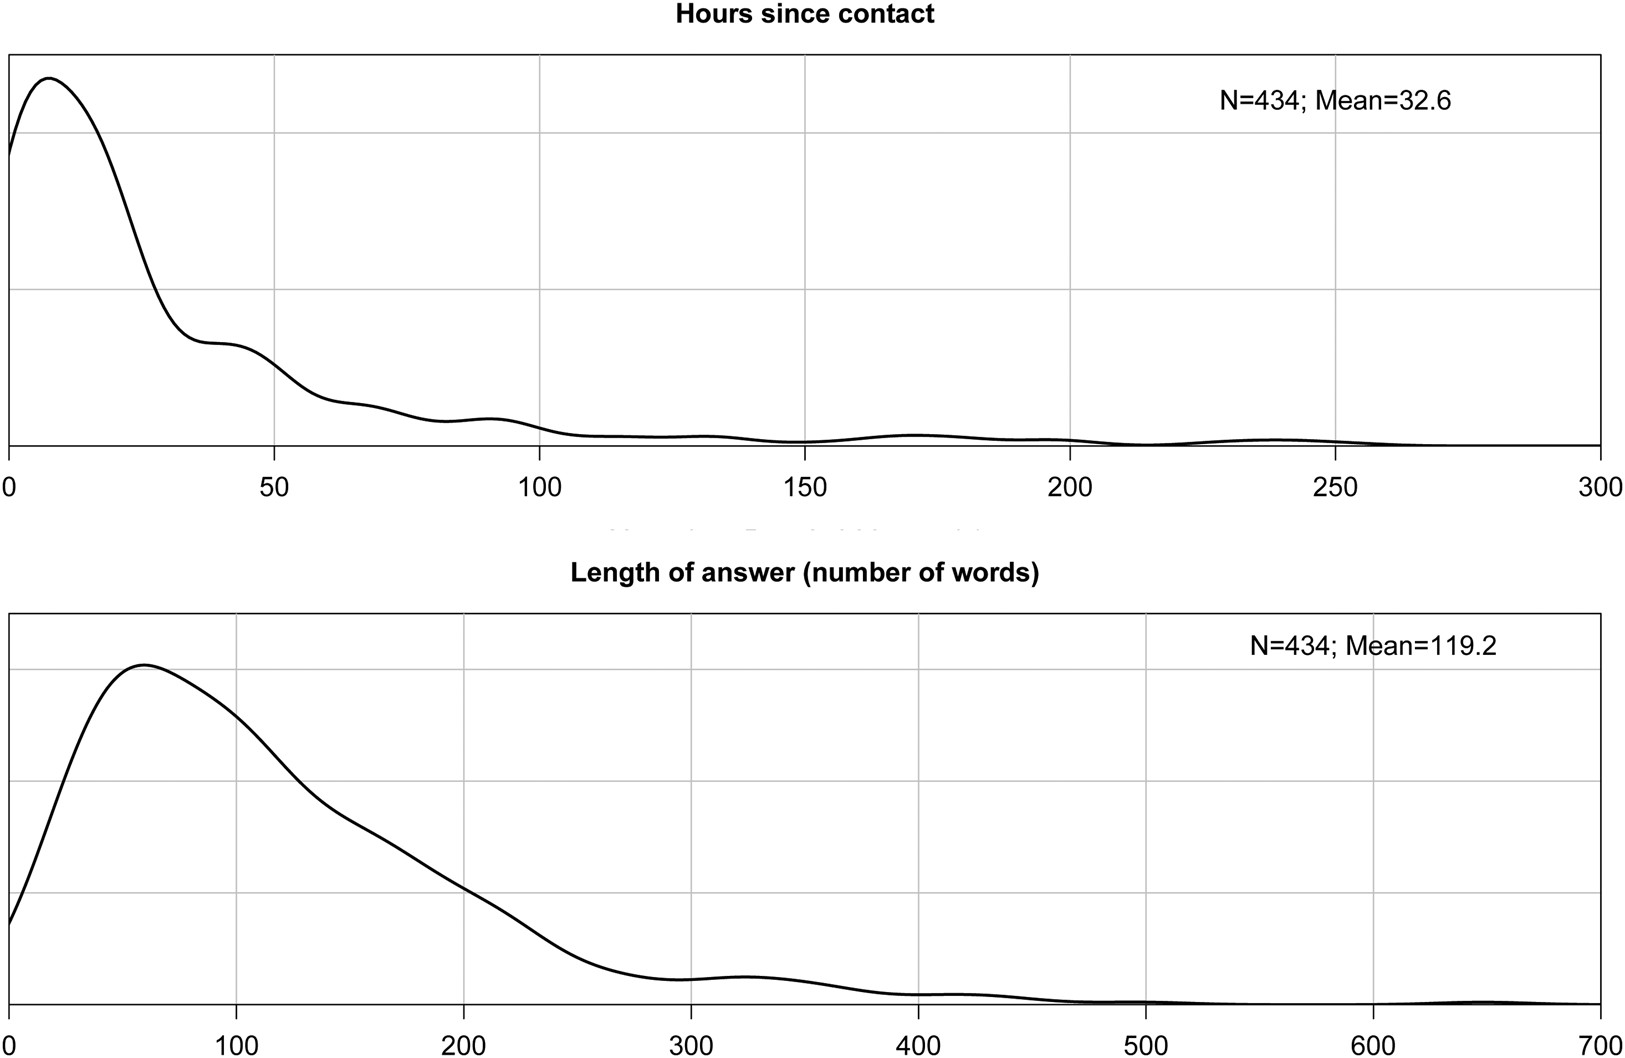
Lastly, we looked into the answers in more detail. Figure 1 depicts how long it took for candidates to respond (top panel). While half of all answers were sent within 15 hours, few respondents replied only after two weeks (maximum 451 hours). A look into the length of the answers is also interesting and visualized in the bottom panel in Figure 1. About 10 percent of the responses that were <32 words long, which is barely more than a single line answer, while some politicians wrote very long responses of 300 words and more. This is equivalent to nearly one page of text.
Kernel density distribution of answering time and length of answer.

6. Empirical model
Our outcome variable indicates if the candidate answered a voter's request or not. In order to approximate this binary variable, we estimate logistic regression models where candidates (i, for i = 1, …, I) are nested in their electoral district (j, for j = 1, …, 22). The basic model is specified as follows:
 $$ {\rm Pr}(y_{i}=1) = {\rm logit}^{-1}(\beta_{0} + \beta_{1} {\rm canton}_{i} + \mu_{\,j[i]}) $$
Where a candidate's responsiveness is a function of the cantonal treatment variable. cantoni is 0 if the request was sent from a voter living outside of the candidate's electoral district and takes the value 1 if the voter and the candidate live in the same district. β0 is the global average for the candidate to answer to the email. μj[i] covers the differences between the 22 random interceptsFootnote 20 and the fixed global estimate β0.Footnote 21
The full model is specified as follows:
 $$ {\rm Pr}(y_{i}=1) = {\rm logit}^{-1}(\beta_0 + \beta_{1} {\rm canton}_{i} + \beta_{2} {\rm safety}_{i} + \beta_{3} {\rm canton}_{i} \times {\rm safety}_{i} + {\bi \gamma}{\bf X_i^T} + \mu_{\,j[i]}) $$
Where we introduce electoral safety (safetyi) and an interaction term between electoral safety and the in-/out-canton treatment (cantoni × safetyi).
A balanced sample generates unbiased estimates of the treatment effect (Gerber and Green, Reference Gerber and Green2012, 95). Nevertheless, we introduce age, sex, party affiliation, the party treatment, and residence of the candidate to the equation (summarized by  ${\bf X_i^T}$).Footnote 22 This covariate adjustment effectively reduces disturbance variability and yields a more precise estimate of the treatment effect (Gerber and Green, Reference Gerber and Green2012, 104). Due to the non-linearity of the logistic curve, regression coefficients are hard to grasp. We thus rely on predicted probabilities and differences between predicted probabilities (first differences). In order to estimate these values, we apply a simulation-based approach (King et al., Reference King, Tomz and Wittenberg2000).
7. Results
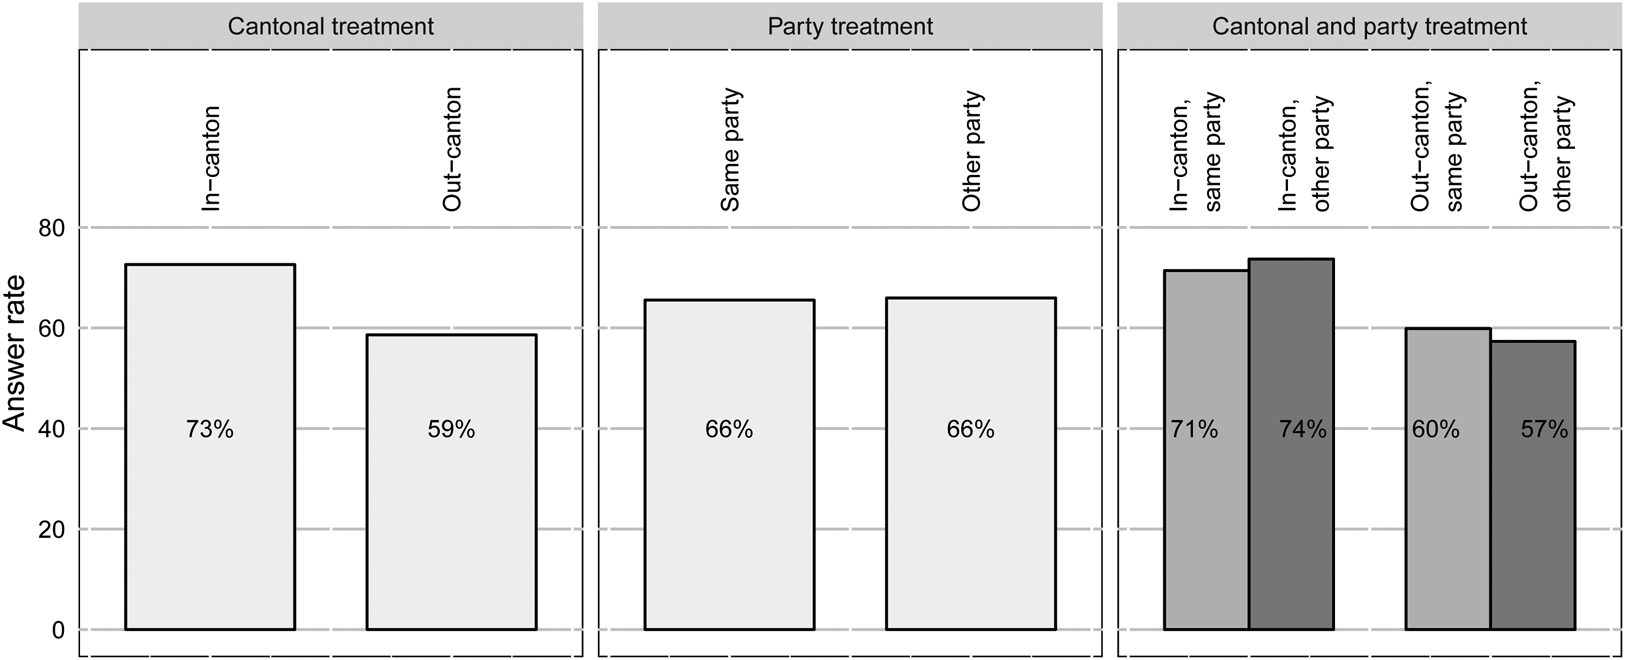
We begin by inspecting the response rates of the four treatment groups in Figure 2. The descriptive analysis yields two interesting observations. First, the response rates to voters residing within the candidate's district (in-canton voters) are higher than those for voters residing outside the candidate's district (out-canton voters), but the response rates for out-canton voters is high across treatments. This suggests that a considerable number of candidates are intrinsically motivated. Given the higher rates of response to voters from a candidate's own district (in-canton voters), extrinsic motivations also seem important. This replicates existing findings from the US context (Grose, Reference Grose2014). Second, responsiveness does not seem to vary with a voter's past election behavior. We find little difference in the response rates to service requests of those who indicate that they have previously voted for the candidate's party or those that state that they voted for another party, both for in- and out-canton voters.
Treatments and response rates.

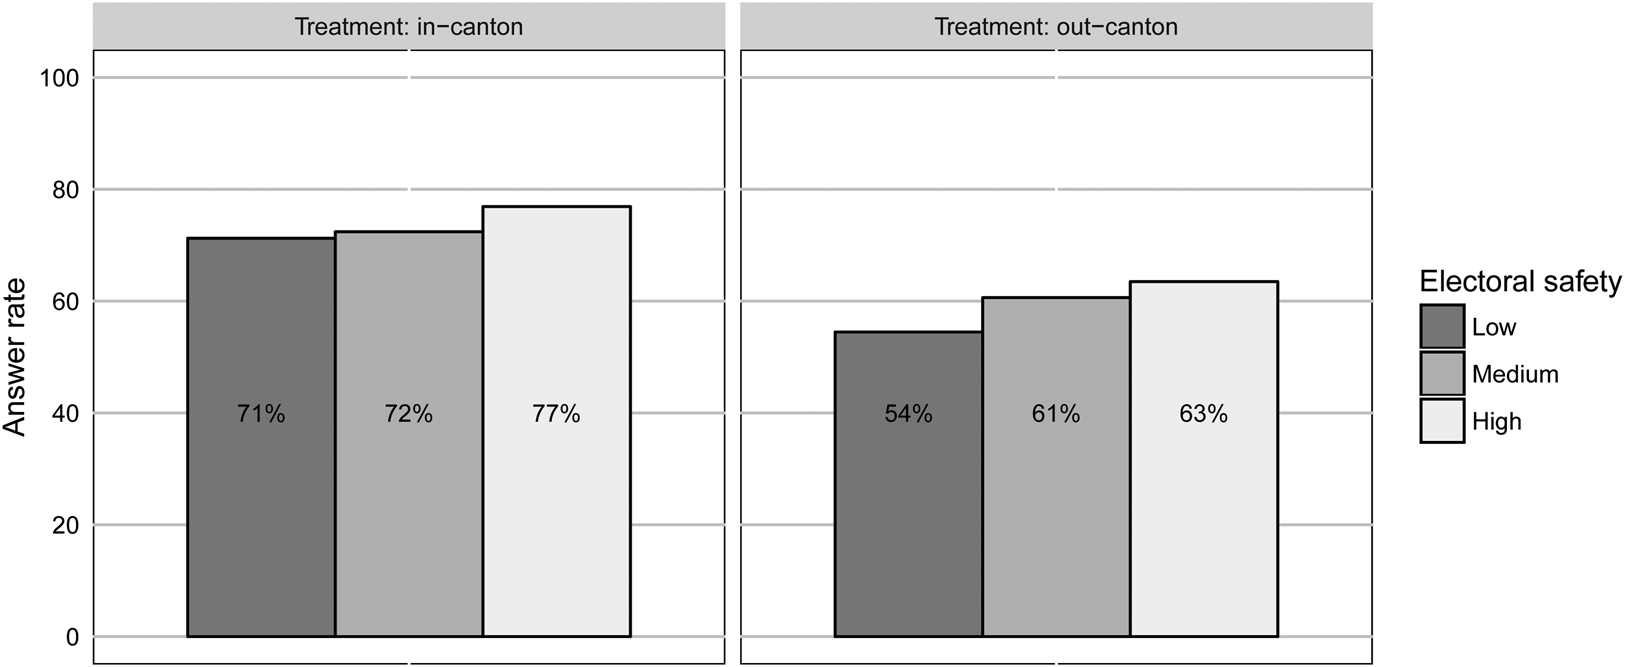
Figure 3 shows the response rates for in- and out-canton voters by electoral safety. In this Figure, we regrouped electoral safety into a low, medium and high level. High electoral safety indicates that the candidate has met the electoral threshold. Candidates who did not meet the threshold were split into equally sized groups (low and medium). The Figure shows that response rates increase with electoral safety. More importantly, this increase is more pronounced for out-canton voters. The more electorally safe a candidate is, the higher the response rate is to service requests of out-canton voters, and vice versa. These descriptive results provide some initial support for our expectation that extrinsic motivations for constituency service may crowd out intrinsic ones. Let us now turn to a more thorough analysis of our crowding out hypothesis.
Cantonal treatment, electoral safety and response rates.

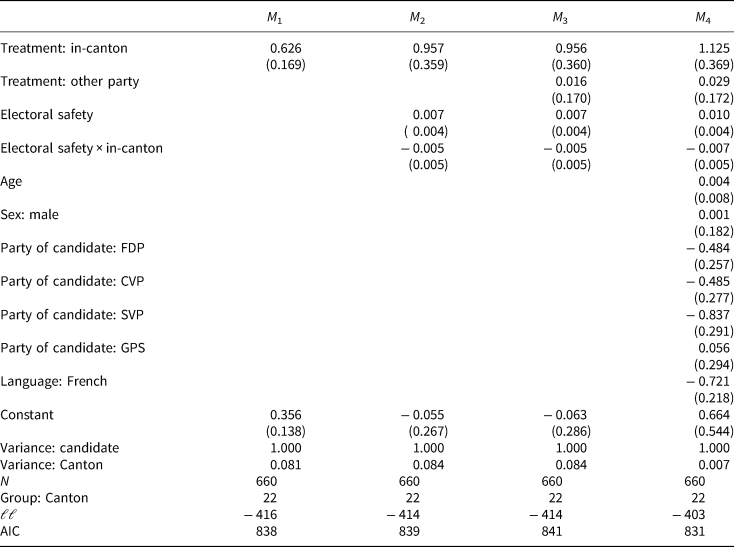
Table 2 summarizes the regression analyses. The first model (M 1) contains only the experimental treatment (in-canton/out-canton). The coefficient is positive and significant, indicating higher responsiveness to voter requests that originate from within the electoral district of the candidate. Compared to candidates receiving voter messages from outside their districts, candidates receiving messages from within their districts are 0.14 more likely to respond.Footnote 23 This effect remains robust in terms of magnitude and significance for various covariate adjustments (Appendix A5). These additional models moreover show that candidate responsiveness does not vary as a function of the party-treatment, which is in line with our theoretical consideration that it should not make a difference whether a constituency service request comes from a voter who previously supported the party or not. However, electorally safe candidates are more likely to be responsive than electorally vulnerable candidates.
RI logistic regression (outcome: answer)

Note: Standard errors in parentheses. Reference categories: female (sex), SP (party of candidate), German (language).
The second model includes the cantonal-treatment, electoral safety and an interaction term between the two variables. In line with our expectation, the positive effect of receiving an in-canton mail on candidate responsiveness should decrease as a function of growing electoral safety. The negative sign of the interaction term shows that this is indeed the case. This finding holds if we add the party-treatment (M 2) or indicators for the candidate's age, gender, party affiliation and language to the model (M 3). As has been pointed out repeatedly, p-values of multiplicative interaction coefficients are misleading and not indicative of the validity of an interaction hypothesis (Brambor et al., Reference Brambor, Clark and Golder2006; Kam and Franzese, Reference Kam and Franzese2007). We thus turn to the visualization of the effects of the full model (M 4).
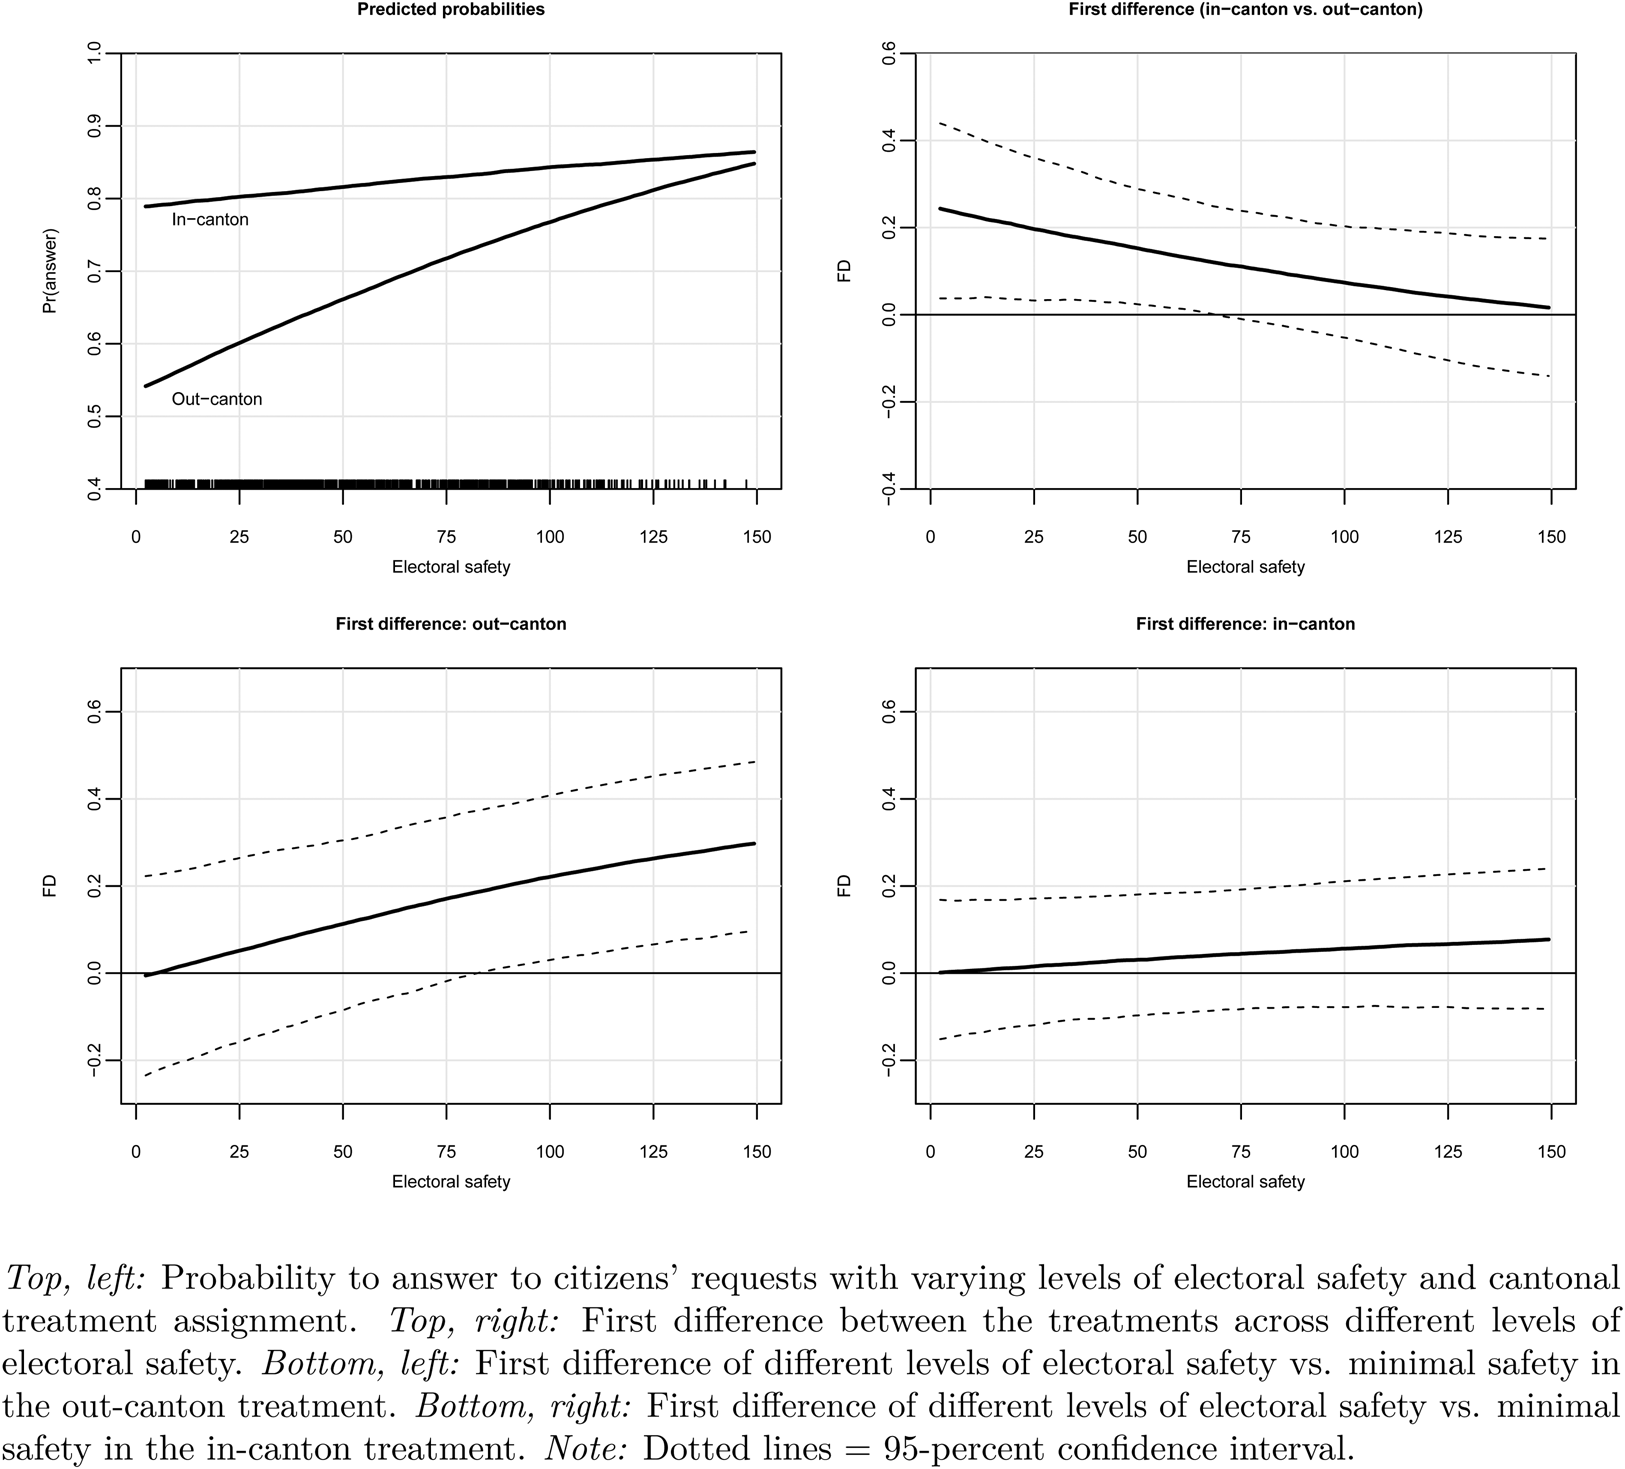
The top left panel in Figure 4 depicts the predicted probability to answer a citizen request with varying levels of electoral safety. Each tick on the x-axis stands for a candidate. While most candidates (543) did not meet the electoral threshold, 117 candidates got elected giving us enough statistical power to examine the whole range of electoral safety. The effect of the cantonal-treatment is conditioned by electoral safety. For candidates with minimal levels of safety, the predicted responsiveness is 0.24 lower in the out-canton condition than in the in-canton condition. The gap between the in- and out-canton condition closes with increasing levels of electoral safety. If electoral safety is at 150, i.e. the candidate got 50 percent more votes than necessary to gain a seat, the difference between the two conditions is nearly zero (0.01). Moreover, when we omit highly safe candidates by only looking at up to 90 percent of the safety distribution, the difference is already down to about 0.07.Footnote 24 The top right panel in Figure 4 shows the difference of predicted probabilities of the two conditions. Until a level of electoral safety of over 60, this corresponds to roughly 53 percent of the candidates in the sample, the cantonal-treatment produces significant differences in responsiveness.Footnote 25 This means that candidates with low levels of electoral safety seem much more receptive to extrinsic motivations than candidates at moderate or high levels of safety. The bottom panels delve deeper into the conditioning role of electoral safety on candidate responsiveness. More specifically, they show how much electoral safety has to increase from its minimum value in order to produce a significant change in predicted probability to answer to citizens' requests. In the out-canton treatment, electoral safety has to increase to a level of 80 to produce significant effects. In the in-canton treatment no realistic change in electoral safety produces significant effects. This bolsters the idea that electoral safety affects responsiveness in the out-canton, but not in the in-canton scenario. Appendix A6 presents visualizations of M 2 and M 3 in Table 2. The findings remain robust regardless of which covariate adjustment we perform.
Responsiveness spit by cantonal treatment and across electoral safety.

We performed extensive tests to ensure the robustness of these findings. We test the robustness of our ballot position measure in two ways. First, we examine the subset of lists that were ordered alphabetically. In these instances, the ballot position is random and should not be a good predictor of electoral safety. When we use this ballot position measure based on alphabetic order, we should find no effects and this is indeed what the findings in Appendix A7 suggest. Second, we matched the data from the field experiment with additional information about the candidates taken from the smartvote candidate survey (age, gender and region). A second robustness test introduces the squared electoral safety to relax the assumption of a linear moderating effect (Appendix A8). The results indicate that the effects of electoral safety are indeed slightly non-linear, in particular for in-canton emails. The findings regarding the crowding out effect remain robust. Third, we run a model that adjusts for incumbency status (Appendix A9) to deal with the concern that well-known officeholders who might have a professional staff are more likely to respond. We do not find any such incumbency effects (Appendix A9). Fourth, we run a linear probability model to approximate the interaction effects electoral safety and the cantonal-treatment (Appendix A11). The results remain robust. Fifth, we tested if responsiveness depends on the sender of the message (Appendix A12), and find no such evidence. Finally, while we did not detect signs that emails were answered by staff members, we reran our analysis excluding candidates who reported to have paid staff members (Appendix A12). The results again remain robust.
8. Conclusion
The reason why some legislators are more responsive to voters than others is an important topic of debate amongst political scientists. Existing work suggests that legislators are either primarily vote-seekers, and responsive to voters based on instrumental concerns relating to (re-)election. The alternative view is that legislators respond to voters based on their adherence to group norms or role perceptions. So far the literature has treated extrinsic and intrinsic motivations for constituency work as either isolated or mutually exclusive (for an exception see Grimmer, Reference Grimmer2013). Inspired by key insights about the unintended consequences of the presence of extrinsic motivations found in social psychology and behavioral economics, we explored the interaction between both sets of motivations. Our field experiment conducted with candidates for the 2015 election to the Swiss legislature adds to the current state-of-the-art not only by examining the way in which intrinsic and extrinsic motivations interact, but also by presenting experimental evidence for all candidates running for political office, both incumbents and challengers, in a less personalized and money-driven campaign context compared to the US.
We report several important findings. First, our results suggest that responsiveness among Swiss candidates is high and comparable to US legislators. Given the more personalized ballot and campaign environment in the US compared to low levels of professionalization in the Swiss context where parties rather than candidates dominate the campaign, this finding is remarkable. It supports the idea that the extensive US evidence on constituency efforts to date is more widely applicable and qualifies US work as well. Second, we find higher response rates to messages from voters residing in the candidate's district compared to those residing outside. As only in-district voters can affect election outcomes, this finding suggests that extrinsic motivations are crucial for understanding responsiveness to constituency service requests. That said, the comparable high response rates to messages of voters residing outside a candidate's district indicates that intrinsic motivations matter as well. Third, we also find that the strategic response to voters from the candidate's own district is most pronounced among those who face a high degree of electoral competition. This latter finding suggests that when the strategic incentives for constituency effort increase, that is to say when electoral competition increases, extrinsic motivations for constituency work seem to crowd out intrinsic motivations. Although we cannot randomly assign electoral safety and therefore need to be somewhat cautious about our results, these effects are robust against a variety of different ways to tap into the electoral safety candidates face.
This latter finding extends work about crowding out effects from social psychology and behavioral economics to the realm of legislative behavior. Although we report this in the context of constituency work, it should be expected to affect the activities of politicians more generally. This is important as contemporary democratic theory suggests that electoral competition makes it more likely that politicians will be both sympathetic and responsive to voters' needs (see e.g., Downs, Reference Downs1957; Pitkin, Reference Pitkin1967; Dahl, Reference Dahl1971; Manin et al., Reference Manin, Przeworski, Stokes, Przeworski, Stokes and Manin1999). Although our evidence by no means refutes the claim that electoral incentives can increase the responsiveness of legislators, quite the contrary, we do show that this increase also heightens the bias in responsiveness. Legislators are more likely to respond to those voters that can positively affect their election outcome while ignoring others. Our evidence may help to inform practitioners about the possible drawbacks associated with institutional reforms designed to increase electoral competition. Our evidence suggests that when it comes to constituency work electoral competition may constitute somewhat of a double-edged sword.
Author ORCIDs
Nathalie Giger, 0000-0002-1030-8493.
Supplementary Material
The supplementary material for this article can be found at https://doi.org/10.1017/psrm.2019.19
Acknowledgments
We wish to thank Andreas Goldberg, Marijana Grbesa, Lucas Leemann, Florian Foos and Denise Traber for their helpful feedback. We further thank Davy-Kim Lascombes for his valuable research assistance, and Hector Solaz and Roman Strub for their input on the design of the experiment. Lastly, we express our gratitude to all participants of the experiment as well as to Klaus Armingeon and Remi Baudoui for their help in recruiting the participants.