I. INTRODUCTION
High strength and plasticity cannot hold concurrently in metals and alloys; plasticity is normally reduced with increasing strength. Nevertheless, this dilemma has been overturned by ZrCuNiAl, a bulk metallic glass (BMG) with disordered atomic structure, exhibiting superior strength combined with improved plasticity.Reference Liu, Wang, Wang, Zhao, Pan and Wang1–Reference Inoue and Takeuchi3 Structural heterogeneity, for instance, the short-/middle-range order structure, is considered to be related to the plasticity of BMG.Reference Lee, Lee, Lee, Ma and Lee4–Reference Hufnagel and Brennan8 The existence of strong short-/middle-range order, indicated by the initial formation of icosahedral quasicrystals (IQCs) during the appropriate annealing process,Reference Luo, Sheng, Alamgir, Bai, He and Ma9–Reference Saida, Matsushita and Inoue11 causes inhomogeneous distribution of free volume and eventually leads to the enhancement of plasticity.Reference Zhu, Gu, Xie, Zhang, Inoue, Zhang and Hu12, Reference Ren, Pan, Chen, Chan, Liu and Liu13 Hence, the fundamental investigation on the detailed microstructure of the IQC precipitates is helpful to understand the relation between the icosahedral short-/middle-range order and the plasticity. ZrAlNiCuNb alloy was chosen for this research owing to the enhanced formation of IQC structure by adding additional elements, such as Nb, Ta, V, Mo, etc.Reference Sun, Shek, Wei, Li and Wang14–Reference Fan, Li, Inoue and Haas18
During our transmission electron microscopy (TEM) study of ZrAlNiCuNb alloy, icosahedral quasicrystalline precipitates with distorted diffraction patterns breaking the icosahedral symmetry and the golden ratio were widely observed. Such distortion of diffraction patterns can be explained in terms of phason strain, a characteristic defect in quasicrystal.Reference Bancel and Heiney19–Reference Socolar and Wright22 The phason strain associates with discrete atomic displacements, and the relaxation time is estimated to be extremely long.Reference Lubensky, Ramaswamy and Toner23, Reference Levine, Lubensky, Ostlund, Ramaswamy, Steinhardt and Toner24 This suggests that the phason strain will be frozen in IQC even after the heat treatment. It is characterized by subtle deviation of diffraction peaks from their standard positions, for instance, the broadening of x-ray diffraction peaksReference Horn, Malzfeldt, DiVincenzo, Toner and Gambino21, Reference Heiney, Bancel, Horn, Jordan, Laplaca, Angilello and Gayle25 and the zigzagg arrangement of electron diffraction spots,Reference Li, Pan, Tao, Hui, Mai, Chen and Cai26, Reference Franz, Feuerbacher, Wollgarten and Urban27 which was commonly observed in many quasicrystal-forming compounds.Reference Huang, Li, Teng, Pan and Chen28, Reference Zhao, Tang, Luo, Wang, Shen and Zhang29 Besides this common phason strain, different types of phason strain are systematically analyzed based on their representation in this paper.
Being analogous to crystal, domain structures also exist in quasicrystal. Complicated diffraction patterns with split spots were frequently encountered in Al-based two-dimensional (2D) decagonal quasicrystals,Reference Zhang and Kuo30–Reference Zhang, Li, Kuo, Yacaman and Torres33 which were explained by the existence of transition regions consisting of twin related microdomains from 2D decagonal quasicrystal to one-dimensional quasicrystal or to related crystalline phase. However, analogous research in IQCs is insufficient.Reference Bancel and Heiney19, Reference Franz, Feuerbacher, Wollgarten and Urban27, Reference Tanaka, Terauchi, Hiraga and Hirabayashi34 In this work, we report TEM investigations of nanoscale domains with continuously varied phason strain in icosahedral quasicrystalline precipitates of ZrAlNiCuNb alloy. This study will enrich the knowledge of phason strain in quasicrystals and may also deepen the understanding about the nature of quasicrystals.
II. EXPERIMENTAL
Ingots with nominal composition (Zr65Al10Ni10Cu15)93Nb7 were synthesized by arc melting pure Zr, Al, Ni, Cu, and Nb under a Ti-gettered argon atmosphere. From this master alloy, bulk alloy rods with 3 mm in diameter and 70 mm in length were prepared by suction casting into a water-cooled copper mold in a purified argon atmosphere.Reference Sun, Shek, Wei, Li and Wang14 Then, the rods were annealed at 700 K for 100 min in the muffle furnace.
For TEM observations, thin slices were cut from the heat-treated rods by the wire saw and then treated with mechanical grinding, dimpling, and finally ion milling (Gatan PIPS 691, Gatan, Inc. Corporate Headquarters, Pleasanton, CA). Bright field (BF) imaging and selected area electron diffraction (SAED) were obtained using a JEM 2010 HT (HT, high angle tilt) electron microscope (JEOL Ltd., Tokyo, Japan) with LaB6filament. High-resolution transmission electron microscopy (HRTEM) images were acquired using a JEM 2010 FEF electron microscope equipped with Schottky field emission gun and Ω-type in-column energy filter system. The operating voltages of both microscopes are 200 kV.
III. RESULTS AND DISCUSSIONS
A. Calculation and coordinate system
According to the linear phason strain,Reference Bancel and Heiney19, Reference Lubensky, Socolar, Steinhardt, Bancel and Heiney20 the shift of a diffraction peak from the position represented by  $g_{//}$can be expressed as:
 $$\Delta g_{//} = Mg_ \bot ,\,\,M = \left( {\matrix{ {m_{11} } {m_{12} } {m_{13} } \cr {m_{21} } {m_{22} } {m_{23} } \cr {m_{31} } {m_{32} } {m_{33} } \cr } } \right),$$
where M is the phason strain matrix,  $g_ \bot $ is the perpendicular space component of the reciprocal lattice vector. The weaker spots will suffer the stronger shifts, owing to the decrease of the spots intensity along with increasing modulus of
 $g_ \bot $.Reference Cahn, Shechtman and Gratias35 By carefully choosing the values of the matrix elements, the direction and the amplitude of the phason strain can be modulated. Obviously, we should establish a coordinate system first. Under different coordinate systems, the phason strain matrix describing the same phason strain will be different as well.
Here, we adopted the coordinate system presented by Cahn et al.Reference Cahn, Shechtman and Gratias35 and the indexing scheme proposed by Elser.Reference Elser36Figure 1(a) is a stereographic projection along 2-fold axis [100] of IQC showing the relationship between the physical subspace components  ${\rm{e}}_i^{//} $ of the basis vectors ei (i = 1, 2, …, 6) and the basis vectors Ej (j = 1, 2, 3) sustaining the physical subspace. The three axes of the coordinate system are aligned with a set of three orthogonal 2-fold axes of IQC. By tilting along [001] of 58.3°, we get the stereographic projection along 5-fold axis [1τ0] [Fig. 1(c)]. Figures 1(b) and 1(d) are the calculated SAED patterns of ideal IQC along the corresponding axes, applying the six-dimensional (6D) atomic model (6D lattice constant A = 0.764 nm) simplified from IQC Cd–Yb.Reference Takakura, Gómez, Yamamoto, De Boissieu and Tsai37
Stereographic projections of IQC showing the basis vectors  ${\rm{e}}_i^{//} $ (i = 1, 2, …, 6) and Ej (j = 1, 2, 3) along (a) 2-fold axis [1τ0] and (c) 5-fold axis [100]. (b, d) Corresponding calculated SAED patterns of ideal IQC.

B. Linear phason strains in quasicrystalline precipitates
Deviations of diffraction spots induced by the linear phason strain can be divided into two components; parallel and perpendicular to the incident beam direction. The former component leads to the breaking of central symmetry in the electron diffraction pattern, which will be discussed elsewhere. The latter component perpendicular to the incident beam direction can be further divided into two types, one is with direction perpendicular to [001], we called “transverse phason strain,” and the other is along [001], referred to as “longitudinal phason strain.” Experimentally, observed linear phason strains can be a transverse, longitudinal, or mixed assembly.
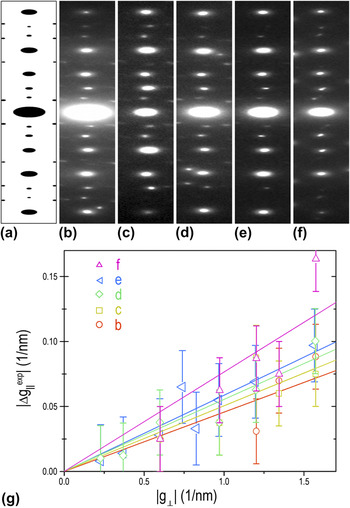
Figure 2 shows the transverse phason strain described by strain matrix with one nonzero element m 13. Figure 2(a) is the systematic row of reflections {00l} cut from the calculated 5-fold pattern [1τ0] of ideal IQC. The diffraction spots are perfectly aligned along the systematic row. Figures 2(b)–2(e) present the segments of experimental diffraction patterns along 5-fold axes, and Fig. 2(f) is the segment of an experimental pattern along a 2-fold axis. The experimental diffraction spots deviate from their ideal positions, forming a zigzagg arrangement. According to the Eq. (1), the deviations of the diffraction spots can be expressed as  $\left| {\Delta g_{//}^{\exp } } \right| = \left( {{\rm{\tau /}}\sqrt {{\rm{\tau }} + 2} } \right)m_{13} \left| {g_ \bot } \right|$ for 5-fold axis [1τ0] and
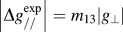 $\left| {\Delta g_{//}^{\exp } } \right| = m_{13} \left| {g_ \bot } \right|$ for 2-fold axis [010]. The deviations were precisely measured from Figs. 2(b)–2(f) and were plotted in Fig. 2(g) as a function of
 $|g_ \bot |$. The fittings of data show good linear dependence and provide the slopes of the straight lines. Thus, the obtained values of m 13 for Figs. 2(b)–2(f) are −0.054, −0.059, −0.065, −0.069, and −0.076, respectively.
The systematic rows of reflections {00l} cut from (a) calculated 5-fold pattern of ideal IQC, (b–e) experimental patterns along 5-fold axes, and (f) 2-fold axis. (g) Spots deviations measured from patterns in (b–f) are plotted against the modulus of the perpendicular reciprocal vectors. The slopes of the fitted straight lines show the different degrees of the linear phason strains. This is the case of the transverse type.

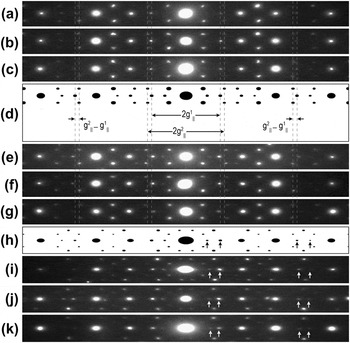
The longitudinal phason strain described by strain matrix with one nonzero element m 33 is shown in Fig. 3. Segments of systematic reflections {00l} from the experimental [Figs. 3(a)–3(c) and 3(e)–3(g)] and calculated [Fig. 3(d)] 2-fold patterns and the calculated [Fig. 3(h)] and experimental [Figs. 3(i)–3(k)] 5-fold patterns are ordered by the distances between the marked two weak spots, showing the deviations of diffraction spots along the systematic rows. Specifically, the dotted lines, which cross the centers of spots in the calculated pattern [Fig. 3(d)], locate out of the corresponding spots in Figs. 3(a)–3(c) and between the corresponding spots in Figs. 3(e)–3(g). It is more difficult to measure the deviation of a single spot under such condition, owing to the poor accuracy to determine the spots’ positions. Instead, we consider the deviations of two spots together as  $\left| {\Delta g_{//}^1 } \right| + \left| {\Delta g_{//}^2 } \right| = \left| {\Delta (g_{//}^2 - g_{//}^1 )} \right| = m_{33} \left( {\left| {g_ \bot ^1 } \right| + \left| {g_ \bot ^2 } \right|} \right)$ [Fig. 3(d)]. By measuring the changes of the distances
 $(g_{//}^2 - g_{//}^1 )$, we obtained the values of m 33 for Figs. 3(a)–3(c), 3(e)–3(g), and 3(i)–3(k), which are 0.036, 0.022, 0.016, −0.053, −0.066, −0.1, −0.048, −0.06, and −0.07, respectively.
The longitudinal type of phason strain. (a–c) and (e–g) Segments from experimental patterns and (d) the calculated pattern of ideal IQC along 2-fold axes. The horizontal distances between the two spots indicated by dotted lines increase from (a) to (g). (h) Segments from the calculated pattern of ideal IQC and (i–k) experimental patterns along 5-fold axes show the decrease of the distances between the two spots marked by arrows. Measuring the change of these distances provide the degrees of the linear phason strains.

C. Nanoscale domain structures with continuously varied linear phason strains
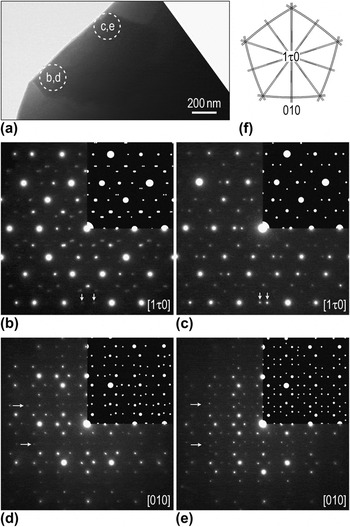
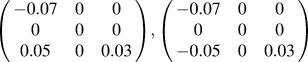
Sometimes, the linear phason strain is not so homogeneous and concise that can be described by the same strain matrix with only one nonzero element. Figure 4(a) presents a BF image of a precipitate grain with hundreds of nanometers. SAED patterns from different areas [Fig. 4(a)] are shown in Figs. 4(b)–4(e), where Figs. 4(b) and 4(c) are along the 5-fold axes and Figs. 4(d) and 4(e) are along the 2-fold axes. The angular relationship of the two axes is demonstrated in Fig. 4(f). There exist visible distinct characteristics between the corresponding patterns, especially those weak spots marked by arrows. Based on the analysis in Sec. III. B, the strain matrices were figured out and listed in Table I. Distorted diffraction patterns calculated using these matrices are superimposed on the experimental patterns showing perfect match between them.
(a) BF image of a quasicrystalline precipitate grain. (b–e) Corresponding SAED patterns from different areas indicated in (a) showing distinct characteristics, where the insets are the calculated patterns using strain matrices in Table I. (f) Schematic demonstration of the angular relationship of the two directions.

The linear phason strain matrices for the diffraction patterns calculation in Sec. III. C.

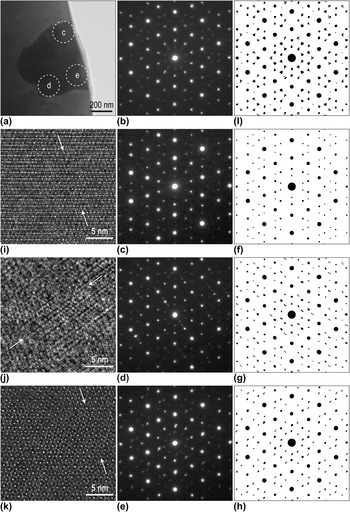
(a) BF image of another quasicrystalline precipitate and (b) corresponding SAED pattern from the whole grain. (c–e) SAED patterns, (f–h) corresponding calculated patterns, (i–k) HRTEM images with different linear phason strains from different areas marked in (a). (l) Composite pattern constructed by several single patterns calculated by phason strain matrices in Table I. The arrows in HRTEM images indicate the “jags” induced by the linear phason strain.

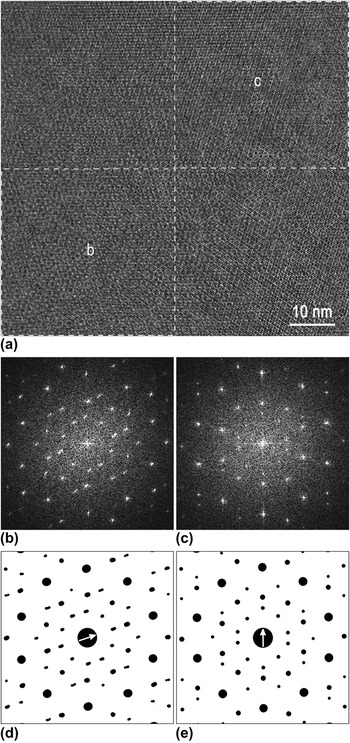
(a) A typical HRTEM image of a quasicrystalline precipitate. (b) FFT patterns of lower left and (c) upper right parts of the image. (d, e) Corresponding calculated patterns using strain matrices in Table I. Arrows at the centers denote directions of the spots deviations.

Figure 5(a) is a BF image of a smaller precipitate grain with a much more complicated SAED pattern [Fig. 5(b)]. Each reflection, especially the weak ones, seems to consist of many fine spots with various deviations, forming a small triangle. It implies that the pattern is composite of several phason strained ones, which can be validated by SAED patterns taken from different smaller areas [Figs. 5(c)–5(e)]. The results were crosschecked by calculated distorted diffraction patterns [Figs. 5(f)–5(h)] using different strain matrices (Table I). HRTEM images [Figs. 5(i)–5(k)] from corresponding areas would provide supportive evidence of the existence of the linear phason strain. The disturbances of quasiperiodicity manifested as clearly observable “jags” marked by arrows indicate the degeneration of the icosahedral symmetry.Reference Li, Pan, Huang, Hashimoto and Yokota38 A composite pattern in Fig. 5(l) was constructed by several single patterns, including those in Figs. 5(f)–5(h) and another two calculated using phason strain matrices listed in Table I, giving reasonable agreement with the experimental pattern in Fig. 5(b). Accordingly, the experimentally observed 5-fold symmetry [Fig. 5(b)] comes from the averaged structure within the grain that consists of several subgrains with different linear phason strain.
The linear phason strain variation is detectable even within a HRTEM image as shown in Fig. 6(a). The fast Fourier transform (FFT) patterns of the lower left and upper right regions are presented in Figs. 6(b) and 6(c), respectively. There is significant difference in the deviation directions between these two patterns. The corresponding distorted diffraction patterns [Figs. 6(d) and 6(e)] calculated using the matrices in Table I are in excellent agreement with experimental patterns. Arrows at the centers denote the different directions of the spots’ deviations. Although there is no positive identification of the boundary, these results suggest the existence of tiny-sized subgrains or domains with varied linear phason strains.
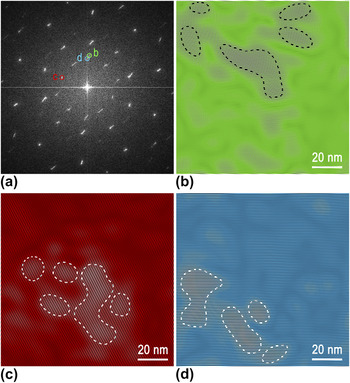
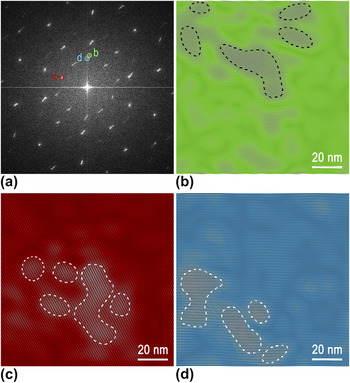
Figure 7(a) is a typical FFT pattern of a HRTEM image, where some reflections appear as elongated segments. When choosing a small enough area to process FFT, the reflections in the FFT pattern display as spots. Moving this selected small area throughout the image, the spots will move along the corresponding segments accordingly. Thus, for the whole HRTEM image, the deviated spots from different areas group together and result in the segment shape, revealing the trace of the strain variation. Selecting different inner weak reflections (marked “b” to “d”), lattice fringe images are obtained by inverse Fourier transformation as shown in Figs. 7(b)–7(d). It is noticeable that the bright areas outlined by dotted contours are rarely overlapping with each other. These tiny bright areas with tens of nanometers in size can be considered as subgrains or domains. The invisibility of the boundaries is probably due to the continuous variation of the linear phason strains.
(a) FFT pattern of another HRTEM image. (b–d) Fringe patterns obtained by inverse Fourier transformation using the reflections indicated in (a). The bright areas outlined by dotted contours showing the nanoscale domains.
Accompanied with the phase transition, domain structures usually form as a consequence of the fact that different variants of the transformed phase have equal probability to generate.Reference Zou, Fung and Kuo39–Reference Yang, Wang, Takahashi and Ohnuki41 According to Landau theory,Reference Landau and Lifshitz42 structural transitions always connect with symmetry change. Hu et al.Reference Hu, Wang, Ding and Yang43, Reference Hu, Wang and Ding44 calculated all the possible symmetry breaking and phase transitions in octagonal, decagonal, and dodecagonal QCs, while IshiiReference Ishii45, Reference Ishii46 discussed the transformation of icosahedral symmetric structures into tetrahedral, pentagonal, or trigonal symmetries. The continuous transformation from quasicrystal to crystal by the successive increase of linear phason strain was reported experimentally.Reference Li, Pan, Tao, Hui, Mai, Chen and Cai26, Reference Mai, Xu, Wang, Kuo, Jin and Cheng47 The linear phason strain is considered as the intermediate step during the transformation process. What we reported here indicates that domain structures form at the initial stage of the transformation process, as a result of various linear phason strains along directions with equal probability. Kuo’s research groupReference Zhang and Kuo48, Reference Zhou, Li, Ye and Kuo49 proposed an analogous explanation for a similar phenomenon. The difference is that it was associated with local translation order in various 2-fold directions, which was not observed in our study.
Remarkably, SAED patterns along 5-fold axis from the subgrains containing linear phason strain display the breaking of the 5-fold symmetry [e.g., Figs. 5(c)–5(e)]. However, SAED pattern from the whole grain, resulting from the superposition of several patterns [e.g., Fig. 5(b)], exhibits the 5-fold symmetry. It is reasonably deduced that linear phason strains within a grain can counterbalance each other, producing low macroscopic strain. This self-accommodation of the strain will effectively lower the system strain energy. Similar mechanisms, namely random activation of partials producing zero macroscopic strain in deformation twins of nanocrystalline face-centered cubic metals,Reference Wu, Liao, Srinivasan, Zhou, Lavernia, Valiev and Zhu50 and self-accommodation of martensitic shear strainReference Otsuka and Wayman51 have been reported before.
It has been experimentally shown that phason defects were connected with the plastic deformation of quasicrystal.Reference Franz, Feuerbacher, Wollgarten and Urban27, Reference Wollgarten, Beyss, Urban, Liebertz and Köster52 Furthermore, with increasing plastic deformation, the magnitude of the phason strain increases.Reference Franz, Feuerbacher, Wollgarten and Urban27 The plastic deformation tests show a softening behavior at high strains on, for instance, single quasicrystal Al–Pd–MnReference Wollgarten, Beyss, Urban, Liebertz and Köster52, Reference Rosefeld, Feuerbacher, Baufeld, Bartsch, Wollgarten, Hanke, Beyss, Messerschmidt and Urban53 and polyquasicrystal Al–Cu–Fe.Reference Bresson and Gratias54, Reference Wang, Ma, Lu, Xiong, Zhao and Wang55 Compared with the deformed quasicrystal in Ref. Reference Franz, Feuerbacher, Wollgarten and Urban27, our quasicrystalline precipitates universally exhibit spots deviations larger nearly by a magnitude. This suggests that there are preexisting plastic strains in the quasicrystalline precipitates, thus they are softer than the ideal quasicrystals and may have beneficial influence on the plasticity of BMG consequently.
IV. CONCLUSIONS
In summary, linear phason strains were widely observed in quasicrystalline precipitates of ZrAlNiCuNb alloy. Two types of linear phason strains inducing deviations of diffraction spots along two different directions perpendicular to the incident beam were identified and described by the strain matrices with only one nonzero element. The phason degree was determined quantitatively by electron diffraction analysis. Nanoscale domain structures formed as a result of linear phason strains along different directions with equal probability, which were researched by electron diffraction and high-resolution electron imaging analyses.
ACKNOWLEDGMENTS
The research was supported by the National Natural Science Foundation of China (Grant Nos. 51071110, 40972044, 51271134, and J1210061), China MOE NCET Program (Grant No. NCET-07-0640), 973 Program (Grant No. 2011CB933300), and the Fundamental Research Funds for the Central Universities. The authors are grateful for constructive suggestions from E. Abe.