Dyslexia, or specific reading disability, is a developmental disability in learning to read and write despite adequate educational opportunities, motivation, peripheral sensory acuity, and nonverbal cognitive capabilities. Most individuals with dyslexia have problems in phonological skills including phonological awareness and phoneme manipulation (Bradley & Bryant, Reference Bradley and Bryant1983; Brady & Shankweiler, Reference Brady and Shankweiler1991; Stanovich, Reference Stanovich1988; Vellutino, Fletcher, Snowling, & Scanlon, Reference Vellutino, Fletcher, Snowling and Scanlon2004; Wagner & Torgesen, Reference Wagner and Torgesen1987). Several theories offer explanations as to what the underlying mechanisms of phonological deficits in dyslexia might be (for recent reviews, see, e.g., Ramus, Reference Ramus2001, Reference Ramus2003; Rosen Reference Rosen2003; Vellutino et al., Reference Vellutino, Fletcher, Snowling and Scanlon2004). Problems in phonology could be caused by fuzzy or inaccurate phonological representations, and it is possible that these representations are poorer in individuals with dyslexia because they process speech sounds less accurately (Fowler, Reference Fowler, Brady and Shankweiler1991; Reed, Reference Reed1989; Schulte-Körne, Deimel, Bartling & Remschmidt, Reference Schulte-Körne, Deimel, Barling and Remschmidt1998). The inaccuracy in phonological representations can take place at several levels of phonology: in the formation of maps of the perceptual cues for different phonemic elements, in formation of phonemic categories or even at the level of phonological grammar (Pierrehumbert, 2003). Others have suggested that individuals with dyslexia have more general auditory processing deficits not restricted to the processing of speech sounds, and that these lower level auditory processing deficits are related to speech perception, phonology, and reading problems (Goswami et al., Reference Goswami, Thomson, Richardson, Stainthorp, Hughes and Rosen2002; Tallal, Reference Tallal1980, Reference Tallal2004).
There are several studies showing that speech perception in infancy affects later language skills, providing evidence for the link from speech perception to phonology and reading (Guttorm et al., Reference Guttorm, Leppänen, Poikkeus, Eklund, Lyytinen and Lyytinen2005; Kuhl, Conboy, Padden, Nelson, & Pruitt, Reference Kuhl, Conboy, Padden, Nelson and Pruitt2005; Tsao, Liu, & Kuhl, 2004). Speech, however, is an auditory signal and, thus, it is also of interest to study the more basic or lower level auditory processing mechanisms in conjunction with dyslexia. Of particular interest among possible lower level auditory processing tasks are those measures showing differences in performance between individuals with dyslexia and with typical reading skills. One of these measures is the perception of rise times or amplitude envelope onsets (Goswami et al., Reference Goswami, Thomson, Richardson, Stainthorp, Hughes and Rosen2002; Hämäläinen, Leppänen, Torppa, Müller, & Lyytinen, Reference Hämäläinen, Leppänen, Torppa, Muller and Lyytinen2005; Muneaux, Ziegler, Truc, Thomson, & Goswami, Reference Muneaux, Ziegler, True, Thomson and Goswami2004; Pasquini, Corriveau, & Goswami, Reference Pasquini, Corriveau and Goswami2007; Richardson, Thomson, Scott, & Goswami, Reference Richardson, Thomson, Scott and Goswami2004; Thomson, Fryer, Maltby, & Goswami, Reference Thomson, Fryer, Maltby and Goswami2006; Thomson & Goswami, Reference Thomson and Goswami2008). Earlier it has been hypothesized that the different tasks measuring the perception of amplitude envelopes could tap into the same underlying impaired perceptual mechanism in individuals with dyslexia (Hämäläinen et al., Reference Hämäläinen, Leppänen, Torppa, Muller and Lyytinen2005; Pasquini et al., Reference Pasquini, Corriveau and Goswami2007). In the present study, we set out to investigate the common variance in three different auditory tasks measuring the perception of amplitude envelopes (one- and two-ramp rise time discrimination and amplitude modulation [AM] detection) and their association to duration perception in speech, a sound feature important for the Finnish language.
AM in general has been found to be important for speech perception. Removing the slower AMs from speech makes it unintelligible (Drullman, Festen, & Plomp, Reference Drullman, Festen and Plomp1994; Shannon, Zeng, Kamath, Wygonski, & Ekelid, Reference Shannon, Zeng, Kamath, Wygonski and Ekelid1995). Slower AM has also been proposed to be important for segmenting speech into smaller units of rimes and syllables (Goswami et al., Reference Goswami, Thomson, Richardson, Stainthorp, Hughes and Rosen2002). It is thus possible that impaired perception of AM could lead to difficulties in speech perception, in turn affecting the quality of phonological representations and leading to dyslexia. Earlier studies have shown atypical processing of sound rise times (i.e., amplitude envelope onsets) at the beginning of multiple AMs in children and adults with dyslexia. Furthermore, several studies have shown that the detection of AM depth is impaired in children and adults with dyslexia. These studies are briefly reviewed below.
Goswami and colleagues (Reference Goswami, Thomson, Richardson, Stainthorp, Hughes and Rosen2002) put forward a hypothesis that children with dyslexia are impaired in processing larger sound segments early in life and dividing them into smaller units later when learning to read. This was based on the idea that in the development of speech perception, children listening to speech prosody segment it first into syllable or rime level segments (Curtin, Mintz, & Christiansen, Reference Curtin, Mintz and Christiansen2005; Jusczyk, Houston, & Newsome, Reference Jusczyk, Houston and Newsome1999). If the perception of syllable or rime boundaries is impaired, then this could lead later in development to problems at the phoneme level. Problems in perceiving the boundaries of larger speech segments before learning to read would then interfere with learning the speech segments corresponding to the written language system. According to this view, the perception of speech rhythm and prosody has been thought to rely, at least in part, on the perception of beat created by AM (Goswami et al., Reference Goswami, Thomson, Richardson, Stainthorp, Hughes and Rosen2002; Pasquini et al., Reference Pasquini, Corriveau and Goswami2007). Goswami et al. (Reference Goswami, Thomson, Richardson, Stainthorp, Hughes and Rosen2002) examined the performance of children with dyslexia on a “beat” categorization task with amplitude-modulated sounds. Varying the amplitude envelope onsets at the beginning of each modulation creates the perception of a beat in the sound when the rise times are short. With long rise times the beat is not easily distinguishable. Children with reading problems were shown to be poorer at this beat categorization task compared to chronological age control children, and the scores in beat categorization were related to phonological and reading as well as spelling skills when IQ and vocabulary were controlled (Goswami et al., Reference Goswami, Thomson, Richardson, Stainthorp, Hughes and Rosen2002). Muneaux et al. (Reference Muneaux, Ziegler, True, Thomson and Goswami2004) found similar results in French-speaking children.
Results supporting the amplitude envelope processing deficits in dyslexia have also been found for the discrimination of rise times by both adults and children with dyslexia (Hämäläinen et al., Reference Hämäläinen, Leppänen, Torppa, Muller and Lyytinen2005; Richardson et al., Reference Richardson, Thomson, Scott and Goswami2004; Thomson et al., Reference Thomson, Fryer, Maltby and Goswami2006). In Richardson and colleagues' (Reference Richardson, Thomson, Scott and Goswami2004) study two amplitude envelope tasks were examined: one with a single rise time ramp and the other with two onset ramp stimuli. They found that the performance of children on both tasks was associated with phonological skills, reading, and spelling, but that the task with multiple AMs seemed to associate more closely with spelling skills, whereas the task with only one modulation was more closely linked to reading ability. Thomson et al. (Reference Thomson, Fryer, Maltby and Goswami2006) studied English-speaking adults with the same tasks used by Richardson and colleagues (Reference Richardson, Thomson, Scott and Goswami2004). They found that the adults with dyslexia had elevated thresholds (compared to controls) in both one- and two-ramp rise time tasks. In addition, performance in the one-ramp rise time task was associated with reading and spelling. Hämäläinen et al. (Reference Hämäläinen, Leppänen, Torppa, Muller and Lyytinen2005) tested Finnish adults with dyslexia using a task with single varying rise time ramps in sound pairs and found that the detection of rise times was associated with phonological skills, as well as with pseudoword spelling in Finnish.
Recently, the perception of sound rise times has also been investigated in children with specific language impairment (SLI). Pasquini, Corriveau, and Goswami (Reference Pasquini, Corriveau and Goswami2007) suggested that the grammatical errors made by children with SLI could be linked to their perception of stressed and unstressed syllables in speech. Perception of stressed and unstressed syllables, in turn, was suggested to rely on the perception of amplitude changes and duration. They found that 70–80% of the children with SLI performed below the fifth percentile for typically developing children in rise time and duration perception tasks, suggesting that the children with SLI had problems integrating amplitude envelope information over longer time periods.
The detection of the depth of AM has also been shown to be different in adults with and without dyslexia. McAnally and Stein (Reference McAnally and Stein1997) showed that the brain responses to amplitude modulated sounds were smaller in amplitude in adults with dyslexia compared to typically reading adults. Menell, McAnally, and Stein (Reference Menell, McAnally and Stein1999) replicated this psychophysiological finding and demonstrated that behavioral AM detection thresholds also showed a group difference between adults with dyslexia and controls. The behavioral AM detection threshold showed a correlation with reading speed and accuracy. Witton, Stein, Stoodley, Rosner, and Talcott (Reference Witton, Stein, Stoodley, Rosner and Talcott2002) showed that the detection thresholds of AM at 20 Hz differed between adults with dyslexia and normally reading controls, replicating further the earlier results. They extended the finding by showing that detection of 2-Hz AM was intact in adults with dyslexia. Earlier studies of AM detection described above had shown differences between participants with dyslexia and controls in AM detection in the range of 10–320 Hz. Witton et al. (Reference Witton, Stein, Stoodley, Rosner and Talcott2002) also showed that AM detection threshold was correlated with reading accuracy. Adults with high-frequency discrimination thresholds and with reading disability (RD) have also been found to have higher AM detection thresholds (Amitay, Ahissar, & Nelken, Reference Amitay, Ahissar and Nelken2002), suggesting some convergence between auditory processing problems in participants with dyslexia. However, there are also contradicting results for AM detection. In one study, the detection of 1-Hz AM was impaired in contrast to 100-Hz AM that was intact in adults with RD compared to typical readers (Stuart, McAnally, McKey, Johnston, & Castles, Reference Stuart, McAnally, McKay, Johnston and Castles2006). It should be noted that this study had several methodological differences in the test procedures compared to the earlier studies, such as longer stimuli.
Studies investigating the detection of AM in children are scarcer, and have involved a rather small number of participants. However, two studies of AM detection in children have shown similar results to studies of adults. In one study, the performance of six children with dyslexia was compared to that of six control children in AM detection (Lorenzi, Dumont, & Füllgrabe, Reference Lorenzi, Dumont and Fuellgrabe2000). Results showed differences between the groups for 4- and 1024-Hz AM detection. In another study, 10 children with dyslexia showed lower AM detection thresholds compared to 5 typically reading children at AM rates of 4 and 128 Hz (Rocheron, Lorenzi, Füllgrabe, & Dumont, Reference Rocheron, Lorenzi, Fuellgrabe and Dumont2002).
The brief survey of prior findings concerning rise time and AM detection and dyslexia shows that the performance of individuals with dyslexia is poorer in these tasks compared to the performance of typical readers. In addition, performance in these tasks is associated with reading (decoding) and spelling as well as with phonological skills. However, the question of how auditory processing of rise times or AM depth could affect the phonological and reading skills in dyslexia remains open. None of the above studies have looked explicitly at the associations between the perception of amplitude envelopes and speech. Investigating this association would yield important new information on whether auditory processing could be linked to reading and phonological skills via speech perception. Perception of AMs, for example, has been shown to be important for speech intelligibility (Drullman et al., Reference Drullman, Festen and Plomp1994; Shannon et al., Reference Shannon, Zeng, Kamath, Wygonski and Ekelid1995). If an individual is impaired in perceiving these modulations, it could be hypothesized that this would lead to problems in perceiving speech sound contrasts, which would then affect the quality of speech representations and phonological abilities, thereby having an impact upon reading and spelling.
To assess speech perception, we measured our participants' ability to discriminate phoneme duration. In the Finnish language, phoneme quantity plays a critical role in differentiating words semantically. The quantity of a single phoneme can change a word's meaning, for example, the Finnish word tuli (“fire”) has a short vowel in the first syllable, whereas the word tuuli (“wind”) has a long duration in the vowel in the same position. Of importance, this difference in the sound duration is also reflected in the orthography in which short duration is marked with one letter, whereas long duration is marked with two letters. It should be noted, though, that the length of the individual phoneme is not the only cue to phonemic quantity. For example, vowel quality changes with duration and could thus be used as an additional cue to perceive the different phonemic quantities (Wiik, Reference Wiik1965). The perception of duration in speech sounds in dyslexia has been shown to be important in the Finnish context as well as in English (Leppänen, Pihko, Eklund, & Lyytinen, Reference Leppänen, Pihko, Eklund and Lyytinen1999; Leppänen et al., Reference Leppänen, Richardson, Pihko, Eklund, Guttorm and Aro2002; Lyytinen, Leinonen, Nikula, Aro, & Leiwo, Reference Lyytinen, Leinonen, Nikula, Aro, Leiwo and Berninger1995; Richardson, Leppänen, Leiwo, & Lyytinen, Reference Richardson, Leppänen, Leiwo and Lyytinen2003, in Finnish; Richardson et al., Reference Richardson, Thomson, Scott and Goswami2004, in English).
Group differences between children with and without reading disabilities were expected in the auditory and phoneme duration processing tasks based on earlier literature. To examine whether the amplitude envelope processing tasks used in previous studies tap into the same perceptual mechanisms, associations between performance in the auditory tasks were examined. In addition, associations between performance in the auditory tasks and speech perception were examined, in order to investigate whether this could be one route whereby lower level auditory processing could affect decoding skills (i.e., reading and nonword reading) and spelling. Finally, the associations between performance in auditory and speech perception tasks and reading and spelling tasks were investigated.
METHODS
Participants
Two groups of children were included in the present study: typically reading control children (N = 30; 15 girls, 15 boys) without any family history of dyslexia and children with RD from a group of children at familial risk for dyslexia (N = 30; 15 girls, 15 boys). The participants were tested during the summer after their second school year, when they were 9 years, 0 months (9;0) of age on average (range = 8;6 to 9;8). All of the children participating in the present study are part of the Jyväskylä Longitudinal Study of Dyslexia Project (Lyytinen et al., Reference Lyytinen, Ahonen, Eklund, Guttorm, Kulju and Laakso2004). The criterion for determining the children as having reading problems was performance at or below the 10th percentile of the control group's performance in at least three out of four measures of reading and spelling accuracy or in at least three out of four measures of reading speed. In addition, those children who fell below this criterion in two accuracy and two speed measures were considered to have reading problems. All of the tasks are described in more detail below. One child had missing data from one of the accuracy tasks but fell below the 10th percentile criterion in two accuracy and one speed measure and was also considered to have reading problems. The children in the control group were matched by gender and performance IQ (PIQ) to the children with reading problems from a pool of 76 control children, all of who were in the second grade. Our aim was to get equally sized groups who were as comparable as possible, except in terms of dyslexia.
For reading and spelling accuracy four measures were used: words read correctly in an oral text reading task, words read correctly in an oral pseudoword text reading task, a variable summing correctly read single words and nonwords, and a variable summing correctly spelled words/nonwords. For reading speed, the four measures were number of words read in 1 min from the text, number of words read in 1 min from the pseudoword text, a variable summing the production time and reaction time of correctly read single words and nonwords, and standard score on a standardized reading test (Lukilasse; Häyrinen, Serenius-Sirve, & Korkman, Reference Häyrinen, Serenius-Sirve and Korkman1999) that measured both time and accuracy. As an additional criterion, all children had to have a PIQ of at least 80 as measured with four subscales from the Wechsler Intelligence Scale for Children, Third Edition (WISC-III; Wechsler, Reference Wechsler1991). All children had completed the WISC-III during an assessment visit in November or March of the second school year. Control children below these criteria were excluded, and in addition one child in the control group with severe spelling problems and lower than average reading skills was excluded, before matching available controls to the children with RD. All children with any neurological, psychiatric, or other clinical problems (six cases) were excluded from analyses, resulting in group sizes of 30 children. All children were reported by their parents to have normal hearing thresholds.
The at-risk children had at least one parent and one other reported close relative with dyslexia. Control children had no reported family history of dyslexia. Parents' diagnoses of dyslexia were based on their reading speed or accuracy in oral text reading or in spelling accuracy, and on at least two single word measures (either accuracy or response latency of word recognition, pseudoword decoding, or lexical decision). In these tests, performance had to be one standard deviation lower than the norm. In addition, their IQ had to be equal to or above 80, assessed with the Raven B, C, and D Matrices (Raven, Court, & Raven, Reference Raven, Court and Raven1992). For a more detailed description of the parents' dyslexia criteria, see Leinonen et al. (Reference Leinonen, Muller, Leppänen, Aro, Ahonen and Lyytinen2001).
Criterion tasks for RD
The following assessments were used to diagnose RD. Aspects of these assessments were used to composite scores of reading accuracy and speed, as well as spelling accuracy (see Analyses and composite scores subsection).
Reading tests
Oral text reading. The participants read five passages with a total of 123 words of typical Finnish text. Reading performance was recorded on a tape recorder and the number of words read in 1 min (speed measure) as well as the percentage of correctly read words (accuracy measure) was assessed from the recording.
Oral pseudoword text reading. The participants read a short text made up of pseudowords resembling real Finnish words but having no meaning (19 words total). This task was also audiorecorded, and the number of words read in 1 min (speed measure) and the percentage of correctly read words (accuracy measure) were assessed from the recording.
Single word and nonword reading. Tests of word and nonword reading accuracy and fluency were administered by computer (Cognitive Workshop program, developed by the University of Dundee and University of Jyväskylä). Separate sets of 10 items were presented in a fixed order on-screen and the task requirement was for the child to read aloud the target item as quickly and accurately as possible. Altogether four sets were used: two sets of words and two sets of nonwords (three- and four-syllable words and nonwords). Two indices of speed (milliseconds) were produced: “reaction time” as the time between the presentation of the target on-screen and the initiation of the child's vocalization, and “production time,” as the time taken by the child to articulate the target. The sum of reaction time and production time was used as the measure of reading speed. The number of correctly read words was used as the accuracy measure.
Word and nonword spelling. The participants were asked to write with a pencil six four-syllable words that were presented by a computer via headphones. Similarly, they were asked to write two other separate sets of four-syllable nonwords (6 in each set, 12 in total). The sum of the scores in these tasks was calculated and only the accuracy measure was used in the further analyses.
Lukilasse. In this standardized reading task the participants had 2 min to read aloud as many words as possible from a 90-item list (Häyrinen et al., Reference Häyrinen, Serenius-Sirve and Korkman1999). The standard score was based on correctly read words and thus took into account both reading speed and accuracy. This measure was used only for screening the children with reading problems, as a measure of reading speed.
IQ
WISC-III. PIQ was measured using the WISC-III (Wechsler, Reference Wechsler1991) to assess the contribution of cognitive skills to auditory and speech perception ability. PIQ was calculated from four tasks (picture completion, block design, object assembly, and coding). The Digit Span Scale was also administered to control for short-term memory, and the Vocabulary Scale was administered to assess more general language skills.
Auditory and speech perception tasks
One-ramp rise time discrimination. This task was the same as that used by Richardson and colleagues (Reference Richardson, Thomson, Scott and Goswami2004), except here we used a long (300-ms) rise time as standard instead of a short (15-ms) rise time. Using an AXB paradigm, three tones were presented consecutively (500-ms intervals). The middle stimulus (X) was always the standard stimulus and either the first (A) or the third (B) stimulus was different from the standard. A continuum of 40 stimuli was created from a 500-Hz sinusoid, varying the linear rise time of the envelope from 15 to 300 ms (logarithmically spaced). The stimuli had a fixed length of 800 ms. The linear fall time was fixed to 50 ms. The stimulus with the longest rise time (300 ms) was used as the standard. The child was instructed to choose which of the sounds (A or B) was different at the beginning of the sound (the target sound corresponded to the ramps with shorter rise times). Six practice trials were presented before the actual test. The average threshold value of the last four reversals was used in the analysis. The rise time discrimination tasks were administered using a “Dinosaur” psychoacoustic program (developed by Dorothy Bishop, Oxford University) that presents auditory stimuli in a forced choice paradigm, adaptively selecting stimulus values to enable efficient threshold measuring. Because of a technical mishap (the task started for some children from a different difficulty level than for some other participants), rise time discrimination thresholds were not comparable between all children. A subset of the data that were comparable was thus used for the analyses. The number of children for the one-ramp rise time discrimination is indicated when we report the analyses.
Two-ramp rise time discrimination. This task was the same as that used by Richardson and colleagues (Reference Richardson, Thomson, Scott and Goswami2004). Using a two-interval forced-choice paradigm, two sounds were presented consecutively (500-ms interval), and the child was required to choose the dinosaur making the target sound (“Dinosaur” program; see above). A 3573-ms sinusoid carrier at 500 Hz and amplitude-modulated at the rate of 0.7 Hz (depth of 50%) was used as a starting point in creating a continuum of 40 stimuli. The underlying modulation envelope was based on a square wave. The rise time was varied from 15 to 300 ms (logarithmically spaced) and the fall time was fixed at 350 ms. The stimulus with the longest rise time (300 ms) was used as the standard. Before this task six practice trials were presented. The average threshold of the last four reversals was used in the analysis. The child was required to choose the dinosaur with a clearer beat (which corresponded to the ramps with shorter rise times).
AM detection. This task was exactly the same as that used by Witton et al. (Reference Witton, Stein, Stoodley, Rosner and Talcott2002). In this two-alternative forced-choice task pairs of online computer-generated sounds were delivered via headphones to the participant (the program was provided courtesy of Caroline Witton, Aston University, UK). The sounds were 1-kHz tones separated by a 500-ms interstimulus interval (ISI; offset to onset). One of the sounds was amplitude modulated (using a rate of 20 Hz; chosen based on the Witton et al., Reference Witton, Stein, Stoodley, Rosner and Talcott2002, study in which differences were found between individuals with dyslexia and normal readers using this modulation rate) and the other sound was not. The child's task was to identify which sound, first or second, contained the modulation. Participants responded with a mouse click on either one of two animated birds that “sang” the sounds. The first two trials were practice trials, with the modulation depth (the extent of the sinusoidal deviation of the amplitude from that of the carrier) of the target tone set at a value well above the threshold for most children. The first experimental trial used this same depth; subsequently, the modulation depth of the target was adjusted on a trial-by-trial basis using a weighted one-up, one-down technique (Kaernbach, Reference Kaernbach1991). For each correct response, the modulation depth was reduced by 1 dB (a factor of 1.122), and for each incorrect response the modulation depth was increased by 3 dB (a factor of 1.412). Detection threshold was defined as the geometric mean of the final 8 of 10 reversals and this measure was used in the further analyses.
Phoneme duration discrimination. Two pseudowords were presented in each trial (22 trials) via a computer through headphones to the participants. The ISI between the two pseudowords was 1000 ms. The task was to decide whether the two pseudowords were the same or different. In 12 of the trials there was a difference in the duration of a consonant or vowel (e.g., rameli–raameli, lamutto–lamuto). This duration difference could be in any consonant or vowel in the word. All of the pseudowords had two to four syllables. The number of correct responses was used in the further analyses. In the Finnish language repetition of a letter corresponds approximately to a doubling of the length of the phoneme. The perception of these length differences has been found to be difficult for children and adults with dyslexia (Leppänen et al., Reference Leppänen, Pihko, Eklund and Lyytinen1999; Lyytinen et al., Reference Lyytinen, Leinonen, Nikula, Aro, Leiwo and Berninger1995; Richardson et al., Reference Richardson, Leppänen, Leiwo and Lyytinen2003). The split-half reliability of the task was 0.588.
Analyses and composite scores. All variables were inspected for outliers and each individual case that lay outside three times the interquartile range of the variable was removed from the dataset. Only one outlying case in reading speed was found.
Composite scores were calculated for reading accuracy and speed and spelling accuracy separately. Reading composites reflect phonological decoding and spelling accuracy reflect phonological recoding. Composite scores were calculated on the basis of the average of z scores for the whole control group (N = 76) for reading accuracy (including accuracy in oral text and pseudoword text reading and in single word and nonword reading; Cronbach α = .793), reading speed (oral text and pseudoword text reading, single word and nonword reading; Cronbach α = .785), and spelling accuracy (word and nonword spelling; Cronbach α = .882).
For the phoneme duration discrimination performance d prime scores were calculated to take into account possible response bias. The d prime was calculated by subtracting the z score transformed percentage of false alarms (number of incorrect answers to same–same pairs) from the z score transformed percentage of hits (number of correct answers to same–different pairs).
Independent samples t tests were carried out to explore group differences in the auditory and speech perception tasks. Corrected degrees of freedom and t values were used when Levene's test showed that variances between groups were not equal. Pearson correlation coefficients were calculated to examine the associations between performance in the reading, spelling, and auditory tasks. To control for the effects of PIQ (see, e.g., Hulslander et al., Reference Hulslander, Talcott, Witton, DeFries, Pennington and Wadsworth2004), IQ was entered into regression analyses as the independent variable and each of the speech/auditory tasks was used as a dependent variable. Unstandardized residuals were saved, and these were used in the analyses (group comparison and correlation) for the perceptual tasks.
Path analysis was carried out using Mplus Version 5 to investigate the effects of auditory and speech perception on reading and spelling.
RESULTS
Differences between reading groups
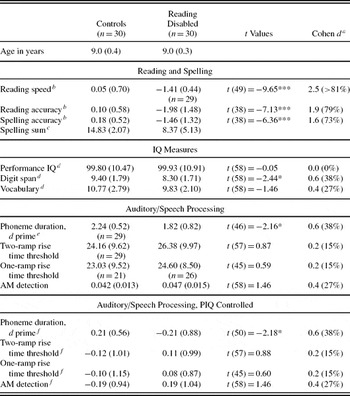
Separate independent samples t tests for each auditory/speech perception task revealed that the two groups differed only in the d prime score for phoneme duration discrimination, in which the children with reading problems had lower d scores (indicating fewer correct responses) than the control group. Control children were able to discriminate 45- and 50-ms rise times from the reference sound of a 300-ms rise time for the one-ramp and two-ramp rise time discrimination tasks, respectively. The children with reading problems were able to discriminate 40-ms rise times in the same tasks, but this difference was not statistically significant. The Cohen d was calculated to see to what extent the distributions of the groups overlapped in the auditory and speech perception tasks (see Table 1). The phoneme duration discrimination distribution between the groups showed a 38% nonoverlap. In all of the auditory tasks the distributions had a large overlap.
Means (standard deviations) for controls and children with reading disabilities in reading and spelling skills, IQ, and speech/auditory perception skills

Note: Differences and effect sizes (Cohen d) between reading disabled and control groups are shown. For composite variables only z scores are shown.
aThe values in parentheses are the percent of nonoverlap between groups.
bComposite z scores.
cNumber of correct items (maximum 18).
dStandard score.
eThe original scores for the sum of correct answers were 18.69 (1.63) and 17.17 (3.13) for controls and children with reading disabilities, respectively.
f The z scores of unstandardized residuals from regression analyses after the performance IQ (PIQ).
*p < .05. ***p < .001.
Correlations between auditory and speech perception tasks by group
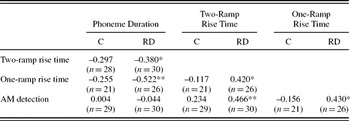
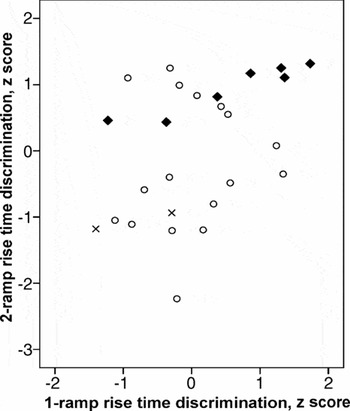
In all of the correlations for the perceptual tasks PIQ was taken into account using unstandardized residuals in the analyses (see Analyses and composite scores subsection). Table 2 shows that the one- and two-ramp rise time discrimination thresholds correlated with each other for the children with reading problems. The correlations showed that good performance in one task was associated with a good result in the other task. Similarly, AM detection scores were associated with both of the rise time task scores. Figure 1 shows the relationship between the three variables in children with RD. To plot all three variables into the same figure, the performance in the AM detection task was divided into three categories: <1 SD (good performance), ±1 SD (average performance), and >1 SD (poor performance) of the control group's mean. The figure shows that AM detection thresholds are more closely related to two-ramp rise time discrimination thresholds than to one-ramp rise time discrimination thresholds.
Pearson correlation coefficients between speech and auditory processing tasks in both reading groups

Note: C, controls; RD, children with reading disability. IQ is controlled for in the correlations.
*p < .05. **p < .01.
A scatterplot for one- and two-ramp rise time discrimination thresholds (z scores). Children who were (×) good (<1 SD from the control group's mean), (◯) average (±1 SD), or (◆) poor (>1 SD) in amplitude modulation detection. Performance IQ has been controlled for in this figure.

Phoneme duration discrimination scores were correlated with both rise time discrimination thresholds, but again only for the children with reading problems. Greater sensitivity of phoneme duration was associated with greater perceptual sensitivity in the rise time tasks.
Correlations among performance on auditory tasks, speech perception task, and reading and spelling tasks
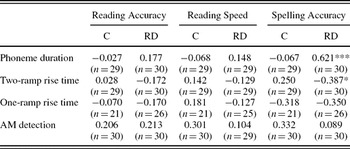
No correlations were found between the auditory and speech perception tasks and reading accuracy or speed in either group. In addition, no associations were found in the control group between auditory and speech perception and spelling.
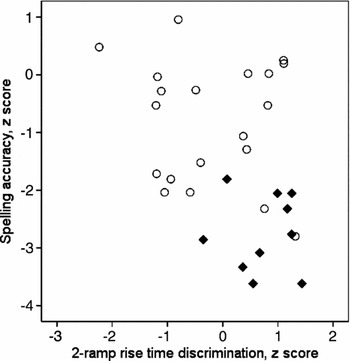
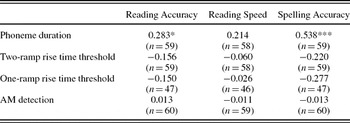
Within the group of children with reading problems, d prime score of phoneme duration discrimination and two-ramp rise time discrimination had a significant correlation with spelling accuracy; the greater the sensitivity in the phoneme duration or two-ramp rise time discrimination task, the better the performance in spelling (Table 3). The d prime scores of phoneme duration discrimination was divided into two levels: below –1 SD (poor skills) and equal to or above –1 SD (average and good skills) of the control group's mean. This allowed the plotting of the three variables into the same scatterplot (Figure 2) to see how these three skills are associated in the individual children. Figure 2 shows that those children who are poor in both spelling and two-ramp rise time discrimination show also less sensitivity in phoneme duration discrimination.
Pearson correlation coefficients between performance in speech/auditory processing tasks and reading and spelling in both reading groups

Note: C, controls; RD, children with reading disability. Performance IQ is controlled for in the correlations.
*p < .05. ***p < .001.
A scatterplot for two-ramp rise time discrimination threshold and spelling accuracy in the group with reading disabled children (N = 30). (◯) Children who were good or average (above –1 SD from the control group's mean) and (◆) those who were poor (below –1 SD) in phoneme duration discrimination based on their d prime scores. Performance IQ has been controlled for in rise time and phoneme duration discrimination.

Table 4 shows the correlations in the combined group of normal and reading disabled children. Associations were found between phoneme duration discrimination and spelling and reading accuracy. The better the performance in the phoneme duration discrimination task, the better the performance in the literacy tasks.
Pearson correlation coefficients between auditory/speech perception skills and literacy measures in the combined group of controls and children with reading disabilities

Note: Performance IQ is controlled for in the correlations.
*p < .05. ***p < .001.
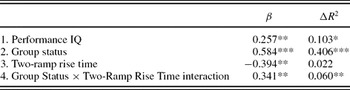
To better characterize the relationship between rise time discrimination and spelling across the groups, a regression analysis was carried out adding an interaction term. If rise time discrimination is showing different effects on spelling in the two groups, then the interaction between group and rise time discrimination should explain additional variance in spelling after entering group and rise time discrimination into the regression model separately. As can be seen from Table 5, this is what was found. PIQ and group status explained most of the variance in spelling (10.3% and 40.6%, respectively). Rise time discrimination did not explain additional variance, but the interaction between group status and rise time discrimination did (6%).
Variance of spelling accuracy by group status (reading disability, typical reading), performance in two-ramp rise time discrimination task, and their interaction

Note: Hierarchical regression model using the enter method. Whole model: F (4, 54) = 19.584, p < .001. adjusted R 2 = 0.562.
*p < .05. **p < .01. ***p < .001.
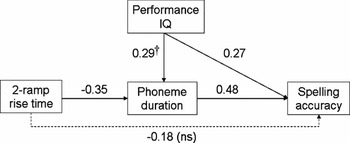
To see whether auditory perception would have a direct effect on spelling skills or whether its effect would be mediated through speech perception, a path analysis was carried out. This was done only for the RD group, as no significant correlations between these variables were found in the control group. Figure 3 shows the saturated path model. From the figure it can be seen that two-ramp rise time discrimination is explaining variance in phoneme duration discrimination, which in turn, is explaining variance in spelling accuracy. The direct path from two-ramp rise time discrimination to spelling accuracy was not significant. The indirect path from PIQ to spelling accuracy through phoneme duration discrimination was close to significant (p < .09). The direct path from PIQ to phoneme duration discrimination was close to significant (p < .06). The model explained 54.9% of the variance in spelling accuracy. The path analysis shows that the effect of rise time discrimination ability on spelling accuracy is mediated by phoneme duration discrimination ability.
The saturated path model of the associations among auditory perception (two-ramp rise time discrimination), speech perception (phoneme duration discrimination), and spelling accuracy in children with reading disability (N = 30). The model explains 54.9% of the variance in spelling accuracy. The effect of auditory perception on spelling accuracy is mediated through speech perception. The dashed line shows the nonsignificant path from rise time discrimination to spelling accuracy. †p < .06.

DISCUSSION
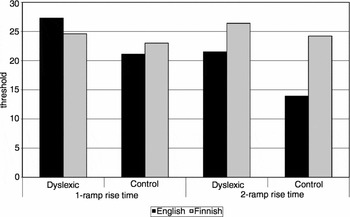
The present study set out to investigate whether Finnish-speaking children with reading problems would show atypical processing of amplitude envelopes in sounds and whether individual differences in sensitivity to processing of amplitude envelopes could explain individual variation in speech perception, reading, and spelling. Performance in the tasks involving the perception of changes in sound amplitude (one- and two-ramp rise time discrimination, AM detection) did not differ between the two groups, which was unexpected. Earlier studies with almost the same tasks have shown differences between children and adults with and without dyslexia in English- and French-speaking populations (Goswami et al., Reference Goswami, Thomson, Richardson, Stainthorp, Hughes and Rosen2002; Muneaux et al., Reference Muneaux, Ziegler, True, Thomson and Goswami2004; Richardson et al., Reference Richardson, Thomson, Scott and Goswami2004; Thomson et al., Reference Thomson, Fryer, Maltby and Goswami2006; Witton et al., Reference Witton, Stein, Stoodley, Rosner and Talcott2002). The two-ramp rise time discrimination thresholds for the control children were higher in our study than in the study of English-speaking children by Richardson et al. (Reference Richardson, Thomson, Scott and Goswami2004), whereas the thresholds for children with dyslexia were at the same level in both studies. This made the group difference in the current study nonsignificant (see Figure 4). A similar but smaller effect is also seen for the one-ramp rise time discrimination thresholds. The phonotactic and prosodic differences of the languages used in the present study (Finnish) and Richardson et al.'s study (English) may have influenced the differences between the two studies. English can have consonant clusters at the beginning of words, whereas Finnish cannot; thus, the syllable nucleus always occurs relatively early and systematically in Finnish. This may mean that Finnish children need to pay less attention to amplitude envelope onsets. Although both languages use trochaic stress patterns, English is a predominantly stress-timed language, with reduced vowel sounds and stress patterns (e.g., Grabe & Low, Reference Grabe, Low, Gussenhoven and Warner2002). On the continuum of stress-timed to syllable-timed languages, Finnish is closer to the syllable-timed languages without reduced vowels. This could possibly lead to higher sensitivity for detecting AM beats in English-speaking children. Although the effect of language environment on AM detection has not been studied, evidence for the effects of language environment on the perception of nonlinguistic sounds has been shown for duration discrimination in Finnish and German participants. Finnish participants showed better behavioral discrimination of nonlinguistic duration contrasts and a larger change detection response (mismatch negativity) of the brain event-related potentials compared to German participants, whereas nonlinguistic frequency contrasts produced equivalent behavioral and brain responses in both groups (Tervaniemi et al., Reference Tervaniemi, Jacobsen, Röttger, Kujala, Widmann and Vainio2006). However, results from French-speaking children, who also show a rise time perception deficit in a beat categorization task (Muneaux et al., Reference Muneaux, Ziegler, True, Thomson and Goswami2004), would seem to contradict the language environment hypothesis. French is closer to the syllable-timed languages without vowel reduction, as is Finnish. It should be noted, though, that the tasks used in the present study and in the Muneaux et al. (Reference Muneaux, Ziegler, True, Thomson and Goswami2004) study used different methods for testing rise time sensitivity, which could have affected the results.
Threshold values for English (Richardson et al., Reference Richardson, Thomson, Scott and Goswami2004) and Finnish (this article) children in (left) one-ramp and (right) two-ramp rise time discrimination tasks. English-speaking typical readers have lower threshold values than Finnish-speaking typical readers.

In fact, in an earlier study, we did find that Finnish-speaking adults with dyslexia differed from typical readers in their detection of rise times in sound pairs (Hämäläinen et al., Reference Hämäläinen, Leppänen, Torppa, Muller and Lyytinen2005). One possible cause for the difference between the current study and the earlier study could have been the differences in the tasks used. In our study with adults, we used a task with repeated presentation of the reference sound pair interspersed with an occasional target pair with a different rise time. This may have enabled the formation of more precise memory traces for the reference sounds, and thus easier detection of the deviancy in rise time (cf. Ahissar, Yedida, Putter-Katz, & Banai, Reference Ahissar, Lubin, Putter-Katz and Banai2006; France et al., Reference France, Rosner, Hansen, Calvin, Talcott and Richardson2002). Finnish speakers could have more difficulties in discriminating and detecting different rise times, as suggested above, and may thus require more exposure to the reference sound to perform at the same level as English speakers in detection or discrimination of rise times. The adults that we tested in Hämäläinen et al. (Reference Hämäläinen, Leppänen, Torppa, Muller and Lyytinen2005) study had also had more exposure to language than the children tested here.
Even though the low-level auditory processing measures did not reveal group differences in the current study, the measure of speech perception did. Phoneme duration discrimination showed differences between children with RD and control children. The Cohen d showed that 38% of the variance in this task was not overlapping for the groups, even when controlling for PIQ. The difference in phoneme duration discrimination was expected, because earlier studies with adults with dyslexia and infants at risk for dyslexia have shown atypical categorization and processing of phoneme durations (Leppänen et al., Reference Leppänen, Pihko, Eklund and Lyytinen1999, Reference Leppänen, Richardson, Pihko, Eklund, Guttorm and Aro2002; Richardson, Reference Richardson1998; Richardson et al., Reference Richardson, Leppänen, Leiwo and Lyytinen2003). Finnish adults with dyslexia have also been shown to make more reading and spelling errors in phoneme quantity than typical readers (Lyytinen et al., Reference Lyytinen, Leinonen, Nikula, Aro, Leiwo and Berninger1995).
Associations between performance in the auditory perceptual tasks and spelling accuracy were examined using a path analysis. This showed that rise time discrimination only explained variance in spelling through phoneme duration discrimination. In general, those children who were poor in spelling and speech perception were also poor in rise time discrimination (Figure 2). These findings support the hypothesis that poor auditory processing skills could, in part, lead to poor speech perception, which in turn, could play a causal role for poorer phonological representations and dyslexia. There are also likely to be top-down effects related to speech sound representations that influence performance in the phoneme duration discrimination task. Hence, both basic auditory processing skills and top-down processes are likely to have an impact on spelling performance. The associations found in the present study do not of course prove causality. Rather, they provide evidence that auditory processing could affect the development of skills related to spelling in Finnish.
CONCLUSION
In conclusion, one- and two-ramp rise time discrimination and AM detection thresholds were associated in children with RD, and the interaction between group status and rise time sensitivity explained significant additional variance in spelling performance. Further, performance in the rise time tasks was associated with phoneme duration discrimination, which in turn, was associated with spelling. This could indicate a possible developmental route whereby basic auditory skills could affect spelling performance in children with RD, as indicated by the path analysis. However, the current study measured only a limited number of speech perception and auditory processing skills. Further studies are needed to fully understand the relationship between auditory processing and reading disabilities, taking into account the development of auditory, speech perception, phonological, and reading and spelling skills, using both behavioral and brain activation measures.
ACKNOWLEDGMENTS
The study was financially supported by the Finnish Graduate School of Psychology and the Centre of Excellence Program of the Academy of Finland (Grants 44858 and 213486).