Introduction
Cochlear implantation has evolved into a well-established therapeutic intervention for severe to profound hearing loss, consistently demonstrating marked improvements in auditory perception. Enlarged vestibular aqueduct, first characterised by Valvassori and Clemis,Reference Valvassori and Clemis1 represents a significant inner-ear malformation associated with fluctuating, progressive hearing deterioration that typically advances to severe or profound sensorineural hearing loss.
While cochlear implantation is now standard treatment for enlarged vestibular aqueduct patients, the placement of the implants may affect vestibular function because of to the intricate anatomical relationship between cochlear and vestibular structures. Contemporary literature documents increasing evidence of post-implantation decline in peripheral vestibular function.Reference Yong, Young, Lea, Foggin, Zaia and Kozak2–Reference Li and Gong5 Histopathological studies of temporal bones in cochlear implant recipients by Katsiari and colleaguesReference Katsiari, Balatsouras, Sengas, Riga, Korres and Xenelis6–Reference Handzel, Burgess and Nadol8 revealed various vestibular complications, including inner-ear effusion, saccular and utricular atrophy, and vestibular fibrosis and ossification.
Prior studiesReference Guan, Wang, Wu, Zhang, Sun and Guo3, Reference Kuang, Haversat and Michaelides7, Reference Ibrahim, da Silva, Segal and Zeitouni9–Reference Yan, Zong, Han, Li, Qiao and Wang11 consistently report caloric and vestibular-evoked myogenic potential impairments post-cochlear implant, whereas the video head impulse test and Dizziness Handicap Inventory scores often remain stable. Notably, post-surgical vestibular-evoked myogenic potential responses showed significant correlation with cochlear implant activation status, and paediatric vestibular function demonstrated adaptations corresponding to implant usage duration and rehabilitation progress.Reference Dhondt, Maes, Vanaudenaerde, Martens, Rombaut and Van Hecke12 Wang et al.’s researchReference Wang, Zhang, Luo, Chao, Xu and Liu13 revealed superior preservation of otolithic function post-surgery in enlarged vestibular aqueduct patients compared with those with no inner-ear malformation anatomy.
The vestibular system’s components – three semicircular canals and two otolithic organs – serve distinct physiological functions, each assessed through specific diagnostic tools: caloric testing, video head impulse test, rotary chair examination and vestibular-evoked myogenic potential.Reference Shepard and Jacobson14, Reference Arriaga, Chen and Cenci15 Despite these advances in understanding, studies examining long-term vestibular function after cochlear implantation remain limited, with most previous reports focusing on short-term or early post-operative changes. However, long-term evaluation is clinically important because it helps determine whether vestibular dysfunction persists over time, whether vestibular compensation occurs and whether different cochlear morphologies are associated with distinct long-term outcomes.
The present cross-sectional study aimed to evaluate long-term vestibular function in patients with enlarged vestibular aqueduct and in those without inner-ear malformations after cochlear implantation, using comprehensive vestibular assessments including the Dizziness Handicap Inventory, the Pediatric Vestibular Symptom Questionnaire, caloric testing, the vestibular-evoked myogenic potential and the video head impulse test in recipients who had undergone implantation at least one year earlier.
Materials and methods
Participants
In this single-centre cross-sectional study, 53 eligible individuals who had undergone single-sided cochlear implantation at our medical centre between 2006 and 2023 were consecutively included if they met the predefined inclusion criteria and completed vestibular evaluation at follow up. This study was approved by the Medical Research Ethics Committee of the First Affiliated Hospital of USTC (University of Science and Technology of China) (Anhui Provincial Hospital) (approval No. 2020 KY Ethics No. 211; initial review 21 December 2020; expedited review approval 25 December 2020). Written informed consent was obtained from all adult participants and from the guardians of paediatric participants.
The study was based on available recipients during the study period rather than on a formal a priori sample size calculation. The mean follow-up duration was 81.4 ± 50.6 months (range, 15–227 months). All participants exhibited pure tone averages exceeding 100 dB HL at frequencies of 500 Hz and 1, 2 and 4 kHz on the non-implanted side, or demonstrated auditory brainstem response thresholds above 90 dB nHL. The distribution of implant types included 49 Medel devices, 3 Australian-manufactured cochlear implants, and 1 Advanced Bionics system from the USA. Each participant had completed a minimum post-implantation period of one year. Clinical examination confirmed normal vestibular, oculomotor and neuromuscular function in all subjects who demonstrated satisfactory cognitive understanding and ability to follow instructions. Patient demographics and clinical characteristics are presented in Table 1.
The information of recipients

Table 1 Long description
The table compares vestibular test completion and questionnaire responses between subjects with enlarged vestibular aqueducts and those without inner-ear malformations. Most subjects in both groups completed caloric, video head impulse, and vestibular-evoked myogenic potential tests. However, the Pediatric Vestibular Symptom Questionnaire and Dizziness Handicap Inventory were less frequently completed, particularly in the enlarged vestibular aqueduct group. Implant types varied, with Medel and Cochlear being common, and implant durations ranged from 15 to 227 months. The data suggests a trend of consistent test completion across both groups, with some variability in questionnaire responses, potentially influenced by age and implant duration.
A1–A27, subjects in the enlarged vestibular aqueduct group; B1–B26, subjects in the no inner-ear malformations group; Yes, the corresponding test was performed or the questionnaire was completed; No, the corresponding test was not performed or the questionnaire was not completed
Vestibular assessment protocol
Caloric testing
Participants were evaluated in a supine position with 30° head elevation to achieve optimal positioning of the lateral semicircular canals. Bilateral thermal stimulation was administered using an air caloric irrigator system (Micromedical Technologies Inc., Chatham, IL, USA), applying cool (24°C) and warm (50°C) air stimuli. Each irrigation lasted 60 seconds, and an inter-irrigation interval of 2–3 minutes was allowed between stimulations to monitor for vertigo or residual nystagmus before the next irrigation. Eye movement recordings were obtained through videonystagmography (VisualEyesTM VNG, Micromedical Technologies Inc.). Assessment parameters included maximum slow phase velocity means and unilateral weakness calculations. Decreased semicircular canal function was indicated by either mean slow phase velocity below 12°/second or unilateral weakness exceeding 25 per cent. The presence of either criterion constituted a positive caloric test result. Unilateral weakness calculations incorporated the formula: unilateral weakness = |(right cool + right warm) – (left cool + left warm)|/(right cool + right warm + left cool + left warm) × 100 per cent.Reference Dhondt, Dhooge and Maes16
Vestibular-evoked myogenic potential evaluation
Testing utilised SmartEP equipment (Intelligent Hearing Systems, Miami, FL, USA) with air-conducted 500-Hz tone bursts at 105 dB nHL delivered via insert earphones. Electrode impedance was maintained below 5 kΩ, with integrated EMG (Electromyogram) correction enabled. Testing accommodated participant comfort, with adults seated upright and younger subjects supported by caregivers. For cervical vestibular-evoked myogenic potential, participants rotated their heads contralaterally to the stimulated ear. Sternocleidomastoid muscle activation was monitored between 30 and 70 μV, recording ipsilateral responses. Analysis identified P1 (positive peak, ∼13 ms) and N1 (negative peak, ∼23 ms). Absence of reproducible waveforms after triple stimulation indicated non-response. Ocular vestibular-evoked myogenic potential required sustained upward gaze at 45–60° while minimising blink artifacts. Contralateral recording identified N1 (∼10 ms) and P1 (∼15 ms) components. The amplitude asymmetry ratio calculation was |(right − left)|/(right + left) × 100 per cent. Results were considered abnormal with asymmetry ratio greater than 0.34 or absent reproducible responses.
Video head impulse test
The evaluation of vestibular function was conducted using the EyeSeeCam system (EyeSeeCam, Interacoustics Inc., Assens, Denmark) to evaluate semicircular canal function through the video head impulse test. Testing was performed with participants seated 1.5 m from a visual target in a well-illuminated room, with their back toward the examiner. Specialised goggles containing motion sensors were fitted to each participant. All necessary cables were secured and the visual target height was matched to the participant’s eye level. Calibration proceeded using a five-point laser system for horizontal and vertical eye movements, following the Eye-in-Space diagram protocol. The system recorded eye and head movement velocities (°/second) during the 700 ms post-impulse interval. Recordings were considered invalid and excluded when the participant blinked or failed to maintain fixation on the visual target during head impulses.
To minimise bias and improve recording quality, participants were repeatedly reminded to maintain attention and keep their gaze fixed on the target throughout testing. To prevent anticipatory responses, head impulses were delivered with varying timing and direction. For horizontal canal testing, head movement parameters included peak velocities exceeding 150°/second and rotation angles of 10–20°.Reference Halmagyi, Chen, MacDougall, Weber, McGarvie and Curthoys17 Vertical canal assessment utilised peak velocities above 100°/second within the same angular range. The vestibulo-ocular reflex gain was automatically generated by the system software and calculated as the ratio of eye velocity to head velocity. Gain values were considered abnormal when horizontal canal measurements fell below 0.8 or anterior/posterior canal measurements were under 0.7. Bilateral assessment was performed, with dysfunction diagnosed if either ear demonstrated abnormal values.
Vertigo assessment scales
Two validated instruments were employed for symptom evaluation. Because the Pediatric Vestibular Symptom Questionnaire is intended for children aged 6–17 years and the Dizziness Handicap Inventory is designed for adults, these questionnaires were administered according to age applicability rather than uniformly across all participants. In Table 1, ‘Pediatric Vestibular Symptom Questionnaire completed’ and ‘Dizziness Handicap Inventory completed’ indicate whether the corresponding questionnaire was completed by the participant.
Dizziness Handicap Inventory
This assessment tool evaluates vertigo’s impact on adult quality of life through 25 items: 9 emotional, 9 functional and 7 physical components. Responses are scored as follows: yes (4 points), sometimes (2 points) and none (0 points), yielding a maximum score of 100. Impact severity is classified as mild (0–30), moderate (31–60) or severe (61–100).
Pediatric Vestibular Symptom Questionnaire
Designed for children aged 6–17 years, this instrument comprises 10 multiple-choice questions assessing vestibular symptom severity. Each item uses a 0–3 scale (never to most of the time). Responses were obtained through collaborative discussion between children and their guardians.
Statistical methodology
Data analysis was performed using Statistical Program in Social Science, version 25. Continuous variables were presented as mean ± standard deviation. Multiple-group comparisons utilised one-way analysis of variance, while two-group comparisons employed t-tests. Categorical data were expressed as percentages and analysed using chi-square tests. Statistical significance was set at p less than 0.05.
Results
The study encompassed 53 participants (31 males, 22 females) ranging from 4 to 29 years old (mean age, 14.0 ± 6.3 years). The participants were divided into two groups: 27 individuals with enlarged vestibular aqueduct who met established diagnostic criteria 1 (age range, 4–26 years; mean, 13.4 ± 6.5 years) and 26 individuals with unremarkable cochlear CT (Computed Tomography) findings who were the group with no inner-ear malformations (age range, 7–29 years; mean, 14.6 ± 6.2 years). In the enlarged vestibular aqueduct group, 13 participants received left-ear implants and 14 received right-ear implants, while in the no inner-ear malformations group, 6 participants underwent left-ear implantation and 20 received right-ear implants. Detailed patient characteristics are presented in Table 1.
Vestibular assessment of implanted side
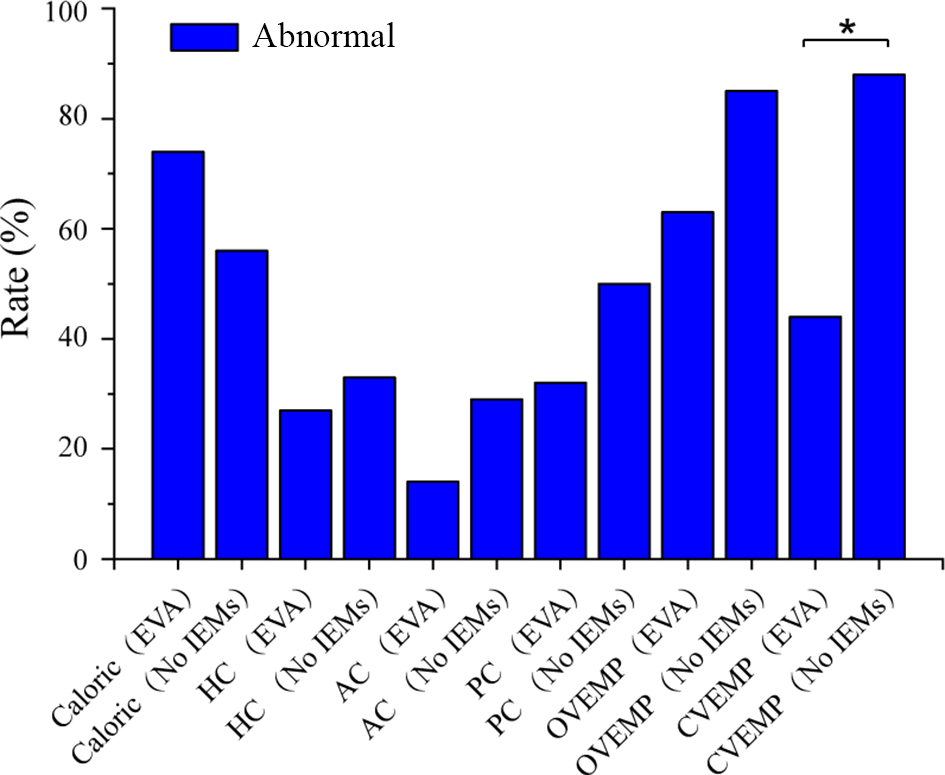
Analysis of vestibular function on the implanted side revealed different abnormality rates between the enlarged vestibular aqueduct and no inner-ear malformations groups (Figure 1). Caloric testing was performed in 48 participants. The abnormal caloric response rate was 74 per cent in the enlarged vestibular aqueduct group and 56 per cent in the no inner-ear malformations group, with no significant difference between the groups (p = 0.195).
Abnormal rates of vestibular tests on the implanted side in the enlarged vestibular aqueduct and no inner-ear malformations groups. *p < 0.05. EVA, enlarged vestibular aqueduct; No IEMS, no inner-ear malformations; HC, horizontal canal; AC, anterior canal; PC, posterior canal; OVEMP, ocular vestibular-evoked myogenic potential; CVEMP, cervical vestibular-evoked myogenic potential.

Figure 1 Long description
A bar graph showing abnormal rates of vestibular tests across various conditions and groups. The x-axis lists the test types and groups: Caloric (EVA), Caloric (No IEMS), HC (EVA), HC (No IEMS), AC (EVA), AC (No IEMS), PC (EVA), PC (No IEMS), OVEMP (EVA), OVEMP (No IEMS), CVEMP (EVA), CVEMP (No IEMS). The y-axis represents the rate in percentage, ranging from 0 to 100. The bars indicate varying abnormal rates, with Caloric (EVA) and CVEMP (No IEMS) showing the highest rates, while AC (No IEMS) shows the lowest. An asterisk marks a significant difference between CVEMP (EVA) and CVEMP (No IEMS).
The abnormality rates in the video head impulse test were also comparable between the groups: 27 versus 33 per cent for the horizontal canal (p = 0.655), 14 versus 29 per cent for the anterior canal (p = 0.359) and 32 versus 50 per cent for the posterior canal (p = 0.211).
For ocular vestibular-evoked myogenic potential, the abnormality rate was 63 per cent in the enlarged vestibular aqueduct group and 85 per cent in the no inner-ear malformations group, without a significant between-group difference (p = 0.074). However, the abnormal cervical vestibular-evoked myogenic potential rate was significantly lower in the enlarged vestibular aqueduct group than in the no inner-ear malformations group (44 vs 88 per cent, p = 0.001).
Vestibular assessment of non-implanted side
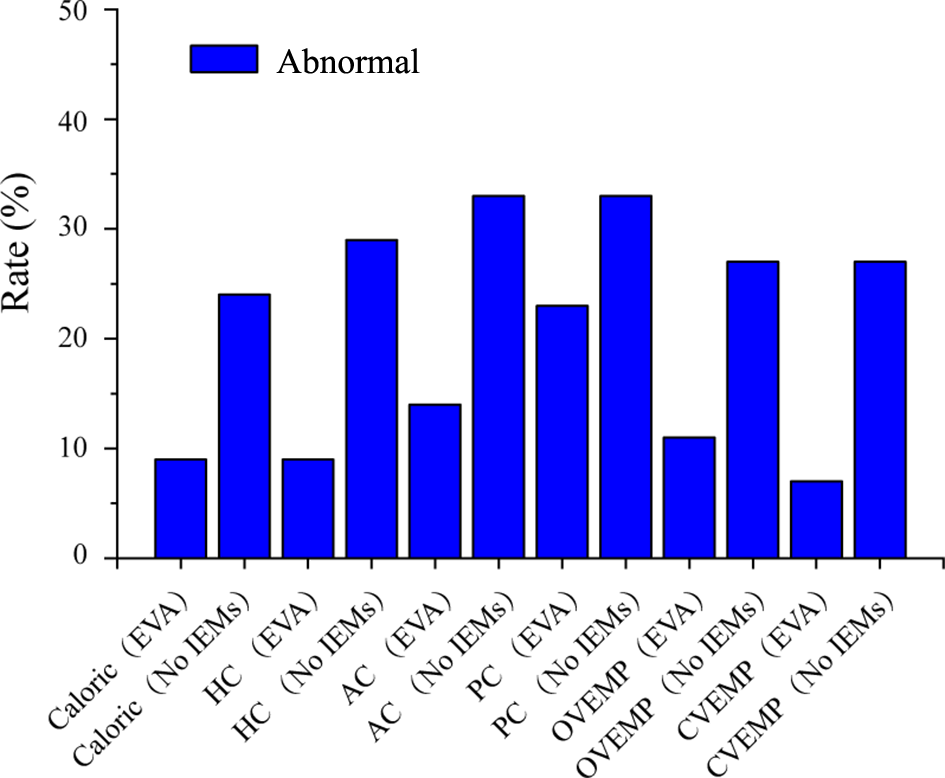
Evaluation of the non-implanted side showed the abnormality rates of vestibular tests in the enlarged vestibular aqueduct and no inner-ear malformations groups, as presented in Figure 2.
Abnormal rates of vestibular tests on the non-implanted side in the enlarged vestibular aqueduct and no inner-ear malformations groups. EVA, enlarged vestibular aqueduct; No IEMS, no inner-ear malformations; HC, horizontal canal; AC, anterior canal; PC, posterior canal; OVEMP, ocular vestibular-evoked myogenic potential; CVEMP, cervical vestibular-evoked myogenic potential.

Figure 2 Long description
A bar graph showing the abnormality rates of vestibular tests. The x-axis lists various tests and conditions: Caloric (EVA), Caloric (No IEMS), HC (EVA), HC (No IEMS), AC (EVA), AC (No IEMS), PC (EVA), PC (No IEMS), OVEMP (EVA), OVEMP (No IEMS), CVEMP (EVA), CVEMP (No IEMS). The y-axis represents the rate in percentage, ranging from 0 to 40 percent. Each bar represents the abnormality rate for the corresponding test and condition.
The abnormal caloric response rate was 9 per cent in the enlarged vestibular aqueduct group and 24 per cent in the no inner-ear malformations group, with no significant difference (p = 0.303).
The abnormality rates of the video head impulse test were also similar between groups: 9 versus 29 per cent for horizontal canal (p = 0.179), 14 versus 33 per cent for the anterior canal (p = 0.118) and 23 versus 33 per cent for the posterior canal (p = 0.425).
For the vestibular-evoked myogenic potential, the abnormal ocular vestibular-evoked myogenic potential rate was 11 per cent in the enlarged vestibular aqueduct group and 27 per cent in the no inner-ear malformations group (p = 0.263), while the abnormal cervical vestibular-evoked myogenic potential rates were 7 and 27 per cent, respectively (p = 0.127).
No significant between-group differences were observed on the non-implanted side.
Vestibular assessment of the enlarged vestibular aqueduct group
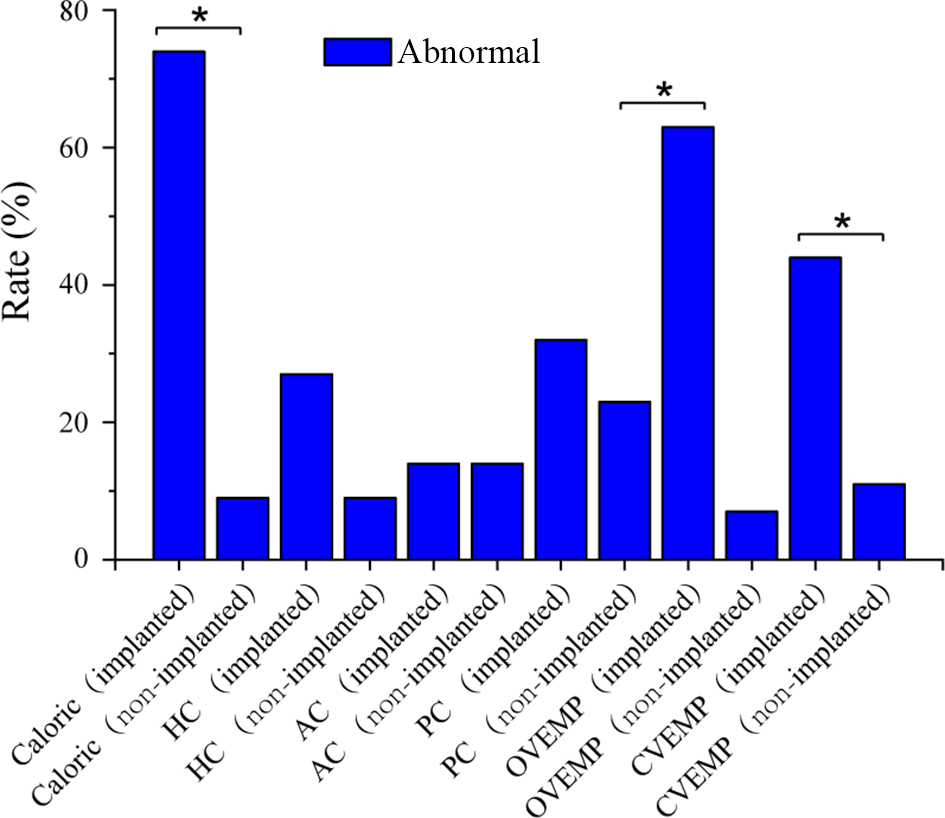
Analysis of vestibular testing in the enlarged vestibular aqueduct group showed different abnormality rates between the implanted and non-implanted sides (Figure 3).
Abnormal rates of vestibular dysfunction between the implanted and non-implanted sides in the enlarged vestibular aqueduct group. *p < 0.05. HC, horizontal canal; AC, anterior canal; PC, posterior canal; OVEMP, ocular vestibular-evoked myogenic potential; CVEMP, cervical vestibular-evoked myogenic potential.

Figure 3 Long description
A bar graph illustrating the abnormal rates of vestibular dysfunction between implanted and non-implanted sides. The x-axis lists different tests: Caloric, HC, AC, PC, OVEMP and CVEMP, each with implanted and non-implanted categories. The y-axis represents the rate in percentage. Notable differences are marked with an asterisk, indicating significant differences in rates between the implanted and non-implanted sides for Caloric, PC and CVEMP tests.
The abnormal caloric response rate was significantly higher on the implanted side than on the non-implanted side (74 vs 9 per cent, p < 0.05).
No significant side-to-side differences were observed in video head impulse test abnormality rates for the horizontal canal (27 vs 9 per cent, p = 0.241), the anterior canal (14 vs 14 per cent, p = 1.000) and the posterior canal (32 vs 23 per cent, p = 0.498).
Significant differences were observed in vestibular-evoked myogenic potential abnormality rates: the abnormal ocular vestibular-evoked myogenic potential rate was 63 per cent on the implanted side and 7 per cent on the non-implanted side (p < 0.05), while the abnormal cervical vestibular-evoked myogenic potential rates were 44 and 11 per cent, respectively (p = 0.006).
Vestibular assessment of the no inner-ear malformations group
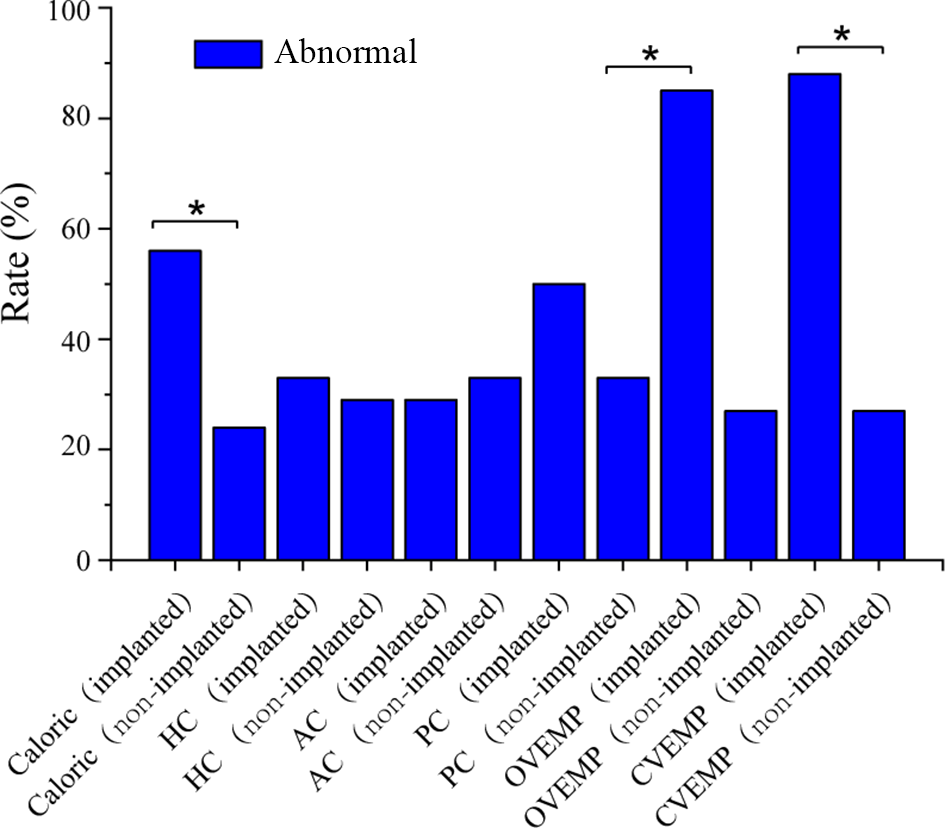
In the no inner-ear malformations group, the abnormality rates of vestibular tests also differed between the implanted and non-implanted sides (Figure 4).
Abnormal rates of vestibular dysfunction between the implanted and non-implanted sides in the no inner-ear malformations group. *p < 0.05. Group comparisons by chi-square test; significance set at p < 0.05. HC, horizontal canal; AC, anterior canal; PC, posterior canal; OVEMP, ocular vestibular-evoked myogenic potential; CVEMP, cervical vestibular-evoked myogenic potential.

Figure 4 Long description
The y-axis is labeled 'Rate (percent)'. The x-axis includes categories: Caloric (implanted, non-implanted), HC (implanted, non-implanted), AC (implanted, non-implanted), PC (implanted, non-implanted), OVEMP (implanted, non-implanted), CVEMP (implanted, non-implanted). Significant differences are marked with an asterisk. The highest rates are observed in CVEMP (implanted) and OVEMP (implanted).
The abnormal caloric response rate was significantly higher on the implanted side than on the non-implanted side (56 vs 24 per cent, p = 0.021).
No significant side-to-side differences were found in video head impulse test abnormality rates for the horizontal canal (33 vs 29 per cent, p = 0.755), the anterior canal (29 vs 33 per cent, p = 0.755) and the posterior canal (50 vs 33 per cent, p = 0.242).
Significant differences were observed for vestibular-evoked myogenic potential: the abnormal ocular vestibular-evoked myogenic potential rate was 85 per cent on the implanted side and 27 per cent on the non-implanted side (p < 0.05), and the abnormal cervical vestibular-evoked myogenic potential rates were 88 and 27 per cent, respectively (p < 0.05).
Discussion
Cochlear implant surgery, while established as a primary intervention for profound to severe hearing impairment,Reference Singh, Ramamourthy, Hage and Kappagantu18 has sparked increasing research interest regarding its post-operative effects on vestibular function. Current literature predominantly focuses on vestibular changes within the first post-operative year, leaving long-term impacts relatively unexplored. This research examined multiple vestibular assessment methods, including caloric testing, vestibular-evoked myogenic potential, the video head impulse test and patient-reported outcomes through the Dizziness Handicap Inventory and the Pediatric Vestibular Symptom Questionnaire, yielding significant insights while identifying areas requiring further investigation.
The vestibular system comprises peripheral and central components. Peripheral structures encompass the utricle, semicircular canals, saccule and vestibular nerve, while central elements include the vestibular nucleus, ascending projection fibres and cortical vestibular regions. These signals travel via vestibular pathways to reach the brain’s processing centres.Reference Jang, Kim, Choo, Park and Choung19 Different diagnostic tools assess specific aspects of vestibular function. The cervical vestibular-evoked myogenic potential evaluates saccular function through the vestibulocollic reflex, offering insights into immediate post-operative dizziness and rehabilitation potential. The ocular vestibular-evoked myogenic potential and video head impulse test examine vestibulo-ocular pathways, with the ocular vestibular-evoked myogenic potential specifically assessing utricular function and its role in gaze stabilisation.Reference Jacot, Van Den Abbeele, Debre and Wiener-Vacher20 Caloric testing provides information about horizontal semicircular canal function in the low-frequency domain.Reference Bittar, Sato, Silva-Ribeiro, Oiticica, Mezzalira and Tsuji21
In addition, research indicates that Dizziness Handicap Inventory scores do not correlate significantly with objective vestibular measurements,Reference Obeidat, Bell and Julie22 therefore this investigation incorporated both objective assessments (video head impulse test, caloric testing, cervical vestibular-evoked myogenic potential, ocular vestibular-evoked myogenic potential) and subjective questionnaires (the Dizziness Handicap Inventory and the Pediatric Vestibular Symptom Questionnaire) to comprehensively evaluate post-cochlear implant vestibular outcomes. This approach enabled thorough assessment of various vestibular components while considering patients’ reported experiences.
Research findings demonstrated distinct variations in vestibular function between the implanted and non-implanted sides. In the implanted side, the results of caloric testing and cervical vestibular-evoked myogenic potential revealed a marked difference in both the enlarged vestibular aqueduct and the no inner-ear malformations groups. However, the results of the ocular vestibular-evoked myogenic potential test and the video head impulse test showed no significant difference in the enlarged vestibular aqueduct group. In addition, caloric results, vestibular-evoked myogenic potential testing and video head impulse test analysis across all canals showed no significant differences between the enlarged vestibular aqueduct and no inner-ear malformations groups in the non-implanted side. These findings align with previous investigations of post-cochlear implant vestibular changes, where caloric and vestibular-evoked myogenic potential responses showed impairment while video head impulse test measurements remained stable.Reference Guan, Wang, Wu, Zhang, Sun and Guo3
The preserved video head impulse test results suggest high-frequency canal function may be less vulnerable to cochlear implant-induced trauma, aligning with prior reports.Reference Bittar, Sato, Silva-Ribeiro, Oiticica, Mezzalira and Tsuji21, Reference Devroede, Pauwels, Le Bon, Monstrey and Mansbach23–Reference Wang, Chao, Luo, Zhang, Xu and Liu25 The superior saccular preservation in enlarged vestibular aqueduct patients may stem from anatomical buffering by the enlarged aqueduct, mitigating endolymphatic pressure changes during cochlear implant insertion. The temporal aspects of post-cochlear implant vestibular assessment warrant further investigation. Furthermore, current research follow-up periods vary substantially, ranging from 48 hoursReference Batuecas-Caletrio, Klumpp, Santacruz-Ruiz, Benito Gonzalez, Gonzalez Sanchez and Arriaga4 to 24 months.Reference Coordes, Ernst, Brademann and Todt26 While meta-analyses indicate vestibular function recovery in approximately 25 per cent of patients within 3 months post-surgery,Reference Abouzayd, Smith, Moreau and Hitier27 some studies report persistent dysfunction beyond 6 months.Reference Psillas, Pavlidou, Lefkidis, Vital, Markou and Triaridis28 These findings suggest that cochlear implant-induced damage to otolithic organs and low-frequency semicircular canals may be resistant to long-term vestibular compensation, potentially resulting in permanent functional impairment.
The investigation of post-cochlear implantation vestibular function revealed distinct patterns between the enlarged vestibular aqueduct and no inner-ear malformations groups. Subjective symptom assessment using age-appropriate questionnaires (the Dizziness Handicap Inventory and the Pediatric Vestibular Symptom Questionnaire) was performed in applicable participants; however, these data were not uniformly available across the cohort, limiting formal comparative analysis.
Research by Ibrahim and colleaguesReference Ibrahim, da Silva, Segal and Zeitouni9 demonstrated that 84.4 per cent of recipients maintained stable Dizziness Handicap Inventory scores post-surgery. Multiple studiesReference Robard, Hitier, Lebas and Moreau29–Reference Krause, Wechtenbruch, Rader and Gürkov31 have established that vestibular dysfunction following cochlear implantation does not necessarily correlate with patient-reported dizziness symptoms. Our objective findings revealed that caloric responses showed comparable abnormality rates between enlarged vestibular aqueduct and no inner-ear malformations subjects. The results of the video head impulse test exhibited similar impairment patterns across both groups. Vestibular-evoked myogenic potential analysis yielded notable distinctions, with cervical vestibular-evoked myogenic potential abnormalities occurring in 44 per cent of enlarged vestibular aqueduct cases versus 88 per cent in no inner-ear malformations subjects, highlighting unique vestibular characteristics in enlarged vestibular aqueduct patients.
Wang et al.’s researchReference Wang, Chao, Luo, Zhang, Xu and Liu25 comparing vestibular outcomes between enlarged vestibular aqueduct and typical cochlea in paediatric implant recipients found that while normal patients showed increased vestibular-evoked myogenic potential abnormalities post-implantation, enlarged vestibular aqueduct patients maintained relatively stable responses. Previous research through caloric testing, rotational chair analysis and vestibular-evoked myogenic potentials has frequently identified vestibular alterations post-implantation.Reference Yan, Zong, Han, Li, Qiao and Wang11, Reference Dhondt, Maes, Vanaudenaerde, Martens, Rombaut and Van Hecke12, Reference Jacot, Van Den Abbeele, Debre and Wiener-Vacher20, Reference Wang, Chao, Luo, Zhang, Xu and Liu25, Reference Nayak, Kellermeyer, Dornton, Heyd, Kim and Wazen32 Research examining post-implantation temporal bone specimens has revealed several pathological alterations in vestibular structures, including saccular fibrosis intra labyrinthine effusion, saccular and utricular atrophy, vestibular fibrotic changes and bone formation.Reference Katsiari, Balatsouras, Sengas, Riga, Korres and Xenelis6, Reference Handzel, Burgess and Nadol8, Reference Cozma, Dima-Cozma, Radulescu, Hera, Martu and Olariu33, Reference Rajan, Kontorinis and Kuthubutheen34
The impact of the surgery itself on the inner-ear structure, along with electrode implantation and electrical stimulation, may have affected the patients’ vestibular function. However, patients with an enlarged vestibular aqueduct were less affected compared with those with no inner-ear malformations. This could be attributed to the fact that the presence of the third window in the inner ear during cochlear implantation buffered the significant changes in endolymph pressure and environment.
Despite careful control of variables, this study has limitations, including a relatively modest sample size that may not encompass all potential confounding factors and individual variations. While our follow up extended beyond 12 months, more precise monitoring of long-term vestibular function changes would be beneficial. Future investigations should consider expanding the participant pool, implementing regular vestibular function assessments, and incorporating advanced imaging and neurophysiological techniques to better understand the mechanisms underlying post-cochlear implant vestibular changes, ultimately informing more targeted clinical interventions and rehabilitation strategies. In addition, no formal a priori power calculation was performed, which should be considered when interpreting the statistical findings.
Considering the crucial role of vestibular function in maintaining balance, spatial orientation and overall quality of life, clinical decision-making regarding cochlear implant candidacy demands meticulous consideration.
• Cochlear implantation may lead to post-operative vestibular dysfunction
• Long-term vestibular outcomes in recipients with enlarged vestibular aqueduct remain insufficiently characterised
• This study compared long-term vestibular function between recipients with an enlarged vestibular aqueduct and those without inner-ear malformations
• Better preservation of saccular function was observed in the enlarged vestibular aqueduct group compared with the no inner-ear malformations group
Conclusions
In summary, cochlear implant can lead to impairment of the otolith organs and low-frequency semicircular canals. Moreover, the body fails to achieve vestibular compensation over an extended period. Notably, patients with an enlarged vestibular aqueduct present a distinct scenario compared with those with no inner-ear malformations. After cochlear implant, enlarged vestibular aqueduct patients are more likely to retain better saccular function. These findings advocate for pre-cochlear implant vestibular counselling in enlarged vestibular aqueduct patients, emphasising their unique saccular resilience.
Acknowledgements
This work was supported by the National Natural Science Foundation of China (Grants 82301299, 82271180, 82471179 and 82471162). The authors thank all the participants who took part in the study.
Data availability statement
The data of this study are available from the corresponding authors upon reasonable request.
Competing interests
None declared.