


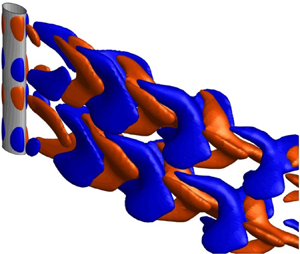


1. Introduction
Flow past a bluff body has been widely investigated, due to its significance in engineering applications such as suspension bridges, tubes in heat exchangers, undersea pipelines and offshore platforms. A slender cylinder with a circular or square cross-section, considered as the basic model for the bluff bodies, has attracted vast attention in fundamental research (e.g. Williamson Reference Williamson1996; Bai & Alam Reference Bai and Alam2018; Abdelhamid, Alam & Islam Reference Abdelhamid, Alam and Islam2021); meanwhile, a slender cylinder with an elliptic cross-section has also been paid a great deal of attention (e.g. Shintani, Umemura & Takano Reference Shintani, Umemura and Takano1983; Paul et al. Reference Paul, Prakash, Vengadesan and Pulletikurthi2016; Shi, Alam & Bai Reference Shi, Alam and Bai2020). The flow around a slender cylinder with these different cross-sections exhibits a distinct near-wake dynamics, fluid force behaviour, Reynolds number dependence, etc. (e.g. Alam Reference Alam2014; Derakhshandeh & Alam Reference Derakhshandeh and Alam2019; Alam, Abdelhamid & Sohankar Reference Alam, Abdelhamid and Sohankar2020; Rastan & Alam Reference Rastan and Alam2021; Chen et al. Reference Chen, Ji, Alam, Xu, An, Tong and Zhao2022; Rastan et al. Reference Rastan, Alam, Zhu and Ji2022). Further surface modification of a slender cylinder (with either a circular, square or elliptic cross-section) into a sinusoidal waveform along the spanwise direction can significantly alter the near wake as well as fluid forces (e.g. Ahmed & Bays-Muchmore Reference Ahmed and Bays-Muchmore1992; Bearman & Owen Reference Bearman and Owen1998; Lam & Lin Reference Lam and Lin2008; Lin et al. Reference Lin, Bai, Alam, Zhang and Lam2016; Assi & Bearman Reference Assi and Bearman2018). A cylinder with such a wavy surface is called a wavy cylinder, which has been considered as one of the approaches to control the bluff-body flow in order to reduce fluid forces and/or suppress flow-induced vibration (FIV) (e.g. Beem & Triantafyllou Reference Beem and Triantafyllou2015; Lin et al. Reference Lin, Bai, Alam, Zhang and Lam2016; Assi & Bearman Reference Assi and Bearman2018).
There are extensive numerical and experimental investigations on the flow past a wavy cylinder with a circular cross-section. The wavy circular cylinder is realized by changing its diameter sinusoidally along its span, with a wavelength λ, wave amplitude or waviness a and mean hydraulic diameter Dm. Sections of the maximum and minimum diameters are denoted as the node and saddle, respectively. Due to the geometry modification, near-wake structures of the wavy circular cylinder significantly vary along the span, exhibiting distinct three-dimensional characteristics. For wavy circular cylinders with a relatively short wavelength λ/Dm (<6), narrow and wide wakes are generated at the node and saddle planes, respectively, in both laminar and subcritical flow regimes (Ahmed & Bays-Muchmore Reference Ahmed and Bays-Muchmore1992; Ahmed, Khan & Bays-Muchmore Reference Ahmed, Khan and Bays-Muchmore1993; Lam et al. Reference Lam, Wang, Li and So2004a; Lam, Wang & So Reference Lam, Wang and So2004b; Zhang, Daichin & Lee Reference Zhang, Daichin and Lee2005; Lee & Nguyen Reference Lee and Nguyen2007; Lam & Lin Reference Lam and Lin2008, Reference Lam and Lin2009; New, Shi & Liu Reference New, Shi and Liu2013, Reference New, Shi and Liu2015). The wave amplitude used in these studies covers a range of a/Dm = 0.02–0.3. The occurrence of narrow and wide wakes at the node and saddle planes is ascribed to delayed and advanced flow separation, respectively (Ahmed & Bays-Muchmore Reference Ahmed and Bays-Muchmore1992; Lam & Lin Reference Lam and Lin2008, Reference Lam and Lin2009). A pair of counter-rotating streamwise vortices are formed downstream of the node, as revealed in flow visualization (Ahmed & Bays-Muchmore Reference Ahmed and Bays-Muchmore1992; Lam et al. Reference Lam, Wang and So2004b), particle image velocimetry (PIV) measurements (Zhang et al. Reference Zhang, Daichin and Lee2005) and numerical simulations (Lam & Lin Reference Lam and Lin2008, Reference Lam and Lin2009). Due to the rolling up of streamwise vortices in the cross-stream plane, shear layers separating from the wavy cylinder are retarded to develop into matured spanwise vortices, resulting in an elongated vortex formation length and a reduced frequency of vortex shedding (Lam et al. Reference Lam, Wang, Li and So2004a,Reference Lam, Wang and Sob; Lam & Lin Reference Lam and Lin2008, Reference Lam and Lin2009). Furthermore, it has been found that time-mean drag and fluctuating lift forces can be drastically reduced at an optimal λ/Dm ≈ 2 where the reduction is up to 16 % in the time-mean drag (Lam et al. Reference Lam, Wang, Li and So2004a; Lee & Nguyen Reference Lee and Nguyen2007; Lam & Lin Reference Lam and Lin2008, Reference Lam and Lin2009) and 93 % in the fluctuating lift (Lam & Lin Reference Lam and Lin2008, Reference Lam and Lin2009).
For wavy circular cylinders with a relatively large wavelength λ/Dm (≥6), narrow and wide wakes are produced in the saddle and node planes, respectively, in both laminar and subcritical flow regimes (Owen, Szewezyk & Bearman Reference Owen, Szewezyk and Bearman2000; Lam & Lin Reference Lam and Lin2009; Lin et al. Reference Lin, Bai, Alam, Zhang and Lam2016; Bai et al. Reference Bai, Alam, Gao and Lin2019a; Bai, Zang & New Reference Bai, Zang and New2019b). This is ascribed to earlier flow separation at the node than the saddle (Lam & Lin Reference Lam and Lin2009; Lin et al. Reference Lin, Bai, Alam, Zhang and Lam2016), which is opposite to the flow separation scenario for λ/Dm < 6. An optimal wavelength λ/Dm ≈ 6 is identified, providing a profound reduction in fluid forces (Lin et al. Reference Lin, Bai, Alam, Zhang and Lam2016). At this optimal λ/Dm (≈6), streamwise vortices generated by the nodes appear well organized and parallel to the spanwise direction, distinct from that at λ/Dm < 6 characterized by vigorous interactions between streamwise vortices in the near wake. As such, shear layers separating from the cylinder at λ/Dm ≈ 6 are stabilized and their rolling up into matured spanwise vortices is inhibited to the greatest extent, yielding a reduced vortex shedding frequency and an elongated vortex formation length. Moreover, dominant hairpin-like vortical structures downstream of the saddle were detected by Bai et al. (Reference Bai, Alam, Gao and Lin2019a) using three-dimensional proper orthogonal decomposition.
Flow around the wavy cylinder with a square cross-section has been studied experimentally and numerically in the literature. The wavy surface was implemented on the front face (Bearman & Owen Reference Bearman and Owen1998), on both front and rear faces (Darekar & Sherwin Reference Darekar and Sherwin2001a,Reference Darekar and Sherwinb; Ling & Lin Reference Ling and Lin2008; Lin, Bai & Alam Reference Lin, Bai and Alam2015) or on both lateral side faces (Lam et al. Reference Lam, Lin, Zou and Liu2012; Lin et al. Reference Lin, Bai and Alam2015). Based on experimental tests, Bearman & Owen (Reference Bearman and Owen1998) at a Reynolds number Re = 4 × 10⁴ found that the front-face-wavy square cylinder with a wavelength λ/Dm = 5.6 and a waviness a/Dm = 0.25 can completely suppress vortex shedding and substantially reduce time-mean drag force by up to 30 %. For the front- and rear-face-wavy square cylinder (λ/Dm = 1–10, a/Dm ≤ 0.75), Darekar & Sherwin (Reference Darekar and Sherwin2001a,Reference Darekar and Sherwinb) and Ling & Lin (Reference Ling and Lin2008) in numerical simulations (Re = 10–180) observed pairs of opposite-sign streamwise vortices along the spanwise direction, associated with wide and narrow wakes at the saddle and node planes, respectively. It was further found that the wavy cylinder with λ/Dm = 5.6 can attain a time-mean drag reduction of up to 16 % at a/Dm = 0.129–0.168 (Re = 100), 21.6 % at a/Dm = 0.167 (Re = 100) and 25.7 % at a/Dm = 0.167 (Re = 180). At a high Re = 2.2 × 10⁴, Lin et al. (Reference Lin, Bai and Alam2015) numerically investigated the flow past the front- and rear-face-wavy square cylinder (λ/Dm = 6, a/Dm = 0.15) and observed a similar scenario of wide and narrow wakes at the saddle and node planes, respectively. The force reduction is, however, marginal (2.4 %) in the time-mean drag and considerable (32.1 %) in the fluctuating lift. When both lateral side faces are modified into a waveform (Lam et al. Reference Lam, Lin, Zou and Liu2012; Lin et al. Reference Lin, Bai and Alam2015), the wavy cylinder with λ/Dm = 6 and a/Dm = 0.15 generates wider and narrower wakes at the node and saddle planes, respectively, which is opposite to that occurring for the front- and rear-face-wavy square cylinder. Considerable reductions in both time-mean (8.7 %) and fluctuating lift (78.2 %) were achieved.
Recently, it has been noticed that, because of their unique morphology and associated ability to suppress FIV, the whiskers of a harbour seal play a role in detecting the trajectory of prey (Hanke et al. Reference Hanke, Witte, Miersch, Brede, Oeffner, Michael, Hanke, Leder and Dehnhardt2010). A harbour seal whisker (figure 1) features an elliptic cross-section, an undulating or wavy surface along the spanwise direction and, interestingly, a slight shift between the undulation of the leading and trailing edges. This results in an angle of incidence between the elliptic cross-section and the plane normal to the whisker axis. For the harbour seal whisker used by Hanke et al. (Reference Hanke, Witte, Miersch, Brede, Oeffner, Michael, Hanke, Leder and Dehnhardt2010), the aspect ratio (AR) of the elliptic cross-section, defined as the ratio between the minor axis and the major axis, is AR ≈ 0.6 and 0.4 for the node and saddle sections, respectively, while the incidence angle of the elliptic cross-section is α = 17.6° and β = 15.27° at the saddle and node sections, respectively. The wavelength of the wavy surface is λ/Dm ≈ 3.4, where Dm is the mean hydraulic diameter of the harbour seal whisker. The flow past a seal-whisker-based wavy elliptic cylinder has received much attention in the fluid dynamics community (e.g. Hanke et al. Reference Hanke, Witte, Miersch, Brede, Oeffner, Michael, Hanke, Leder and Dehnhardt2010; Beem & Triantafyllou Reference Beem and Triantafyllou2015; Wang & Liu Reference Wang and Liu2016; Jie & Liu Reference Jie and Liu2017; Rinehart, Shyam & Zhang Reference Rinehart, Shyam and Zhang2017; Assi & Bearman Reference Assi and Bearman2018). Based on force and flow measurements (Re = 186–535) and numerical simulations (Re = 500), Hanke et al. (Reference Hanke, Witte, Miersch, Brede, Oeffner, Michael, Hanke, Leder and Dehnhardt2010) observed that primary spanwise vortices shed from the seal whisker model were considerably suppressed, accompanied by an elongated vortex formation length, a reduced time-mean drag (~40 %) and a suppressed fluctuating lift (>90 %), compared with the straight circular cylinder counterparts. For a seal whisker model with a similar AR to that in Hanke et al. (Reference Hanke, Witte, Miersch, Brede, Oeffner, Michael, Hanke, Leder and Dehnhardt2010) but with a large λ/Dm ≈ 7.5, Beem & Triantafyllou (Reference Beem and Triantafyllou2015) conducted FIV experiments in a water tunnel at Re = 1.1 × 10³–2.1 × 10⁴ and observed substantial suppressions of FIV and incoherent structures in the near wake. Furthermore, the near-wake structures of the seal-whisker-based wavy elliptic cylinder (AR ≈ 0.6 and 0.4, α = 17.6° and β = 15.27°, λ/Dm ≈ 2.8) were extensively investigated by Wang & Liu (Reference Wang and Liu2016) and Jie & Liu (Reference Jie and Liu2017) using proper orthogonal and dynamic mode decompositions, based on time-resolved PIV measurements (Re = 1.8 × 10³) and numerical simulations (Re = 1.8 × 10⁴). They observed intensified three-dimensional vortical structures, and significant reductions in turbulent intensities, velocity correlations and fluctuating lift (~79.2 %), compared with those for a straight circular cylinder. Two different frequencies of vortex shedding were identified at the saddle and node planes.
Photograph of harbour seal (Phoca vitulina) vibrissae (adapted from Hanke et al. (Reference Hanke, Witte, Miersch, Brede, Oeffner, Michael, Hanke, Leder and Dehnhardt2010); A, top view; B, front view).

It has been demonstrated that the seal-whisker-based wavy elliptic cylinder can significantly alter the near-wake structure that, albeit with incoherent structures, appears more stable and is thus associated with an elongated vortex formation length and significantly reduced fluid forces, compared with their straight cylinder counterparts. However, the seal-whisker-based cylinder model involves several morphological parameters including the aspect ratio (AR) of the elliptic cross-section, the angle of incidence (α, β) of the elliptic cross-section and the spanwise wavelength (λ). Based on an extensive investigation of 27 whiskers of the harbour seal and elephant seal, Rinehart et al. (Reference Rinehart, Shyam and Zhang2017) noticed large deviations in these key parameters, particularly in the angle of incidence. Therefore, some interesting questions arise. For example, which parameter is predominantly important or critical for the seal-whisker-based cylinder model to alter the near wake? Are there optimal parameters for the seal-whisker-based cylinder model to attain the largest reduction in fluid forces? Could it be possible to propose a simplified but generalized model of bluff bodies, based on the inspiration of the harbour seal whisker? With an attempt to assimilate three-dimensional effects on the near wake, Assi & Bearman (Reference Assi and Bearman2018) suggested a novel wavy elliptic cylinder with sinusoidal waviness in two orthogonal planes along the spanwise direction with a phase shift of 90°. The aspect ratio of the elliptic cross-section is AR = 0.67 and the wavelength is λ/Dm = 5 in Assi & Bearman (Reference Assi and Bearman2018) (Re = 1.5 × 10³–1.5 × 10⁴). A reduction of 12.5 % in time-mean drag was obtained when the cylinder was fixed. There was no further exploration of the effects of the cylinder parameters on the flow and forces.
The present work aims to investigate the near wake of a wavy elliptic cylinder, a simplified model of the harbour seal whisker. Here, we form the wavy elliptic cylinder by sinusoidally changing the minor axis of a straight elliptic cylinder while keeping the major axis constant along the spanwise direction. The focus is on the effects of the wavelength on the near wake. Extensive numerical simulations are carried out at a Reynolds number Re = 100 for a wide range of the wavelength (i.e. λ/Dm = 0.43–8.59), with the waviness being fixed at a/Dm = 0.048. The following §§ 2 and 3 introduce the wavy elliptic cylinder model and numerical simulation aspects, respectively. Results and relevant discussion are given in § 4. Comparisons among wavy cylinders of different cross-sectional shapes are made in § 5, followed by the conclusions of this work in § 6.
2. Wavy elliptic cylinder model
Figure 2 shows the schematic of a wavy elliptic cylinder, together with the symbol designations. The wavy surface of the cylinder is formed by sinusoidally varying the minor axis (Dmin) of the elliptic cross-section along the spanwise direction (z), while the major axis (Dmaj) of the elliptic cross-section remains constant. As such, Dmin is given by  ${D_{min}} = {D_m} + 2a\sin (2\mathrm{\pi }z/\lambda )$, where Dm is the mean minor axis of the elliptic cross-sections, λ and a are the wavelength and wave amplitude (or waviness) of the spanwise wave, respectively. The cross-sections with the maximum minor axis (Dn) and minimum minor axis (Ds) are denoted as the node and saddle sections, respectively. The mid-section between the node and saddle sections has the minor axis
 ${D_m} = ({D_n} + {D_s})/2$. The origin of the coordinate system is located at the centre of the elliptic cross-section, with the streamwise x and cross-stream y directions along the major and minor axes, respectively. The attack angle of the wavy elliptic cylinder is thus zero, and the mean minor axis (Dm) of the elliptic cross-sections is the hydraulic diameter of the wavy elliptic cylinder, which will be used as the characteristic length scale for the normalization of different parameters. Streamwise, cross-stream and spanwise velocities are denoted by u, v and w, respectively, with their time-mean and fluctuating values indicated by ‘overbar’
 $(\overline {\, \cdot \,} )$ and ‘prime’ (′), respectively.
(a) Schematic diagram of the wavy elliptic cylinder (WEC) and symbol designation. (b) Top view. (c) Front view.

In the present study, the spanwise wavelength of the wavy elliptic cylinder covers a wide range of λ/Dm = 0.43–8.59 while the wave amplitude is fixed at a/Dm = 0.048. The sectional aspect ratios between the minor and major axes are Dmin/Dmaj = 0.55, 0.5 and 0.45 at the node, middle and saddle sections, respectively. These parameters are mainly based on the harbour seal whisker model from Beem & Triantafyllou (Reference Beem and Triantafyllou2015).
3. Numerical simulation
3.1. Governing equations and numerical method
Three-dimensional simulations are carried out at a Reynolds number Re = 100, based on Dm and free-stream velocity (U∞), to investigate the unsteady laminar flow around the cylinder. The continuity and Navier–Stokes equations for an incompressible Newtonian fluid are solved on structural quadrilateral grids with the finite-volume method in ANSYS Fluent. The governing equations in a dimensionless form can be written as follows:
 \begin{equation}\frac{{\partial {u^\ast }}}{{\partial {t^\ast }}} + ({\boldsymbol{u}^\ast }\boldsymbol{\cdot }\boldsymbol{\nabla }){\boldsymbol{u}^\ast } ={-} \boldsymbol{\nabla }{p^\ast } + \frac{1}{{Re}}{\nabla ^2}{\boldsymbol{u}^\ast },\end{equation}
and
 \begin{equation}\boldsymbol{\nabla }\boldsymbol{\cdot }{\boldsymbol{u}^\ast } = \; 0,\end{equation}
where t*, u* and p* are the dimensionless time, velocity vector (u*, v*, w*) and static pressure, respectively. The superscript ‘*’ denotes normalization based on Dm and/or U∞, unless otherwise stated.
The second-order implicit and upwind differencing schemes are used for the spatial discretization of the pressure and momentum, respectively. In addition, the second-order implicit differencing scheme is applied for temporal discretization. To speed up the convergence of iteration, the method splitting of operators is chosen for the pressure–velocity coupling in the governing equation. The dimensionless time step is set to be  $\Delta {t^\ast } = \Delta t{U_\infty }/{D_m}\; = 0.025$, resulting in a Courant–Friedrichs–Lewy (CFL) number <2.5 in most of the computational domain. Data are recorded for more than 50 periods of vortex shedding after the simulation is converged, ensuring the time independence of the statistical results (such as time-mean and root-mean-square values of the force, surface pressure and velocity fluctuations).
3.2. Computational domain, mesh generation and boundary conditions
Figure 3(a) shows the computational domain, where the wavy elliptic cylinder is located at the symmetry line (y = 0). The inlet and outlet of the computational domain are 20Dm and 40Dm away from the cylinder axis (at x = 0), respectively. The computational domain has a distance of 40Dm between the lateral sides and a distance of 2λ along the spanwise z direction. This results in a low blockage ratio of 2.5 %. In such a computational domain, the effects of the lateral, inlet and outlet boundaries on the near wake of the cylinder can be neglected, as examined by Zheng & Alam (Reference Zheng and Alam2017).
(a) Computational domain and (b) mesh detail.

The entire computational domain is meshed with structural quadrilateral grids in ANSYS ICEM. As shown in figure 3(b), relatively fine grids are generated within a circle of 5Dm radius around the wavy elliptic cylinder. There are a total of 120 grids uniformly distributed along the cylinder circumference, corresponding to spacings of 0.006Dm and 0.01Dm between adjacent grids in the saddle and node sections, respectively. The first grid is 0.01Dm away from the cylinder surface and then the grids are stretched radially by an expansion ratio of 1.003 in the cross-section xy plane. Meanwhile, the grids are uniformly distributed, with a spacing of 0.03Dm, along the spanwise direction; as such, the number of mesh layers is 14 to 286 along the spanwise direction, depending on the wavelength (λ) of the wavy elliptic cylinder. The total number of grids in the entire computational domain ranges from around 0.4 million to 8 million, again depending on λ.
A constant and uniform incoming velocity (i.e. u* = 1, v* = w* = 0) is imposed at the inlet of the computational domain while the outflow boundary condition (i.e.  $\partial {u^\ast }/\partial {x^\ast } = 0$,
 $\partial {v^\ast }/\partial {x^\ast } = 0$,
 $\partial {w^\ast }/\partial {x^\ast } = 0$) is applied at the outlet. The lateral sides are treated as slip boundaries by using the symmetry boundary condition (i.e.
 ${v^\ast } = \; 0$,
 $\partial {u^\ast }/\partial {y^\ast } = 0$,
 $\partial {w^\ast }/\partial {y^\ast } = 0$). The periodic boundary condition is used for the top and bottom sides. In addition, the ‘no-slip’ boundary condition (i.e.
 ${u^\ast } = {v^\ast } = {w^\ast } = 0$) is applied on the cylinder surface.
3.3. Grid independence tests and data validation
The independence tests of grids and time steps are conducted for a straight circular cylinder with a spanwise length  ${L_z} = 3.43{D_m}$. Following Lam & Lin (Reference Lam and Lin2009), four cases of different mesh numbers and time steps are considered, namely, CC1: (Np, NZ, Δt*) = (120, 63, 0.025), CC2-1: (Np, NZ, Δt*) = (120, 126, 0.025), CC2-2: (Np, NZ, Δt*) = (120, 126, 0.0125) and CC3: (Np, NZ, Δt*) = (160, 126, 0.025), where Np and NZ are the grid numbers around the cylinder circumference and along the span, respectively. Table 1 lists the details and integral parameters of the cylinder, including the time-mean drag coefficient
 ${\bar{C}_D} = 2{\bar{F}_x}/\rho U_\infty ^2{D_m}{L_z}$, fluctuating lift coefficient
 ${C^{\prime}_L} = 2{F^{\prime}_y}/\rho U_\infty ^2{D_m}{L_z}$ and Strouhal number St = fsDm/U∞, where
 ${\bar{F}_x}$ and
 ${F^{\prime}_y}$ are the time-mean drag force and fluctuating lift force, respectively, fs is the dominant vortex shedding frequency in the near wake of the cylinder, obtained by the fast Fourier transform of the fluctuating lateral velocities sampled at (x*, y*) = (3, 1). Case CC1, used by Lam & Lin (Reference Lam and Lin2009), is taken as the basis for comparison. It can be seen that, when NZ is doubled in the case CC2-1,
 ${\bar{C}_D}$,
 ${C^{\prime}_L}$ and St deviate 0.22 %, 2.5 % and 0.59 %, respectively, compared with those in the case CC1. When Np is further increased in the case CC3, only 0.4 % deviation in
 ${C^{\prime}_L}$ is observed whilst
 ${\bar{C}_D}$ and St remain unchanged, compared with the counterparts in the case CC2-1. This indicates that the grid number used in the case CC2-1 is enough for the convergence of the statistical results. For the independence tests of the time step, Δt* is halved to 0.0125 in the case CC2-2. The results show a small deviation of 1.27 % in
 ${C^{\prime}_L}$ and no effect on
 ${\bar{C}_D}$ and St. Therefore, the time step Δt* = 0.025 is chosen for all the simulations in this work.
Independence tests of grid and time step for a straight circular cylinder and comparison with literature results (Re = 100).

Table 1 also makes a comparison of the present integral parameters ( ${\bar{C}_D}$,
 ${C^{\prime}_L}$ and St) from the case CC2-1 with those from the literature. The values of
 ${\bar{C}_D}$,
 ${C^{\prime}_L}$ and St from the present work are in general comparable to those in the literature. The present
 ${\bar{C}_D}({=}1.384)$ is closest to that (1.389) from Kumar, Mittal & Sen (Reference Kumar, Mittal and Sen2018) and the maximum deviation is <3 % from other works (Zhang et al. Reference Zhang, Fey, Noack, Konig and Eckelmann1995; He et al. Reference He, Glowinski, Metcalfe, Nordlander and Periaux2000; Lam & Lin Reference Lam and Lin2009). The present
 ${C^{\prime}_L}({=}0.236)$ has a negligible deviation of 0.85 % from that (0.234) in Lam & Lin (Reference Lam and Lin2009). Moreover, the present St (=0.169) is among the published data with a maximum deviation of <3.05 %. These observations suggest that the present simulations produce reliable results.
4. Results and discussion
4.1. Classification of flow patterns
After careful examination of the fluid forces (including time-mean drag, fluctuating lift and surface pressure distributions) and the near-wake structures (including instantaneous vortices, vortex shedding frequency, recirculation bubble or wake closure length and three-dimensional topologies of time-mean streamlines), five distinct flow patterns (I–V) are identified when λ/Dm is increased from 0.43 to 8.59 (figure 4). The λ/Dm-ranges of the flow patterns (I–V) are marked in figure 4, with the red dots denoting representative wavelengths that are selected for further discussion in the following.
Dependence of flow patterns on wavelength λ/Dm. Red dots refer to the wavelength of the wavy cylinder selected for discussion.

Pattern I: at a relatively short wavelength λ/Dm (<2.58), the wavy elliptic cylinder generates a two-dimensional near wake, similar to that of a straight elliptic cylinder with an aspect ratio of the cross-section AR ≥ 0.37 and a zero angle of attack (Shi et al. Reference Shi, Alam and Bai2020, Re = 100). A representative flow pattern in this short wavelength range is given in figure 5(a1,a2), where instantaneous spanwise and streamwise vortical structures in the near wake for λ/Dm = 0.86 are shown. The spanwise vortical structures in figure 5(a1) are indicated by the iso-surfaces (λ 2 = −0.1) detected via the λ 2-criterion (Jeong & Hussain Reference Jeong and Hussain1995) and coloured by the magnitude of streamwise vorticity  $(\omega _x^\ast )$, while the streamwise vortical structures are depicted by the iso-surfaces
 $(\omega _x^\ast = \pm 0.1)$ of ωx. Clearly, the iso-surfaces of λ 2 = −0.1 exhibit a street of von Kármán vortices downstream (figure 5a1), and no iso-surfaces of
 $\omega _x^\ast = \pm 0.1$ are detected around the cylinder and in the wake (figure 5a2). This observation indicates that the wake is two-dimensional. This flow behaves like the flow over a uniform cylinder, hence it is termed as 0λ flow. This is further corroborated by the distributions of the time-mean streamlines in the xz-plane (at y = 0) and xy-planes (at the saddle and node sections, denoted by ‘S’ and ‘N’, respectively), shown in figure 6(a) in a perspective view. It can be seen that a recirculation bubble is generated behind the cylinder, starting from the flow separation line (indicated by the blue dashed line) on the cylinder surface. The streamwise extent of the recirculation bubble at the node and saddle locations is the same, indicated by the bifurcation (saddle point) line of the streamlines (indicated by the red dashed line) in the xz-plane (at y = 0). That is, the recirculation bubble is spanwise invariant, suggesting a two-dimensional wake. As indicated by the blue dashed line over the cylinder surface, flow separation occurs slightly earlier at the saddle (148.3°) than at the node (154.3°), with the near-surface flow laterally moving from the saddle to the node.
Representative instantaneous structures for the five flow patterns. (a1–e1) Spanwise vortices, in terms of iso-surface of λ 2 = −0.1 (coloured by streamwise vorticity  $\omega _x^\ast $); (a2–e2) streamwise vortices, in terms of iso-surface of
 $\omega _x^\ast = 0.1$ (red) and −0.1 (blue). Images (a1,a2) show λ/Dm = 0.86 (flow pattern I); (b1,b2) 3.43 (II); (c1,c2) 4.58 (III); (d1,d2) 6.01 (IV); and (e1,e2) 8.59 (V). The cylinder in each is of two spanwise wavelengths.

Distributions of time-mean streamlines in the xy-plane (at saddle and node sections, denoted by ‘S’ and ‘N’, respectively) and in the xz-plane (at y = 0) for (a) λ/Dm = 0.86 (flow pattern I), (b) 3.43 (II), (c) 4.58 (III), (d) 6.01 (IV) and (e) 8.59 (V). The red dashed line denotes the streamwise extent of the recirculation bubble. The separation angles for node and saddle sections are provided.

Pattern II: when the wavelength is increased to λ/Dm = 3.43 (pattern II, 2.58 < λ/Dm < 4.44), its effects on the near-wake structures emerge, the wake being three-dimensional and wavy along the spanwise direction (figure 5b1). Alternate streamwise vortices are now generated (figure 5b1,b2), albeit spanwise vortices are dominant, shedding alternately from the two sides of the cylinder and appearing staggered in the wake. The spanwise vortex tubes undulate in the spanwise direction, following the cylinder wavelength. The wavy formation of the spanwise vortical structures can be ascribed to the presence of the counter-rotating streamwise vortices additionally generated downstream of the nodes (figure 5b2), which was also observed by Ahmed & Bays-Muchmore (Reference Ahmed and Bays-Muchmore1992), Zhang et al. (Reference Zhang, Daichin and Lee2005) and Lam & Lin (Reference Lam and Lin2008) for wavy circular cylinders. The spanwise vortex tubes, albeit undulating, are continuous along the spanwise direction and alternate in the wake, suggesting that the spanwise vortex shedding from one side synchronously occurs along the whole cylinder span while alternating with that from the other side. The vortex shedding happens synchronously from the whole cylinder span, or from the entire wavelength, thus the flow here is called 1.0λ flow. The formation of the three-dimensional undulation in the near wake is further manifested by the distributions of time-mean streamlines in the two orthogonal planes (figure 6b). Different from the observation made in pattern I (figure 6a), the streamwise size of the recirculation bubble differs between the node and saddle sections, longer at the node than at the saddle, which is evidenced by the sine-like variation of the bifurcation line in the xz-plane at y = 0. The near-surface flow heads from the node to the saddle, resulting in an earlier flow separation at the node (146.6°) than at the saddle (157.0°), which is again opposite to that in pattern I (figure 6a). It can thus be said that delayed or advanced flow separation is dictated by the near-surface flow heading to the saddle or the node. If the near-surface flow is directed toward the node, the flow separation is delayed at the node and vice versa.
Pattern III: with a further increase in the wavelength to λ/Dm = 4.44–5.01, the alternate spanwise and streamwise vortices are suppressed, the wake is stabilized and the flow becomes steady (figure 5c1,c2). It is referred to as steady flow. Unlike patterns I and II, pattern III does not exhibit large-scale Kármán vortices; instead, the iso-surfaces of spanwise and streamwise vortices appear in the vicinity of the cylinder. These observations indicate that shear layers separating from the cylinder are stable, without rolling up into large-scale spanwise or streamwise vortical structures. The recirculation bubble size changes dramatically along the cylinder span, being smallest at the saddle section (figure 6c). Again the flow separation is more delayed at the saddle (157.0°) than that at the node (148.1°), with the near-surface flow heading from the node to the saddle.
Pattern IV: in the range of 5.01 < λ/Dm < 6.40, the wake of the wavy elliptic cylinder recovers to be three-dimensional, unsteady and characterized by strong, dominant streamwise vortices and disconnected spanwise vortices (figure 5d1,d2). As seen in figure 5(d2), the iso-surfaces of  $\omega _x^\ast = \pm 0.1$ display large-scale
 $\varLambda$-like structures inclined towards the downstream direction, each spanning approximately one spanwise wavelength. These streamwise
 $\varLambda$-like structures of oppositely signed vorticities spread out along both streamwise and spanwise directions. The presence of these dominant streamwise vortical structures is a reason for disconnected spanwise vortical structures along the spanwise direction, as indicated by the broken iso-surfaces of λ 2 = −0.1 (figure 5d1). Another distinct and interesting feature of this flow pattern is that spanwise vortex shedding from a half-wavelength (e.g. from the top node to the adjacent saddle) is out of phase (phase lag 180°) with that from the next half-wavelength, see figure 5(d1,d2); more information of the phase lag will be provided later. That is, vortex shedding synchronously occurs only for a half-cylinder wavelength. This is the main reason why spanwise vortex tubes are disconnected along the span for pattern IV, different from those (i.e. an entire wavelength synchronization of vortex shedding) for patterns I and II. This flow can be termed as a half-wavelength flow or 0.5λ flow. Such a half-wavelength vortex shedding (out-of-phase vortex shedding from the two successive half-wavelengths) provides room for a streamwise vortex to grow up in the spanwise direction. The vortex shedding of 0.5λ flow is identified as the first of its kind, which may yield zero instantaneous lift and zero fluctuating drag on the cylinder of one wavelength, although alternating vortex shedding from the cylinder is still manifest. It may thus have a great implication for near-wake flow control and FIV suppression. The corresponding forces generated will be presented later. In the time-mean sense, the flow separation is delayed at the saddle that is accompanied by the smallest recirculation bubble size (figure 6d).
Pattern V: at λ/Dm > 6.40, the wake is still highly three-dimensional although interactions of the additionally generated streamwise vortices become weakened because of the large distance between the nodes (figure 5e1,e2). The spanwise vortex tube in the vicinity of the cylinder spans the entire cylinder span, albeit in a wavy fashion. It indicates that the vortex shedding from one side of the cylinder occurs for the whole cylinder span, not like that observed for pattern IV. Different from the  $\varLambda$-like structures spanning one wavelength (figure 5d2), the streamwise vortices grow and mainly congregate downstream of the node sections (figure 5e2). As a result, the spanwise vortex tubes break downstream as occurs for a uniform cylinder involving streamwise vortices (Bai & Alam Reference Bai and Alam2018). This flow can be called a very large wavelength flow or ∞λ flow. This is also reflected by the distributions of time-mean streamlines (figure 6e) where the recirculation bubble has a longer streamwise extent at the node section than at the saddle section. The difference in the streamwise size of the recirculation bubble between the node and saddle sections becomes smaller than those for patterns III and IV.
4.2. Recirculation bubble length
Figure 7(a) shows variations with λ/Dm of the wake closure or recirculation bubble length (Lc) at the saddle and node sections, as well as their ratios ( $L_c^S/L_c^N$, superscripts ‘S’ and ‘N’ denoting saddle and node sections, respectively). The Lc is defined as the streamwise extent of the recirculation bubble from the cylinder centre. It can be seen in figure 7(a) that the saddle and node sections have different trends of
 $L_c^\ast $ vs λ/Dm. In the range of λ/Dm < 2.58, where flow pattern I occurs,
 $L_c^\ast $ for the saddle section is close to that for the node section, yielding a ratio
 $L_c^S/L_c^N$ nearly equal to one (figure 7a). This is linked to the two-dimensional flow (figure 5a1). The value of
 $L_c^\ast $ for the node section escalates with increasing λ/Dm whilst that for the saddle section declines gradually in 2.58 < λ/Dm < 4.44. The value of
 $L_c^S/L_c^N$ thus declines rapidly. With a further increase in λ/Dm from 4.44 to 5.01,
 $L_c^\ast $ at the node section keeps increasing while that at the saddle section reaches its minimum. The value of
 $L_c^S/L_c^N$ reaches a low value of about 0.5 in this range. When flow pattern III is modified into flow pattern IV in the range of 5.01 < λ/Dm < 6.40,
 $L_c^\ast $ values for both sections fluctuate, maintaining
 $L_c^S/L_c^N$ nearly constant. The large deviations of
 $L_c^\ast $ for the saddle and node sections, associated with the low
 $L_c^S/L_c^N$, manifest the three-dimensional characteristics of the wake observed for flow pattern IV (figure 5d). The value of
 $L_c^\ast $ for the node section jumps at the border between patterns IV and V. At λ/Dm > 6.40 (pattern V), with increasing λ/Dm,
 $L_c^\ast $ drops for the node section and increases for the saddle section to reach that for the straight elliptic cylinder. Overall,
 $L_c^\ast $ is more dependent on λ/Dm at the node plane than at the saddle plane.
Variations with wavelength λ/Dm of the global parameters: (a) recirculation bubble length  $L_c^\ast $ at the saddle and node sections and their ratio
 $L_c^S/L_c^N$ ; and (b)
 $2(L_c^N - L_c^S)/\lambda $.

To further investigate the effects of λ/Dm on the wake structures, we calculated the difference in  $L_c^\ast $ between the node to saddle sections, i.e.
 $2(L_c^N - L_c^S)/\lambda $ and present its variation with λ/Dm in figure 7(b). The value of
 $2(L_c^N - L_c^S)$ is presumably connected with the capability of λ/Dm to modify the time-mean flow structures. The published data for the wavy circular cylinder (Lam & Lin Reference Lam and Lin2008, Reference Lam and Lin2009; Lin et al. Reference Lin, Bai, Alam, Zhang and Lam2016) are included for comparison. Clearly,
 $2(L_c^N - L_c^S)/\lambda $ is large in patterns III and IV characterized by the most stabilized near wake and the largest force reduction, respectively. This observation suggests that the wavy elliptic cylinder with λ/Dm = 4.44–6.40 can alter the near-wake structures in a way that the coherent vortical structures are completely suppressed (4.44 < λ/Dm < 5.01, see figure 5c1,c2) or the additionally generated
 $\varLambda$-like structures by the node make the near wake stable (with 5.01 < λ/Dm < 6.40). Interestingly, the published data of
 $2(L_c^N - L_c^S)/\lambda $ for the wavy circular cylinder display the maximum in the range of 6 < λ/Dm < 7.5, where the most stabilized wake is also observed. Therefore,
 $2(L_c^N - L_c^S)/\lambda $ may play a dominant role in modifying the wake of the wavy elliptic or circular cylinder.
4.3. Wake evolution
We further investigate the wake behaviour of the wavy elliptic cylinder, based on time evolutions of the lateral velocity fluctuation (v*) and streamwise vorticity fluctuation  $(\omega _x^\ast )$ recorded at (x*, y*) = (5, 0) along the entire span, as well as on instantaneous streamlines in the near wake. Typical wavelengths of λ/Dm = 0.86 (pattern I), 3.43 (II), 5.44 and 6.01 (IV) and 8.59 (V) are chosen. Figures 8 and 9 show respectively the time evolutions of v* and
 $\omega _x^\ast $ for the span of two wavelengths, with the nodes located at z/λ = 0, 1.0 and 2.0 and the saddles at z/λ = 0.5 and 1.5. The contours are scaled identically in each figure to facilitate comparison, except in figure 8(c2), where a small scale is used to explore the evolution explicitly. As the flow is two-dimensional and steady for patterns I and III, respectively, the v* contours for pattern III and
 $\omega _x^\ast $ contours for patterns I and III are not shown. For λ/Dm = 0.86 (pattern I), the v* signal (figure 8a) is uniformly distributed along the span while exhibiting a periodic switch between positive and negative with time. In pattern II (figure 8b), the distributions of v* appear wavy along the span, and the temporal distributions remain periodic with time. The waviness comes up with streamwise vortices (figure 9a) in a periodic fashion in space and time domains. The v* evolution in pattern IV is different from the others, positive or negative v* occupies one cylinder wavelength from the saddle to saddle, appearing alternately in both time and space domains (figure 8c2). Similarly, the
 $\omega _x^\ast $ topology shows patterns of
 $\varLambda$-like vortices spanning one cylinder wavelength (figure 9b). In pattern V, the value of v* vigorously varies along the time axis around the node plane, and
 $\omega _x^\ast $ is dramatically strong, echoing the highly three-dimensional flow. Let us pay more attention to pattern IV where v* contours reflect that, in one cylinder wavelength (e.g. z/λ = 0–1.0), v* is negative and positive (the first column) for z/λ = 0–0.5 and z/λ = 0.5–1.0, respectively, which indicates that the vortex shedding is from the +y (>0) side of the cylinder for z/λ = 0–0.5 but from the −y (<0) side for z/λ = 0.5–1.0 (figure 8c2). That is, vortex shedding from one half of the wavelength is out of phase with the other half for pattern IV. This is, however, not the case for patterns I, II and V where vortex shedding occurs synchronously from the whole cylinder span.
Time evolutions of lateral velocity v* recorded at (x*, y*) = (5, 0); (a) λ/Dm = 0.86 (flow pattern I), (b) 3.43 (II), (c1,c2) 5.44 (IV) and (d) 8.59 (V).

Time evolutions of streamwise vorticity  $\omega _x^\ast $ recorded at (x*, y*) = (5, 0); (a) λ/Dm = 3.43 (flow pattern II), (b) 5.44 (IV) and (c) 8.59 (V).

The trajectories of instantaneous streamlines are shown in figure 10 for λ/Dm = 3.43 (pattern II), 4.58 (III) and 6.01 (IV). Here, the results are presented for one cylinder wavelength only. To facilitate interpretation, the streamlines are introduced from the symmetric xz plane (y = 0) upstream of the cylinder at the node and saddle, coloured in red and blue, respectively, while the streamlines in the middle planes between the node and saddle are coloured in green. Consider the case of λ/Dm = 3.43 (pattern II, figure 10a) first, the streamlines issuing at different sections all separate from the same side (y > 0) of the cylinder at this instant. The streamlines from the node plane spiral towards the saddle, entraining those from the middle planes. The streamlines then extend downstream of the saddle. The spatial characteristics of the streamlines are linked to the wavy wake of alternating spanwise vortices (figure 5b). The streamline at the saddle does not spiral but displays a signature of vortex shedding. For λ/Dm = 4.58 (pattern III, figure 10b), the streamlines also separate from the same side (y > 0) of the cylinder at this instant. However, different from those in figure 10(a), the streamlines mainly roll up into the recirculation bubble with a long streamwise extent at the node (figure 10b1). The streamline near the middle plane (green line) forms a steady recirculation bubble, spiralling from the middle plane to the node plane (figure 10b2,b4). Meanwhile, the recirculation bubble between the middle and saddle planes spirals toward the centre, small in size and strong in circulation, which can be observed clearly from the zoomed-in view in figure 10(b3). That is, the spiral flow, having a bifurcation at the middle plane, heads toward the node and saddle planes. According to the green streamlines in figure 10(b2), the large-scale spiral flow can be detected only at two cylinder ends (node sections). The spiral flow toward the nodes is due to the large-scale recirculation bubble at the nodes while that toward the saddle, albeit weak, is the same as that for pattern II. A sketch showing the bifurcation of the spiral flow is provided in figure 10(b5) with the yz- plane view. In fact, the spiral flow has similar features in xz- and yz-planes (figure 10b3,b4); therefore, only the yz- plane is provided. Recall that  $L_c^S/L_c^N \approx 0.5$ with λ/Dm = 4.58 (figure 7a), which leads to a 45° inclination angle of the recirculation bubble core between the node and saddle planes (figure 10b5). The high inclination may be the reason for the bifurcation. When the streamlines exit the bubble at node and saddle planes, they become parallel with the free-stream flow (figure 10b2).
Instantaneous and time-mean streamlines; (a1–a3) λ/Dm = 3.43 (flow pattern II), (b1–b5) 4.58 (III) and (c1–c3) 6.01 (IV), where (a1–c1) provide the top views (xy- plane), (a2–c2) provide the global view, (a3) is the side view of (a2), (b3,b4) display the zoom-in view of the specific streamline, (b5) is a sketch showing the spiral flow of the streamline marked with dashed square in (b2) with yz-plane and (c3) is the time-mean streamline.

For the cylinder with λ/Dm = 6.01 (pattern IV, figure 10c2), the instantaneous streamlines are more complicated than those with shorter wavelengths. It is noted that the streamlines at the two nodes (black) or middle sections (green) issue from the opposite sides of the upper and lower half of the cylinder while those (blue) in the saddle plane separate from both sides of the cylinder. This further confirms that the vortex sheddings from the upper and lower halves are antiphased, see also the top views (figure 10c1) of the streamline patterns in figure 10(c2). Such characteristics are internally linked to the formation of  $\varLambda$-like streamwise vorticity structures.
Due to the significant difference in the wake sizes between node and saddle planes (figure 6d), a spiral flow behind the cylinder along the cylinder span is generated, which could be more clearly understood from the time-mean streamlines shown in figure 10(c3). This time-mean spiral flow is similar to that in the steady flow pattern (λ/Dm = 4.58, figure 10b2). With the spiral flow being stronger near the node plane, the bifurcation of the spiral flow now occurs further close to the node plane (figure 10c3).
Furthermore, the instantaneous vortex shedding for five distinct flow patterns is sketched in figure 11 to have a clear understanding of the three-dimensional flow topologies. Meanwhile, the time-mean spiral streamline marked by the red arrows provides a picture of the flow three-dimensionality. Flow pattern I features two-dimensional flow (figure 11a), where vortex shedding and streamlines are both two-dimensional, regardless of the wavelength. In other words, the flow is 0λ flow. The wavelength effect appears for flow pattern II, generating the spiral flow from the node plane to the saddle plane (figures 10a2 and 11b), leading to the waviness of the vortex structure (figure 11b). Vortex shedding alternately occurs from the two sides for the entire wavelength. For steady flow (pattern III), the stable recirculation bubble is generated in the wake, having bifurcated spiral flows heading toward the saddle and node planes (figure 11c). Flow pattern IV is characterized by the antiphase vortex shedding from the two halves of the cylinder (figure 11d). The resulting instantaneous lift force is thus zero over one complete wavelength. Again, flow associated with vortex shedding is bifurcated, yielding spiral flow toward the node and saddle planes. The size of the time-mean recirculation bubble is much smaller in the saddle plane than in the node plane for patterns III and IV (figures 6c,d and 10b2,c3), leading to a shorter formation length (figure 7a). Lin et al. (Reference Lin, Bai, Alam, Zhang and Lam2016) supposed that stable shear layers render a longer recirculation bubble, which is not the case here. For this flow pattern, the recirculation bubble is approximately steady at the saddle plane as the saddle plane is the common plane for the vortex shedding from the upper and lower halves of the cylinders. Flow pattern V still undergoes bifurcation but now the vortex shedding synchronously occurs from the whole span (figure 11e). It is understood that bifurcation occurs when the difference in recirculation bubble sizes between node and saddle planes is significant  $(L_c^N/L_c^S \le 0.63)$, for λ/Dm ≥ 4.30, patterns III–V (figure 7a).
Sketches of the flow structures for distinct flow patterns. (a–e) Flow patterns I–V. The red lines indicate bifurcation in the vortex shedding and recirculation.

4.4. Fluid forces
Fluid forces acting on the wavy elliptic cylinder (WEC) are examined in figure 12 showing the dependence of  ${\bar{C}_D}$ and
 ${C^{\prime}_L}$ on λ/Dm. The values of
 ${\bar{C}_{D0}}$ and
 ${C^{\prime}_{L0}}$ of the straight elliptic cylinder (EC) is included in the figure for comparison. The flow patterns I, II, III, IV and V are marked in the figure to facilitate interpretations of the force behaviour. It can be seen that
 ${\bar{C}_D}$ and
 ${C^{\prime}_L}$ dip rapidly with increasing λ/Dm from 0 to 4.44 (figure 12a,b), being mostly larger in pattern I and smaller in pattern II than those of the straight cylinder. The force coefficients reach their minima at 4.44 < λ/Dm < 5.01 (pattern III). Compared with the straight cylinder counterpart, the reduction in
 ${\bar{C}_D}$ is up to 5 % for λ/Dm = 4.44–5.01 (figure 12a); on the other hand,
 ${C^{\prime}_L}$ is zero (figure 12b). The reduced
 ${\bar{C}_D}$ and zero
 ${C^{\prime}_L}$ result from the stabilized wake (steady flow). These observations on the fluid forces are consistent with those made on the near-wake structures (figure 5c1,c2). In the range of 5.01 < λ/Dm < 6.40 (pattern IV),
 ${\bar{C}_D}$ recovers slightly while
 ${C^{\prime}_L}$ remains zero (figure 12a,b). The zero
 ${C^{\prime}_L}$ results from 0.5λ flow as the lift generated in a half-wavelength of the cylinder is cancelled by the opposite lift generated in the other half-wavelength of the cylinder, which will be further clarified later. At λ/Dm > 6.40 (pattern V), both
 ${\bar{C}_D}$ and
 ${C^{\prime}_L}$ increase gradually with increasing λ/Dm and are expected to approach asymptotically that of the straight cylinder (with an infinite wavelength).
Dependence on wavelength λ/Dm of (a) mean drag coefficient  ${\bar{C}_D}$ and (b) fluctuating lift coefficient
 ${C^{\prime}_L}$. The red dashed line indicates
 ${\bar{C}_{D0}}$ and
 ${C^{\prime}_{L0}}$ for the straight EC and ‘I’ to ‘V’ on the top of the plots denote identified flow patterns.

The optimal wavelength of the WEC, in terms of fluid force reduction, can be identified in figure 12. The optimal wavelength covers a range of λ/Dm = 4.44–6.40, corresponding to the minimum  ${\bar{C}_D}$ and zero
 ${C^{\prime}_L}$. Note that, while
 ${\bar{C}_D}$ remains its minimum in pattern III and recovers slightly in pattern IV,
 ${C^{\prime}_L}$ maintains zero in the entire range of the optimal wavelength. This is essentially linked to the distinct features in patterns III and IV (figure 5c1,c2,d1,d2). For the wavy circular cylinder, two different optimal wavelengths (i.e. λ/Dm ≈ 2 and 6) were detected by Lam & Lin (Reference Lam and Lin2009) (Re = 100) as well as by Lam & Lin (Reference Lam and Lin2008) and Lin et al. (Reference Lin, Bai, Alam, Zhang and Lam2016) (Re = 3 × 10³). The reductions in
 ${\bar{C}_D}$ and
 ${C^{\prime}_L}$ are up to 16 % and 93 %, respectively. Distinct mechanisms of force reduction are associated with the two optimal wavelengths for the wavy circular cylinder (Lin et al. Reference Lin, Bai, Alam, Zhang and Lam2016). A detailed comparison between the wavy elliptic and circular cylinders will be given in § 5.
4.5. Intrinsic mechanism and consequence of 0.5λ flow generation
It is worth investigating why  ${C^{\prime}_L} = 0$ in pattern IV although there is alternate vortex shedding from the cylinder or why this pattern is named as 0.5λ flow. We choose two cross-sections A and B in one spanwise wavelength, with the same distance l away from the saddle plane (figure 13a). Each cross-section is probed with four surface locations Ai or Bi (i = 1–4), corresponding to a similar azimuthal angle
 $|{\theta}|$. The points are symmetric about the xz-plane at y = 0 and yz-plane at x = 0. Note that l = 0.4λ and θ = 30° are randomly selected in figure 13(a), without the loss of generality. Time histories of the lateral component
 ${C_{py}} = {C_p}\sin \theta $ (where
 ${C_p} = (P - {P_\infty })/0.5\rho U_\infty ^2$) of the surface pressure coefficients for Ai and Bi are presented for λ/Dm = 5.44 (pattern IV, figure 13b,c), 4.58 (pattern III, figure 13e, f) and 1.72 (pattern I, figure 13h,i). The value of
 ${C_{py}}$ is essentially connected to the lift force generated by the cylinder. Here, we discuss the case of pattern IV first (figure 13b,c). The
 ${C_{py}}$ signals at the two points on the same side (y > 0 or y < 0) of section A are almost in phase (e.g. A1 and A2 are indicated by the black curves, or A3 and A4 by red dashed curves) (figure 13b,c). The same happens in section B. Interestingly, on the same side (e.g. y < 0) of the cylinder, the
 ${C_{py}}$ signal at A1 (or A2) is out of phase with that at B1 (or B2), albeit both A1 and B1 (or A2 and B2) points have the same θ value but are located on different cross-sections. This suggests that vortex shedding from the same side (y > 0 or y < 0) of the two different cross-sections is out of phase, which is supported by the instantaneous flow structures, in terms of spanwise vorticity
 $(\omega _z^\ast )$, in sections A and B in figure 13(d). It can be seen that shear layers separating from the upper (or lower) side of section A (i.e. S-A in figure 13d) are oscillating in an out-of-phase fashion with that from the upper (or lower) side of section B (i.e. S-B), which is highlighted by the dashed ellipses. Meanwhile, shear layers separating from the saddle plane (i.e. S in figure 13d) are symmetric. Further note that, in figure 13(b), due to the out-of-phase and similar-magnitude fluctuations of
 ${C_{py}}$ in A1 and B1 (or A3 and B3), the summation of
 ${C_{py}}$ at A1 and B1, i.e.
 ${C_{py}}(\textrm{A}1 + \textrm{B}1)$ (which half is indicated by the red line) on the lower side is approximately equal to, in magnitude, that of
 ${C_{py}}$ at A3 and B3, i.e.
 ${C_{py}}(\textrm{A}3 + \textrm{B}3)$ (which half is indicated by the blue line) on the upper side. A similar observation can be made in figure 13(c) on
 ${C_{py}}$ at A2 and B2 (or A4 and B4). That is,
 ${C_{py}}(\textrm{A}1 + \textrm{B}1) ={-} {C_{py}}(\textrm{A}3 + \textrm{B}3)$ and
 ${C_{py}}(\textrm{A}2 + \textrm{B}2) ={-} {C_{py}}(\textrm{A}4 + \textrm{B}4)$. Therefore, the total lift forces on the two cross-sections (with similar distance l away from the saddle plane) must cancel out from each other, although the lift fluctuation (integrated by the surface pressure fluctuation) in each cross-section may not be necessarily zero. In other words, a zero total lift fluctuation on the entire wavelength of the cylinder is not unexpected, given that l is randomly selected.
Time histories of surface pressure coefficient Cpy (= Cpsinθ, θ is the azimuth angle) for locations Ai and Bi around the two cross-sections A (S-A) and B (S-B) as indicated in (a) and the instantaneous vorticity structure at S-A, S-B and saddle section. Panels (b–d) show λ/Dm = 5.44 (flow pattern IV), (e–g) 4.58 (III) and (h–j) 1.72 (I).

In the case of pattern III, there is no fluctuation in  ${C_{py}}$ at any of the points (figure 13e, f), confirming the occurrence of the steady flow that is shown by the spanwise vorticity
 $(\omega _z^\ast )$ in sections A, B and the saddle planes (figure 13g). The scenario in pattern I (figure 13h,i) is opposite to that in pattern IV. The
 ${C_{py}}$ signals at two similar points (e.g. A1 and B1, A2 and B2) are perfectly in phase (figure 13h,i), suggesting the synchronous occurrence of vortex shedding from the whole cylinder span (figure 13j).
The Cp fluctuation is linked to the flow separation and hence the flow separation occurring from the whole span or a half-span can be understood from the cross-correlations of Cp fluctuation along the span. The cross-correlation analysis is performed for λ/Dm = 6.01 (flow pattern IV) and λ/Dm = 3.43 (flow pattern II), as shown in figure 14. The value of Cp at z/λ = 1.0 is chosen as the reference signal to carry out the cross-correlation for the whole span. For λ/Dm = 6.01 (figure 14a), at phase ϕ = 0, the cross-correlation coefficient (Cro) is 1.0 for the upper half-span (z/λ > 0.5) and −1.0 for the lower half (z/λ < 0.5) while the peaks and valleys are changing alternately and oppositely between the two halves. It suggests that vortex sheddings from the two halves are out of phase, consistent with the flow structure (figure 10c2). The cross-correlation coefficient approaches 0 at z/λ = 0.4–0.6, suggesting that the flow is more or less steady near the saddle plane. When λ/Dm = 3.43, the value Cro = 1.0 appears for the whole span (figure 14b), with peaks and valleys materializing alternately. In other words, alternate vortex shedding occurs from the whole span, similarly to pattern II (figure 10a2).
Cross-correlation coefficient of sectional pressure coefficient (CP) with that at Z/λ = 1.0 (node); (a) λ/Dm = 6.01 (flow pattern IV), (b) λ/Dm = 3.43 (flow pattern II).

4.6. Strouhal number
Vortex shedding behaviour in the wake is investigated, based on fluctuating lateral velocities (v), together with their power spectral density (PSD) functions, sampled at different spanwise locations in the wake. Representative λ/Dm = 3.43, 6.01 and 8.59 in patterns II, IV and V, respectively, are considered, as they are associated with highly three-dimensional characteristics, particularly along the spanwise direction. Figure 15 presents the time histories of v signals, along with their corresponding PSDs. The v signals were sampled at (x*, y*) = (3, 1) in the node, saddle and middle planes. In the case of pattern II, the v signals at the three planes fluctuate periodically with time, having negligible phase shifts (figure 15a). The amplitude of oscillation is, however, relatively small at the saddle plane and large at the node plane. The corresponding PSDs show pronounced peaks at the normalized frequency of f* = 0.144 (figure 15b). The observation indicates an identical frequency of vortex shedding at different spanwise locations.
Time histories (a,c,e) and PSD functions (b,d, f) of the lateral velocity v* sampled at (x*, y*) = (3, 1). (a,b) λ/Dm = 3.43 (flow pattern II); (c,d) 6.01 (IV); and (e, f) 8.59 (V).

For patterns IV and V (figure 15c–f), the v signals at the different planes behave distinctively. First, the amplitude of the v signal in the saddle plane is substantially smaller than that in the node and middle planes, essentially zero for pattern IV (figure 15c). Second, the v signal in the saddle plane is not exactly out of phase with that in the node for pattern IV as we expect. This is because the formation length of vortex shedding differs between the saddle and node planes. Although the amplitude of fluctuations differs between planes, the PSDs of the signals at different spanwise locations exhibit pronounced peaks at f* = 0.117 and 0.122 for patterns IV and V, respectively (figure 15d, f).
Figure 16 shows the variation in St with λ/Dm. The red horizontal line represents St 0, Strouhal number of the straight EC. The value of St ≈ St 0 for pattern I, indicating straight-cylinder-like flow, i.e. 0λ flow. When pattern I is modified to pattern II, St is considerably reduced. This is due to the presence of streamwise vortices and their role in undulating the primary spanwise vortices (figure 5b1,b2). As such, the vortex shedding is retarded to some extent. The flow is steady in pattern III, hence  $St = 0$. The value of St is more or less constant in pattern IV and grows with λ/Dm in pattern IV.
Variations of Strouhal number (St) with λ/Dm; St 0 represents the Strouhal number of the straight EC.

5. Comparison among different wavy cylinders
As discussed in the Introduction section, slender wavy cylinders of different cross-sections (circular, square or elliptic) have been extensively investigated in the literature. The cross-section geometries, together with parameters of the wave form (i.e. wavelength λ, wave amplitude a) and flow (i.e. Reynolds number Re), render significant effects on the near wakes as well as fluid forces (see table 2). In order to gain insight into underlying flow physics and force reduction/suppression mechanisms, it is of great interest to make a thorough comparison among different wavy cylinders.
A summarize for drag reduction of wavy cylinder in the literature. Exp, experimental measurement; Num, numerical simulation. SEC, smooth elliptic cylinder; SCC, smooth circular cylinder.

It is well known that flow separation around a square cylinder is stationary, fixed at the sharp edges of infinite curvature, whilst that around a circular or EC is non-stationary, occurring and oscillating over a segment of the finite-curvature surface (Alam, Zhou & Wang Reference Alam, Zhou and Wang2011). In the subcritical flow regime, flow separation occurs at the leading edges of the wavy square cylinder, irrespective of the wavy form on only the front face (Bearman & Owen Reference Bearman and Owen1998, Re = 4 × 10⁴), on both front and rear faces (Lin et al. Reference Lin, Bai and Alam2015, Re = 1.65–2.2 × 10⁴) or on both side faces (Lam et al. Reference Lam, Lin, Zou and Liu2012, Re = 5 × 10², 5 × 10³; Lin et al. Reference Lin, Bai and Alam2015, Re = 1.65–2.2 × 10⁴). The spanwise-averaged recirculation bubble length is 54 % longer than that of its smooth counterpart, corresponding to the large reduction in mean drag (up to 30 %) and fluctuating lift (up to 32 %). On the contrary, for the both-side-wavy square cylinder (λ/Dm = 6.0, a/Dm = 0.15), a wide wake and a narrow wake are formed in the node and saddle planes, respectively, ascribed to the increased and reduced cross-stream protrusion of the cylinder. Shear layers separating from the wavy leading edges on both sides are substantially stabilized (Lam et al. Reference Lam, Lin, Zou and Liu2012). The recirculation bubble displays weaker spanwise variations than that of the former two types of wavy square cylinders and is significantly elongated longitudinally, with an increase of 92 % in the spanwise-averaged streamwise length. The maximum reductions in mean drag and fluctuating lift are up to 26 % and 100 %, respectively, compared with that of the smooth square cylinder.
For the wavy circular or elliptic cylinder, the wavelength λ/Dm plays a significant role in the occurrence location of flow separation. Consequently, the near-wake characteristics and fluid force behaviour have a strong dependence on λ/Dm. For the wavy circular cylinder with a relatively short λ/Dm (<6), flow separation takes place earlier at the saddle than at the node (e.g. Ahmed & Bays-Muchmore Reference Ahmed and Bays-Muchmore1992; Lam & Lin Reference Lam and Lin2008), generating a spanwise-wavy near wake that is characterized by a wide wake and a narrow wake in the saddle and node planes, respectively. Meanwhile, additionally formed downstream of the node is a pair of counter-rotating streamwise vortices, which in turn enhance and stabilize the wavy fashion of the near wake to the greatest extent at the optimal λ/Dm ≈ 2, corresponding to the maximum reduction in mean drag (up to 26 %) and fluctuating lift (up to 100 %). For the wavy circular cylinder with the relatively long λ/Dm (>6), flow separation occurs earlier at the node than at the saddle, associated with a wide wake and a narrow wake, respectively (Lin et al. Reference Lin, Bai, Alam, Zhang and Lam2016). This is an opposite scenario to that for the wavy circular cylinder with λ/Dm < 6. Therefore, there is a transitional and optimal λ/Dm ≈ 6, where flow separation over the cylinder surface is spanwise invariant, similar to that around the smooth circular cylinder, mostly stabilizing shear layers and elongating the recirculation bubble. The corresponding mean drag reduction is up to 16 % and fluctuating lift suppression up to 93 % at this λ/Dm. The WECs investigated in the literature are mainly based on the unique morphological shape of the seal whisker. In the subcritical flow regime, the seal-whisker-based WECs (λ/Dm = 2.8–7.5; a/Dm = 0.05–0.2; AR = 0.4–0.67) can intensify three-dimensionality of the near wake, impairing the large-scale vortices and leading to force reduction. Similar to that around the wavy circular cylinder of a short λ/Dm (<6), flow separation around the seal-whisker-based WEC occurs earlier at the saddle plane than at the node (Hanke et al. Reference Hanke, Witte, Miersch, Brede, Oeffner, Michael, Hanke, Leder and Dehnhardt2010, Re = 5 × 10²), thus generating a wide wake and a narrow wake, respectively. The reduction in mean drag is up to 26 % and suppression in fluctuating lift up to 79.2 % at λ/Dm = 3.4.
In the laminar flow regime, flow separation occurs at the trailing edges of the front-and-rear-face-wavy square cylinder (Darekar & Sherwin, Reference Darekar and Sherwin2001a,Reference Darekar and Sherwinb, Re = 10–100; Ling & Lin Reference Ling and Lin2008, Re = 100–180) or the both-side-face-wavy square cylinder (Lam et al. Reference Lam, Lin, Zou and Liu2012, Re = 100). Distinct characteristics in the near wakes are observed for these wavy square cylinders. For the former cylinder (λ/Dm = 5.6; a/Dm = 0.167), a wide wake and a narrow wake are generated in the saddle and nodes planes, respectively, which is ascribed to the additionally induced streamwise vorticities by the cross-flow from the node to the saddle within the boundary layer developing on the front wavy face. Further, the near wake becomes steady and symmetric in the presence of the redistributed streamwise vorticities, thus leading to a considerable reduction in mean drag (up to 16 %) and a complete suppression of fluctuating lift (up to 100 %). For the latter cylinder (λ/Dm = 6; a/Dm = 0.15), however, the increased and reduced cross-stream protrusion at the node and saddle results in a wide wake and a narrow wake, respectively. Two symmetric recirculation bubbles formed within one wavelength play a role in stabilizing the shear layers and thus reducing the fluid force. The sketches of flow structures for two types of the wavy square cylinders mentioned above corresponding to the optimum wavelength (the wake is mostly suppressed) are provided in figure 17(a), the stable shear layers are produced after separating at the trailing edges.
Sketches of flow structures for (a) front-and-rear-face- and both-side-face-wavy square cylinder,(b) wavy circular cylinder and (c) wavy elliptical cylinder corresponding to the optimum wavelength in the laminar flow regime.

For the wavy circular or elliptic cylinder (Lam & Lin Reference Lam and Lin2007, Re = 100; Lam & Lin Reference Lam and Lin2009, Re = 100–150; Owen et al. Reference Owen, Szewezyk and Bearman2000, Re = 100; Hanke et al. Reference Hanke, Witte, Miersch, Brede, Oeffner, Michael, Hanke, Leder and Dehnhardt2010, Re = 186; present paper, Re = 100), the wavelength plays a significant role in modulating the near wake, similar to that in the subcritical flow regime. Due to the earlier flow separation at the saddle than at the node, the wavy circular cylinder with λ/Dm < 6 generates a wide wake and a narrow wake at the former and latter locations, respectively. At the optimal λ/Dm = 2, the wavy fashion of the near wake is enhanced and stabilized to the greatest extent (see figure 17b), leading to the largest force reduction. However, due to the earlier flow separation at the node than at the saddle, the wavy circular cylinder with λ/Dm > 6 generates a wide wake and a narrow wake at the former and latter locations, respectively. The optimal λ/Dm = 6 is identified, corresponding to the spanwise-invariant flow separation and stabilized shear shears (Lam & Lin Reference Lam and Lin2009). For the WEC investigated in the present work, flow separation and the associated near wake exhibit distinct characteristics from that of the wavy circular or seal-whisker-based WEC. It is noticed that flow separation occurs slightly earlier at the saddle than at the node when λ/Dm < 2.58 (flow pattern I); the near wake appears two-dimensional, with alternate spanwise vortex shedding. On the contrary, flow separation takes place earlier at the node than at the saddle when λ/Dm > 2.58 (flow patterns II–V); a wide wake and a narrow wake are generated at the former and latter locations, respectively, associated with large spanwise variation of the recirculation bubble length. At λ/Dm = 4.44–5.01 (flow pattern III), the near wake of the WEC is stabilized as both the large-scale spanwise and streamwise vortices are eliminated substantially, generating the longest spanwise-averaged length of the recirculation bubble. At λ/Dm = 5.01–6.40 (flow pattern IV), large-scale  $\varLambda$-like streamwise vortices are generated, disrupting the coherence of the spanwise vortices and stabilizing the near wake with a significantly elongated vortex formation length and recirculation bubble length. As shown in figure 17(c), synchronous shear layer separation occurs within a half-wavelength; at the same time, the two synchronous separating shear layers are antiphase. Such a flow structure is distinct from the wavy square or circular cylinder (figure 17a,b).
The value of Re is a crucial parameter governing the flow around a bluff body, particularly at Re < 103 (Bai & Alam Reference Bai and Alam2018; Alam Reference Alam2023). To assimilate the Re effect, a higher Re = 300 is further investigated for flow pattern IV (λ/Dm = 6.01). Different from the wake structure at Re = 100 where the wake at each saddle plane is steady, the wakes at Re = 300 are unsteady at the saddle planes. The vortex shedding frequency at the node plane differs from that at the saddle plane, the former being smaller than the latter. Asymmetric vortex shedding prevails from the two sides of a saddle section, and the asymmetric wakes of two adjacent saddle planes alternate with each other. At Re = 100, lift force fluctuation of the cylinder cancels out to zero because of the antiphase vortex shedding from the two sides of saddle planes while, for Re = 300, the lift force near the saddle sections only cancels out, thus reducing the total lift force fluctuation on the whole cylinder span. A detailed discussion can be found in the Appendix.
6. Conclusions
Systematic three-dimensional numerical simulations are conducted to investigate the near wake of a WEC at Re = 100, focusing on the effects of the wavelength (λ/Dm) on flow structures, flow three-dimensionality and fluid forces. The wavy cylinder is formed by sinusoidally changing the minor axis of the elliptic cross-section along the spanwise direction while the major axis remains constant. A wide range of λ/Dm is considered i.e. 0.43 ≤ λ/Dm ≤ 8.59, with the wake amplitude fixed at a/Dm = 0.048. Five distinct flow patterns (I–V) or regimes in different λ/Dm ranges are identified, based on the salient behaviour of the vortical structures, Strouhal number (St), wake closure length (Lc), fluid forces (i.e.  ${\bar{C}_D}$ and
 ${C^{\prime}_L}$), three-dimensional topologies of streamlines as well as spatio-temporal evolutions of the near wake.
When λ/Dm < 2.58, flow pattern I (0λ flow) emerges where the vortex shedding is two-dimensional and alternate, with St = St 0 and nearly spanwise-invariant Lc, similar to that of the straight EC. Flow pattern II (1.0λ flow) appears at 2.58 < λ/Dm < 4.44, where the spanwise vortices display a spanwise wavelength of 1.0λ that is also distinguished by a pair of counter-rotating streamwise vortices. The wake circulation flow spirals from the node plane to the saddle plane, with delayed flow separation and decreased  $L_c^S$ at the saddle plane, and increased
 $L_c^N$ at the node plane. Flow pattern III appearing at 4.44 < λ/Dm < 5.01 is steady. Alternate vortex shedding is suppressed. Flow bifurcation occurs in the stable recirculation bubble, with spiral flows heading toward the saddle and node planes. The ratios
 $L_c^S/L_c^N$ and
 $2(L_c^N - L_c^S)/\lambda $ reach a minimum of 0.5 and maximum of 1.0, respectively, leading to a 45°-inclination angle of the recirculation bubble core between the node and saddle. It was noted that parameter
 $2(L_c^N - L_c^S)/\lambda $ may play a key role in altering the near wake. Flow pattern IV (0.5λ flow) comes into being at 5.01 < λ/Dm < 6.40, where large-scale
 $\varLambda$-like streamwise vortices and disconnected spanwise vortices feature in the wake. The spanwise vortices synchronize over one 0.5λ span of the cylinder and shed in an antiphase fashion from different sides of the saddle plane and the cylinder. The vortex shedding undergoes bifurcation, generating two spiral flows toward the saddle and node, respectively. The values of St and
 $L_c^S/L_c^N$ do not change in this regime but
 $2(L_c^N - L_c^S)/\lambda $ declines. When λ/Dm is large (>6.40), flow pattern V (∞λ flow) shows up, with the wake being highly three-dimensional, composed of streamwise vortices mainly congregating downstream of the nodes. The spanwise vortices synchronize over the entire cylinder span. The interactions between the streamwise and spanwise vortices weaken. The value of
 $L_c^S/L_c^N$ progressively increases to approach the counterpart straight cylinder (infinite λ).
Compared with those of the counterpart straight cylinder,  ${\bar{C}_D}$ and
 ${C^{\prime}_L}$ are increased for flow pattern I and reduced for flow pattern II. They reach their minima for flow patterns III and IV before rising for flow pattern V. The value of
 ${C^{\prime}_L} = 0$ is achieved for flow patterns III and IV. Although the flow for pattern IV is unsteady with alternate vortex shedding, the occurrence of
 ${C^{\prime}_L} = 0$ and the corresponding physics behind are appealing. Instead of vortex shedding from the whole spanwise wavelength, the occurrence of vortex shedding oppositely from the two half-spans of one wavelength cancel out the lift force of the entire wavelength. This intrinsic flow for the WEC is revealed for the first time, which may offer implications for future flow control and/or FIV mitigation.
An extensive comparison is made of the salient near-wake flows among different wavy cylinders, including the wavy square, wavy circular, seal-whisker-based and wavy elliptic cylinders. It is revealed that the flow separation from the wavy cylinder plays a crucial role in the modification of the near-wake flow. The flow separation is fixed at the sharp trailing or leading edges of the wavy square cylinder. Yet, the flow separation displays a strong dependence on the wavelength of the wavy circular or elliptic cylinder as do the near-wake flow and fluid forces. The wavy circular cylinder offers two optimum wavelengths (i.e. λ/Dm ≈ 2.0 and 6.0) based on fluid force reductions, albeit with distinct near-wake structures and underlying mechanisms (Lam & Lin Reference Lam and Lin2009; Lin et al. Reference Lin, Bai, Alam, Zhang and Lam2016). For the present WEC, the optimum λ/Dm = 4.44–6.40 covering flow patterns III and IV is found, corresponding to the minimum  ${\bar{C}_D}$ and zero
 ${C^{\prime}_L}$. While
 ${\bar{C}_D}$ remains at its minimum at λ/Dm = 4.44–5.01 (flow pattern III) and slightly recovers at λ/Dm = 5.01–6.40 (flow pattern IV),
 ${C^{\prime}_L}$ is zero in the whole range of the optimum wavelength, which is essentially connected with the distinct flow structures observed in the individual flow regimes.
Funding
NSFC grants 11672096, 91752112, 11302062, 11872018 and 12072382; Shenzhen NSF (grant no. JCYJ20190807161217754, JCYJ20180306171921088), Khalifa University of Science and Technology Grants CIRA-2020-057, and Shenzhen Science and Technology Program (grant no. GXWD20201231165807008, 20200830220051001).
Declaration of interests
The authors report no conflict of interest.
Appendix. Results at Re = 300
The flow around a bluff body is highly dependent on Re, particularly at Re < 103 (Bai & Alam Reference Bai and Alam2018; Alam Reference Alam2022). Using direct numerical simulation, we simulate a case of the wavy cylinder with λ/Dm = 6.01 at Re = 300. A finer mesh resolution is employed, with the first grid height of 0.005Dm and the spanwise grid resolution of 0.02Dm, which gives a total grid number of 10 million. The dimensionless time is set as 0.003, corresponding to the CFL < 1.0 in the whole computational domain.
Time histories of CL and CD of the cylinder with λ/Dm = 6.01 and Re = 300 are presented in figure 18(a). The CL and CD both have small-amplitude oscillations, with  ${C^{\prime}_L} = 0.045$,
 ${C^{\prime}_D} = 0.001$ and
 ${\bar{C}_D} = 0.8$. The cylinder waviness with λ/Dm = 6.01 has still the ability to suppress the fluid force acting on the cylinder. The reductions in
 ${C^{\prime}_L}$,
 ${C^{\prime}_D}$ and
 ${\bar{C}_D}$ are 91.0 %, 98.5 % and 37.5 %, compared with the circular cylinder counterparts (Rajani, Kandasamy & Majumdar Reference Rajani, Kandasamy and Majumdar2009).
Time histories of (a) CL and CD, and (b) lateral velocity v* sampled at (x*, y*) = (3, 1) along the span; (c) PSD functions of v* at saddle, node and middle planes, respectively. Here, λ/Dm = 6.01, Re = 300.

In order to investigate the wake evolution along the spanwise direction, v* recorded at (x*, y*) = (3, 1) is contoured in the t*–z/λ plane in figure 18(b), and PSD functions of v* at the saddle, node and middle planes are provided in figure 18(c). It is found that the velocity fields for the two wavelengths are asymmetric about the node plane (z/Dm = 1.0), being alternate between the lower (z/Dm = 0–1.0) and upper (z/Dm = 1.0–2.0) wavelengths. The vortex shedding frequency is smaller at the node plane than at the saddle plane, as marked by  $f_1^\ast = 0.16$ and
 $f_2^\ast = 0.22$, respectively (figure 18c). On the other hand, the power spectrum at the middle plane displays three dominant peaks corresponding to
 $f_1^\ast ,f_2^\ast $ and
 $f_2^\ast{-} f_1^\ast $, respectively. The modulation at the low-frequency
 $f_2^\ast{-} f_1^\ast $ stems from the difference in the vortex shedding frequencies between node and saddle planes.
The spanwise (iso-surface of λ 2 = −0.1, coloured by  $\omega _x^\ast $) and streamwise vortices
 $(\omega _x^\ast )$ at instants T 1 and T 2, marked on the top of figure 18(a) are shown in figure 19(a,b). The spanwise vortex tubes for the upper and lower wavelengths are asymmetric at instant T 1, where oblique and nearly straight vortex tubes close to the cylinder are detected for the upper and lower wavelengths, respectively. An opposite scenario takes place at instant T 2, with oblique and nearly straight vortex tubes swapping their sides. This is linked to the difference in the vortex shedding frequencies between node and saddle sections. The streamwise vortices largely appear around the node sections, and the flow interaction between two adjacent nodes is strong. To have a better understanding of the flow topology, time histories of sectional lift coefficient CLs at two nodes (N1, N2) and two saddles (S1, S2) are presented in figure 19(c) while the wake structures at the node and saddle planes at instant T 1 are displayed in figure 19(d). The nodes and saddles are marked in figure 19(a). The fluctuations of CLs are weaker on the saddles (S1, S2) than the nodes (N1, N2), having a higher frequency for the former than for the latter. Interestingly, the CLs signals are nearly antiphase for S1 and S2 sections while they are in phase for N1 and N2 sections (figure 19c). The vortex structures at the node and saddle planes further corroborate that the vortex sheddings at the S1 and S2 planes are antiphase and those at N0, N1 and N2 are in phase (figure 19d). At a low Reynolds number (Re = 100), the wakes at each saddle plane are steady, which renders a possibility of antiphase flow around the two sides of the saddle section. For Re = 300, the wakes at the saddle sections are unsteady, and alternate vortex shedding occurs. Adopting the unsteady wake at the saddle sections, the vortex sheddings on the two sides of the saddle section become asymmetric, and the asymmetric wakes at S1 and S2 alternate with each other. Therefore, such an asymmetric flow along the whole span still can cancel out or weaken the lift force fluctuation on the whole cylinder span.
Spanwise vortices in terms of iso-surface of λ 2 = −0.1 (coloured by streamwise vorticity  $\omega _x^\ast $) and streamwise vortices in terms of iso-surface of
 $\omega _x^\ast = 0.1$ (red) and −0.1 (blue) at instants (a) T 1 and (b) T 2 marked on the top of figures 18(a) and 19(c). (c) Time histories of sectional lift coefficient CLs on two nodes and two saddles. (d) Instantaneous spanwise vorticity structures at node and saddle planes at instant T 1. λ/Dm = 6.01, Re = 300.



