Implications
In this study, insights gained from the identified global changes in metabolites and analysed the main canonical metabolic pathways provided abundant information to better understand the mechanisms involved in (−)-hydroxycitric acid’s (HCA) effect on broiler chickens. Administration of Garcinia cambogia extracts might be a practical way to reduce excessive fat accumulation in animals, and will help the industry to avoid obesity-related problems during the production of broilers.
Introduction
The poultry industry plays an important role in the world economy and chickens are one of the main sources of animal protein worldwide (Malley et al., Reference Márquez, Babio, Bulló and Salassalvadó2015). Commercial production of broiler chickens for meat consumption has become a highly industrialized process. However, modern broiler strains often have excessive abdominal fat deposits that are not attractive to consumers (Fouad and El-Senousey, Reference Fouad and El-Senousey2014). Excess fat needs to be control, as it has a negative impact on poultry production, as evidenced by the increase in feed costs during rearing and a remarkable economic loss to poultry-processing plants (Wu et al., Reference Wu, Deng, Li, Li and Yang2006). Importantly, fat deposition needs to be controlled not only for production characteristics but also for meat quality (Özdoǧan and Akşit, Reference Özdoǧan and Akşit2003).
(−)-Hydroxycitric acid, extracted from the dried fruit rind of Garcinia cambogia, has been demonstrated to inhibit de novo fatty acid synthesis, promote fat oxidation and decrease appetite (Amin et al., Reference Amin, Kamel and Eltawab2011; Márquez et al., Reference Malley, Butts and Wiedmann2012; Oon et al., Reference Oon, Yong, Boon Kee and Swee Keong2013). A previous study was with broilers showed that (−)-HCA reduced food intake, total cholesterol, low-density lipoprotein (LDL) and triglycerides levels (Preuss et al., Reference Preuss, Rao, Garis, Bramble, Ohia, Bagchi and Bagchi2004). Although previous studies investigated the regulatory effects of (−)-HCA on BW gain (Ramalingam and Sridhar Gopalakrishna, Reference Ramalingam and Sridhar Gopalakrishna2015), de novo fatty acid synthesis (Alti̇ner et al., Reference Alti̇ner, Ates, Gursel and Bi̇lal2012; Oon et al., Reference Oon, Yong, Boon Kee and Swee Keong2013), lipid oxidation (Yun et al., Reference Yun, Kim, Min, Jin, Kang and Park2008) and energy expenditure (Leonhardt et al., Reference Leonhardt, Hrupka and Langhans2001) in animals and humans, the precise biochemical mechanism is not well understood.
Metabolomics can measure the metabolic response to pathophysiological stimuli or genetic modification quantitatively (Nicholson et al., Reference Nicholson, John, Lindon and Elaine2002). Using high-throughput analytical tools, a large number of endogenous metabolites can be determined to clarify the intrinsic differences between samples (Yi et al., Reference Yi, Shi, Wang, Huang, Xia, Xing, Peng and Wang2016). Our previous study showed no statistically significant differences in daily feed intake in broiler chickens supplemented with (−)-HCA, while there was a decrease in BW and average daily gain. The absolute and relative abdominal fat weight in the (−)-HCA groups tended to be lower than in the control group (Han et al., Reference Han, Li, Peng and Ma2016b). Supplementation with (−)-HCA also inhibited lipogenesis by reducing ATP-citrate lyase, sterol regulatory element binding protein-1c and fatty acid synthase (FAS) expression, and accelerated lipolysis by enhancing hepatic lipase and peroxisome proliferators-activated receptor α (PPARα) expression, which eventually led to reduced abdominal fat deposition in broiler chickens (Han et al., Reference Han, Li, Peng and Ma2016b). Therefore, this study aimed to further investigate the global changes in metabolites, canonical metabolic pathways and pathways associated with fat metabolism in broiler chickens. The results will provide a better understanding of the mechanism of (−)-HCA’s effects in animals.
Material and methods
Materials and reagents
Myristic-1, 2-13C2 acid (99 atom %13C, as the stable-isotope-labelled internal standard compound, Isotec, England), methoxyamine hydrochloride (purity 98%; Sigma-Aldrich, Munich, Germany), alkane standard solution (C8–C40, Sigma-Aldrich, Buchs, Switzerland) and pyridine (⩾99.8%, Sigma-Aldrich, Bangalore, India) were used in this study. N-methyl-n-trimethylsilyltrifluoroacetamide (MSTFA) containing 1% trimethylchlorosilane (TMCS) was purchased from Pierce Corporate (Rockford, USA). Methanol and n-heptane (HPLC) grade were obtained from Merck (Darmstadt, Germany). High-purity water was prepared from a Milli-Q gradient water purification system (Billerica, USA) was used for all protocols in this study.
Garcinia cambogia extracts
Garcinia cambogia extracts were obtained from An Yun Co. Ltd (Zhengzhou, China). The Garcinia cambogia extract contained 56% to 58% (−)-HCA, 12% to 14% cellulose, 5.5% to 6% α-d-melibiose, 2.5% to 3% β-d-lactin, 1.5% to 2% d-mannopyranose, 11% to 12% oxophenic acid, 2% to 3% octadecyl alcohol, 3.5% to 4% coenzyme A, and 1.5% to 2% inorganic elements.
Animals and treatment
In all, 120 1-day-old Ross 308 broiler chickens (Chicken Breeding Company, Wuxi, China) were divided into four groups, with three replicates of 10 birds in each group. The birds were offered the same basal diet from 1 to 42 days (starter phase=1 to 21 days; finisher phase=22 to 42 days) with nutrient levels recommended for broiler chickens by the National Research Council with some modification (Yang et al., Reference Yang, Chen, Hong, Liu and Liu2006). The composition and nutrient levels of the diet were reported by Han et al. (Reference Han, Li, Peng and Ma2016b). All animal protocols were approved by the Institutional Animal Care and Use Committee of Nanjing Agricultural University (China). During the finisher phase, broilers chickens were fed diets supplemented with 0, 1000, 2000 and 3000 mg/kg (−)-HCA, respectively. Broilers chickens were housed in coops under continuous lighting. The temperature was 32°C for the first 5 days and was then gradually reduced according to normal management practices to 22°C. The broiler chickens were floor-reared under natural lighting during the finisher phase. At the end of the finisher phase, the birds were deprived of feed for 12 h before being weighed and sacrificed. Blood samples were collected and centrifuged at 1500×g and at 4°C for 10 min to obtain the serum, which was then stored at −20°C until analysis.
Sample preparation and derivatization
Serum samples were pretreated and analysed according to previously published methods (Jiye et al., Reference Jiye, Johan, Jonas, Johansson, Jonsson, Henrik, Marklund and Thomas2005). Briefly, serum samples were thawed by incubation at 37°C for 15 min and vortexed before use. For each 50 μl aliquot of serum, 200 μl of methanol containing Myristic-1, 2-13C2 acid (12.5 μg/ml, used as the internal standard) was added. The solution was extracted vigorously for 5 min, incubated at 4°C for 1 h, and then centrifuged at 20 000×g for 10 min at 4°C. The supernatant (100 μl) was then transferred to a fresh GC vial and dried under a vacuum at 20°C. The residue in the vial was first dissolved in 30 μl of 10 mg/ml methoxyamine pyridine solution at room temperature for 16 h and then 30 μl of MSTFA was added to the vial (containing 1% TMCS). The mixture was incubated at room temperature for 1 h. After incubation, 30 μl of 30 mg/ml methyl-myristate heptane (an external standard) was added to the mixture for gas chromatography-mass spectrometry analysis.
Gas chromatography coupled to time-of-flight mass spectrometry analysis
The derivatized sample (0.5 μl) was injected using an auto-sampler into a GC/MS QP2010Ultra/SE (Shimadzu, Japan) equipped with RTx-5MS (J&W Scientific, Folsom, USA) fused-silica capillary column (30×0.25 mm i.d.). Helium was used as the carrier gas at a constant flow rate of 1.5 ml/min through the column. The injector temperature was set at 250°C. The column temperature was initially maintained at 80°C for 3 min and then increased from 80°C to 300°C at a rate of 20°C/min, where it was held for 5 min. The transfer line temperature was set at 220°C and the ion source temperature maintained at 200°C. Ions were generated by a 70-eV electron beam at a current of 3.2 mA. Masses were acquired from m/z 50 to 800 at a rate of 30 spectra/s, and the acceleration voltage was turned on after a solvent delay of 300 s.
Identification of differential metabolites and data analysis
ChromaTOF v4.22 software (Leco Corporation, saint Joseph, USA) was used to analyse the metabolites qualitatively and quantitatively (Pei-Pei et al., Reference Pei-Pei, Jian and Ying-Jin2009). Automatic peak detection and mass spectrum deconvolution were performed using a peak width of 2 s. The signal-to-noise (S/N) values were based on the masses chosen by the software for quantification, and chromatographic peaks with S/N ratios lower than 20 were excluded. Each metabolite was identified by comparing its mass spectrum and retention index with those in the National Institute of Standards and Technology mass spectral library (REPLIB, MAINLIB, MAXPLANCKQ, NIST-SALTS, NIST-MSMS, NIST-RI, T-MORITZ and JIYE-2012) and Wiley Online library (Wiley-VCH Verlag GmbH & Co., Weinheim, Germany). Quantitative analysis was carried out by normalizing each peak with the internal standards. Data for metabolites were first analysed by principal component analysis (PCA) to provide the overall distribution of the metabolites, and then a partial least-squares-discriminant analysis (PLS-DA) model was used to demonstrate the relationships among serum metabolites. Principal component analysis and PLS-DA were performed using SIMCA-P 11 software (Umetrics, Umeå, Sweden) to identify the metabolites differentially, as described previously (Jiye et al., Reference Jiye, Johan, Jonas, Johansson, Jonsson, Henrik, Marklund and Thomas2005), and significantly different metabolites were screened using a ‘variable importance in the projection’ (VIP) plot. To obtain the best results, the VIP results were combined with the result of a t-test in this study. In addition, small molecule pathway analyses were performed using metabolite set enrichment analysis and Kyoto encyclopedia of genes and genomes (KEGG) pathway enrichment analysis to explore the metabolic pathways involving the serum metabolites in broiler chickens supplemented with (−)-HCA.
Results
Differences of serum metabolites in broiler chickens supplemented with (−)-hydroxycitric acid
A total of 93 metabolites involved in the metabolism of amino acids, carbohydrates, uric acid and lipids were identified and analysed quantitatively in detail (Supplementary Material Table S1). In all, 35 showed significant differences among the (−)-HCA treatment groups and the control group. In the 1000 mg/kg (−)-HCA treatment group, 25 metabolites differed significantly from the control group. Alanine, glycine, serine, ornithine, glutamine, leucine, beta-alanine, threonic acid, 2-hydroxybutyric acid, 3-hydroxybutyric acid, alpha-aminobutyric acid, 2,3-dihydroxybutanoic acid, aspartic acid, malic acid, pyroglutamic acid, citric acid, glycolic acid, fumaric acid and alpha-glycerophosphate contents were elevated significantly (P<0.05). By contrast, lactic acid, palmitic acid, monostearin and uric acid contents were significantly reduced (P<0.05). In the 2000 mg/kg (−)-HCA treatment group, 22 identified metabolites were significantly different compared with those in the control group. Alanine, serine, β-alanine, asparatic acid, pyroglutamic acid, ornithine, glutamine, phenylethanolamine, 2-dexoy-d-galactose, creatinine, inositol, 2-hydroxybutyric acid, 3-hydroxybutyric acid, alpha-aminobutyric acid, 2,3-dihydroxybutanoic acid, fumaric acid and malic acid contents were increased significantly (P<0.05), whereas the lanthionine, uric acid, palmitic acid and monostearin contents were significantly decreased (P<0.05). In the 3000 mg/kg (−)-HCA treatment group, 23 identified metabolites were significantly different when compared with the control group. Alanine, serine, β-alanine, leucine, asparatic acid, pyroglutamic acid, dgalactono-1,4-lactone, inositol, alpha-aminobutyric acid, 2,3-dihydroxybutanoic acid, malic acid, fumaric acid, and creatinine contents were increased significantly (P<0.05). By contrast, cysteine, lanthionine, lyxose, fructose, monostearin, arachidonic acid, stearic acid, palmitic acid, uric acid and urea nitrogen contents were decreased significantly (P<0.05). All of the above data was shown in the Supplementary Material Table S1.
Key metabolites identified by a metabolomics-based discrimination model
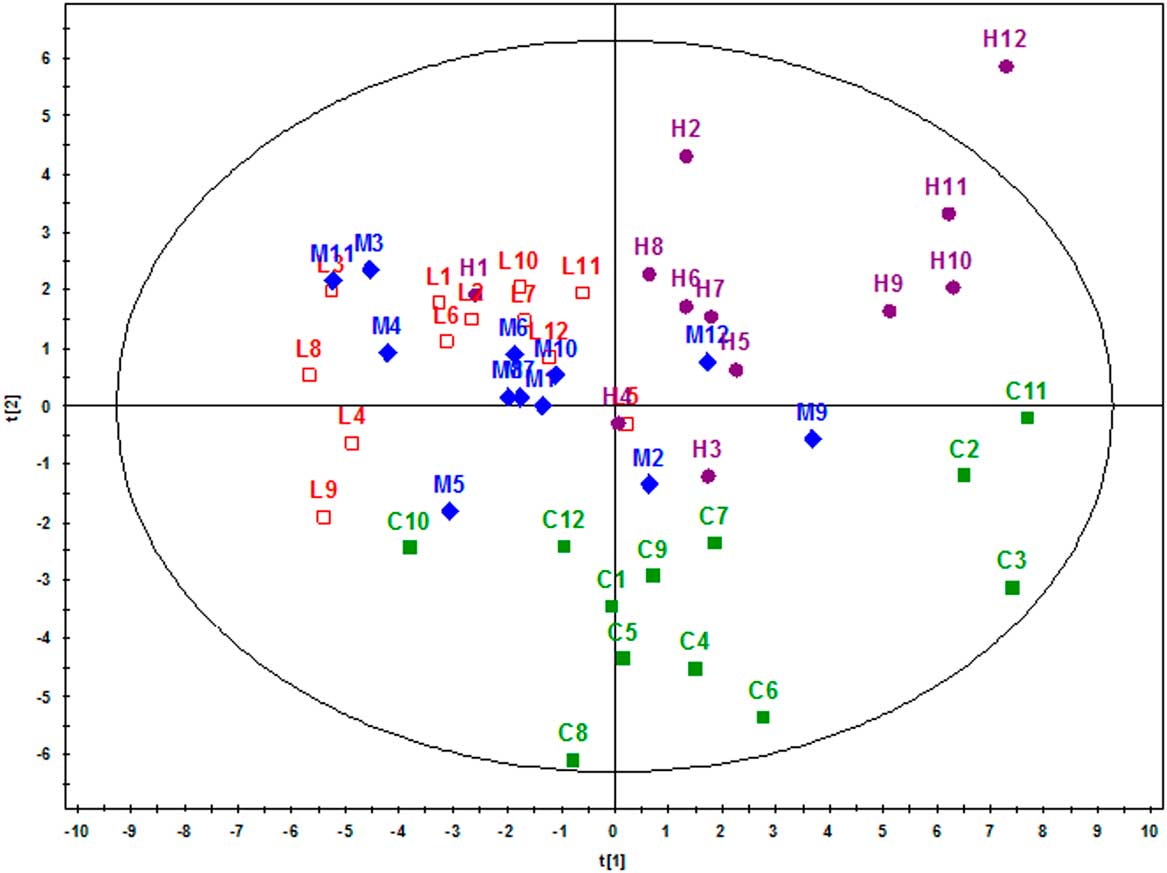
As shown in Figure 1, the serum sample clustered into three distinct groups according to treatment (different dose of HCA or control). The R2X and Q2 scores were 0.89 and 0.92 in this experiment, respectively. The R2X and Q2 values are considered to be good when their values are close to 1. Thus, the performance of the two-component regression model was considered satisfactory. Data from the serum samples in the 3000 mg/kg (−)-HCA treatment group were scattered loosely around the right-hand corner of the figure, whereas the data for 2000 mg/kg and 1000 mg/kg (−)-HCA treatment groups were scattered loosely around the left-hand corner of the figure, and all were distant from the control group (in the lower part of the figure).The results also showed that data from the serum samples in the 1000 mg/kg and 2000 mg/kg (−)-HCA treatment groups tended to cluster closely.
Principal components analysis (PCA) model of serum metabolites in broiler chickens. The score indicates a clear separation of the control group and (−)-hydroxycitric acid (HCA) treatment groups (C: presents control group; L: presents 1000 mg/kg (−)-HCA treated group; M: presents 2000 mg/kg (−)-HCA treated group; H: presents 3000 mg/kg (−)-HCA treated group. 1 to 12 represents the number of sample in each group, respectively).

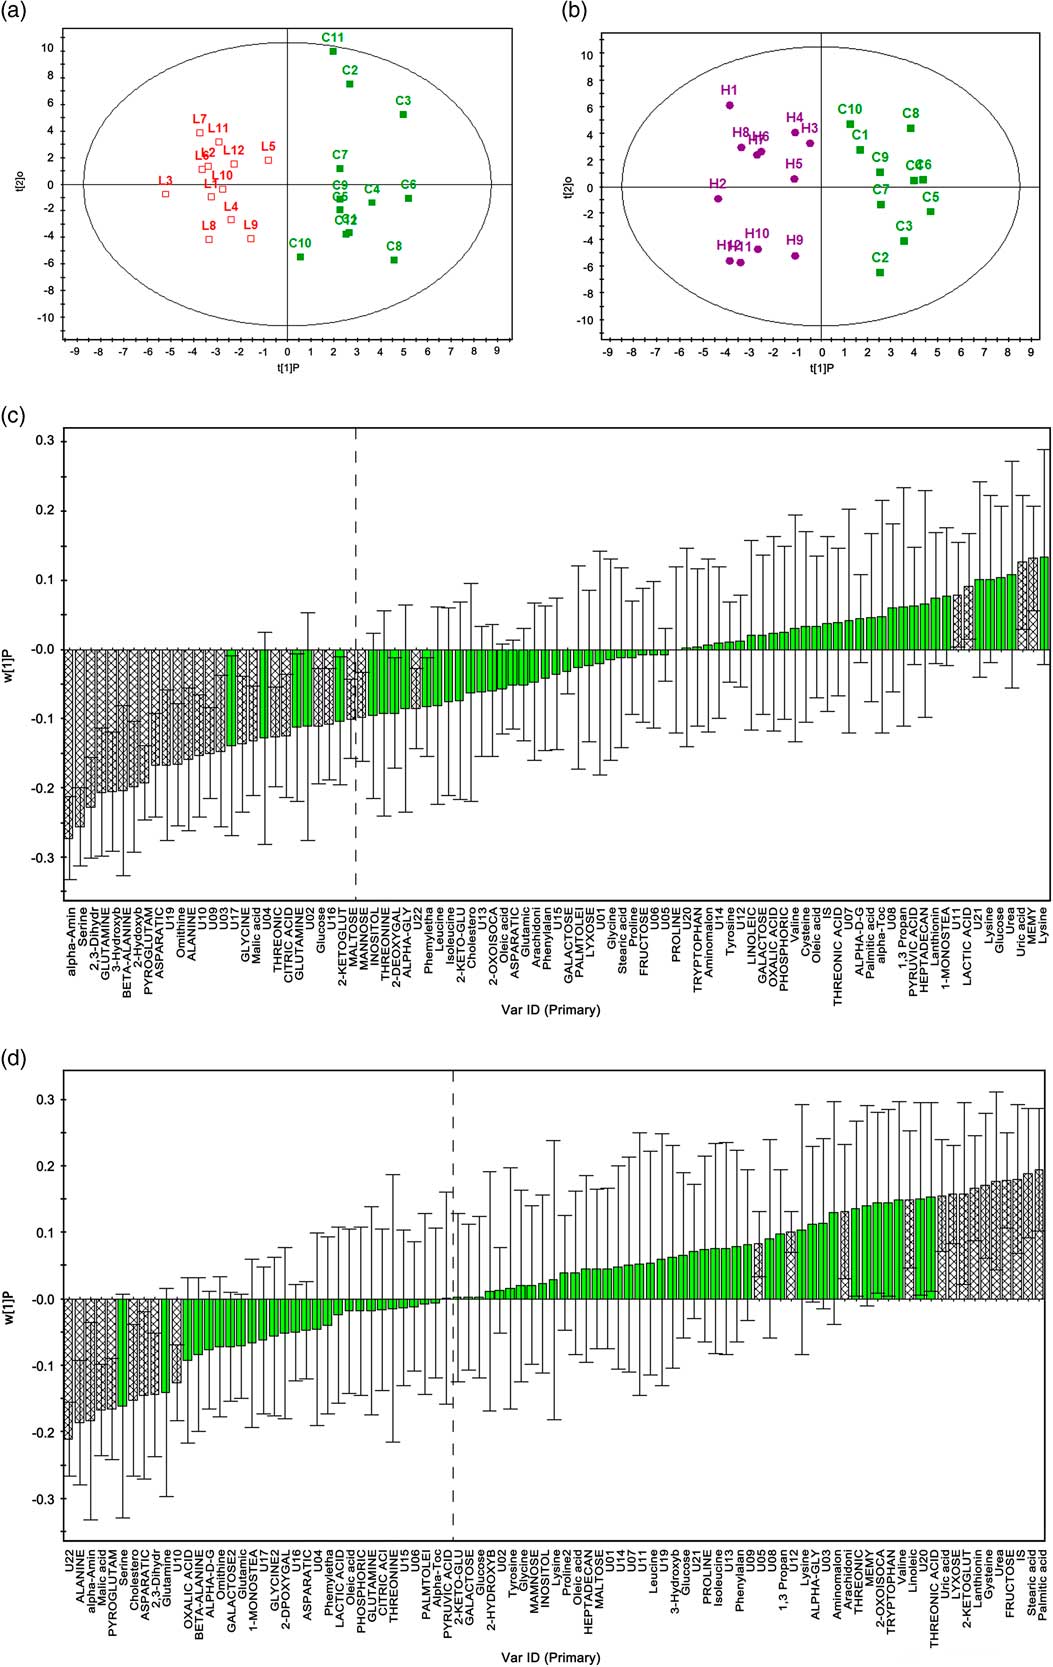
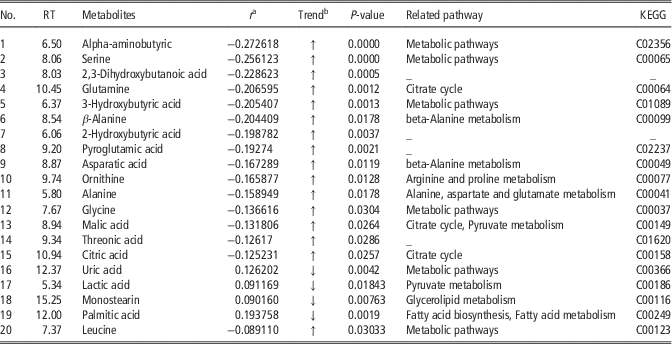
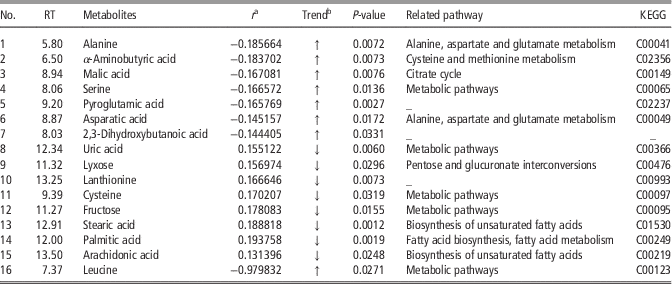
The obvious separation between the data from the (−)-HCA treatment groups and control group, and the lack of obvious separation of the data from the 1000 mg/kg and 2000 mg/kg (−)-HCA treatment groups, prompted us to use the PLS-DA model to establish the discrimination between control group and the 1000 mg/kg (Figure 2a, R2X=0.83, R2Y=0.923, and Q2=0.875) or the 3000 mg/kg (Figure 2b, R2X=0.855, R2Y=0.89 and Q2 =0.869) (−)-HCA treatment groups. After the metabolic discrimination models were established by PLS-DA, variables were selected and tested to identify the differences in metabolites between the control group and the (−)-HCA treatment groups. The VIP parameter reflects indirectly the metabolite changes after (−)-HCA treatment. The VIP values of 91 metabolites in the 1000 mg/kg (−)-HCA treatment group (Figure 2c) and 95 metabolites in the 3000 mg/kg (−)-HCA treatment group (Figure 2d) were calculated. A total of 20 metabolites were altered significantly in the 1000 mg/kg (−)-HCA treatment group (P<0.05). The content of α-aminobutyric acid, serine, leucine, 2,3-dihydroxybutanoic acid, glutamine, 3-hydroxybutyric acid, β-alanine, 2hydroxybutyric acid, pyroglutamic acid, asparatic acid, ornithine, alanine, glycine, malic acid, threonic acid and citric acid were elevated, while the content of uric acid, lactic acid, palmitic acid and monosterine contents were decreased in the 1000 mg/kg (−)-HCA treatment group compared with the control group (Table 1). In all, 16 metabolites were altered significantly in the 3000 mg/kg (−)-HCA treatment group (P<0.05). The content of α-aminobutyric acid, serine, leucine, 2,3-dihydroxybutanoic acid, asparatic acid, alanine, malic acid and pyroglutamic acid were elevated. The contents of uric acid, lyxose, lanthionine, arachidonic acid, cysteine, fructose, stearic acid and palmitic acid contents were decreased (Table 2).
Partial least-squares-discriminant analysis (PLS-DA) model and ‘variable importance in the projection’ (VIP) of serum metabolites in broiler chickens. (a) In the PLS-DA model, the score indicates a clear separation of samples in the 1000 mg/kg (−)-hydroxycitric acid (HCA) treatment group (L) and control group (C). (b) In the PLS-DA model, the score indicates a clear separation of samples in the 3000 mg/kg (−)-HCA treatment group (H) and control group (C); 1 to 12 represents the number of sample in each group, respectively. (c) The VIP plot of the sample tested from the 1000 mg/kg (−)-HCA treatment group and control group. (d) The VIP plot of sample tested from the 3000 mg/kg (−)-HCA treatment group and control group. In (a) and (b), 1 to 12 represents the number of sample in each group, respectively. In (c) and (d), a positive value represents downregulation and a negative value represents upregulation in the VIP plot, the green bars and grey bars were represent important or relative important relevant to (−)-HCA treatment.

Differential serum metabolites and related pathways for broiler chickens fed a control diet or a diet supplemented with 1000 mg/kg (−)-hydroxycitric acid

RT=retention time; KEGG=Kyoto encyclopedia of genes and genomes.
a Correlation coefficients.
b Change trend compared with control group. (↑): upregulated. (↓): downregulated.
Differential serum metabolites and related pathways for broiler chickens fed a control diet or a diet supplemented with 3000 mg/kg (−)-hydroxycitric acid

RT=retention time; KEGG=Kyoto encyclopedia of genes and genomes.
a Correlation coefficients.
b Change trend compared with control group. (↑): upregulated. (↓): downregulated.
Metabolic impact analysis
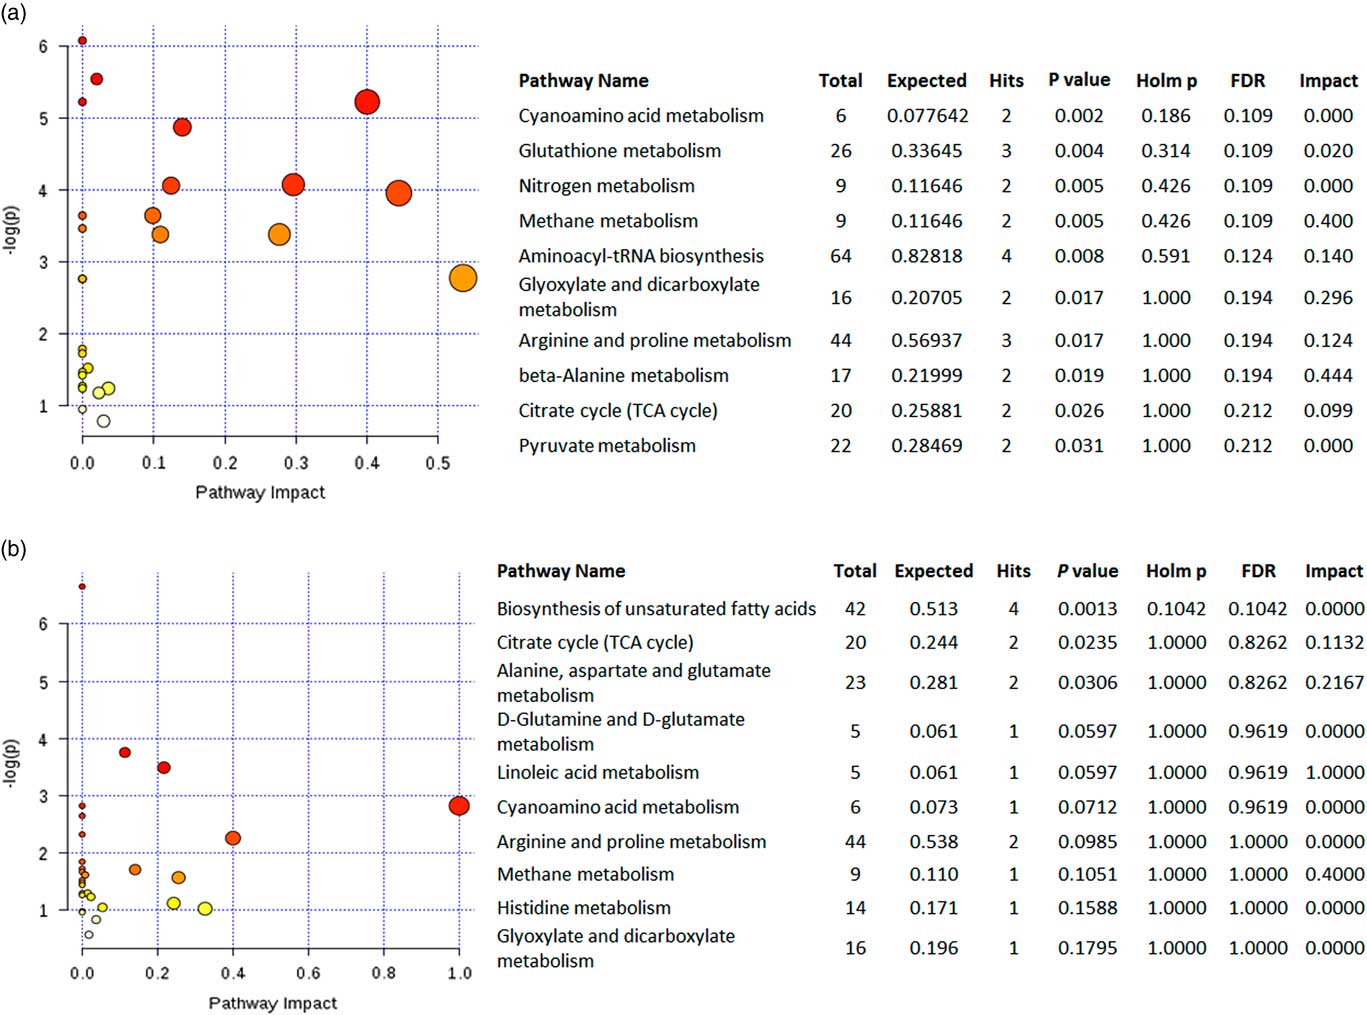
The results showed that in the 1000 mg/kg (−)-HCA treatment group, the differential metabolites were involved mainly in cyanoamino acid metabolism; glutathione metabolism; nitrogen metabolism; methane metabolism; aminoacyl-tRNA biosynthesis; glyoxylate and dicarboxylate metabolism; arginine and proline metabolism; β-alanine metabolism; propanoate metabolism; the citrate cycle; and pyruvate metabolism (Figure 3a). In the 3000 mg/kg (−)-HCA treatment group, the affected metabolites were involved mainly in the biosynthesis of unsaturated fatty acids; the citrate cycle; alanine, aspartate and glutamate metabolism; d-glutamine and d-glutamate metabolism; linoleic acid metabolism; cyanoamino acid metabolism; arginine and proline metabolism; methane metabolism; histidine metabolism; and glyoxylate and dicarboxylate metabolism (Figure 3b).
Metabolite set enrichment analysis of serum differential metabolites in broiler chickens. (a) Represents the 1000 mg/kg (−)-hydroxycitric acid (HCA) treatment group. (b) Represents the 3000 mg/kg (−)-HCA treatment group. All matched pathways are displayed as circles, the colour and size of each circle was based on the P-value and pathway impact value from the table (right), respectively. Total=the total number of metabolite in that set pathway; Expected=the expectation value; Hits=the number of metabolites in the experimental set matching the pathway set; Holm P=the P value adjusted by Holm-Bonferroni method; FDR=the P value adjusted using False Discovery Rate; Impact=the pathway impact value.

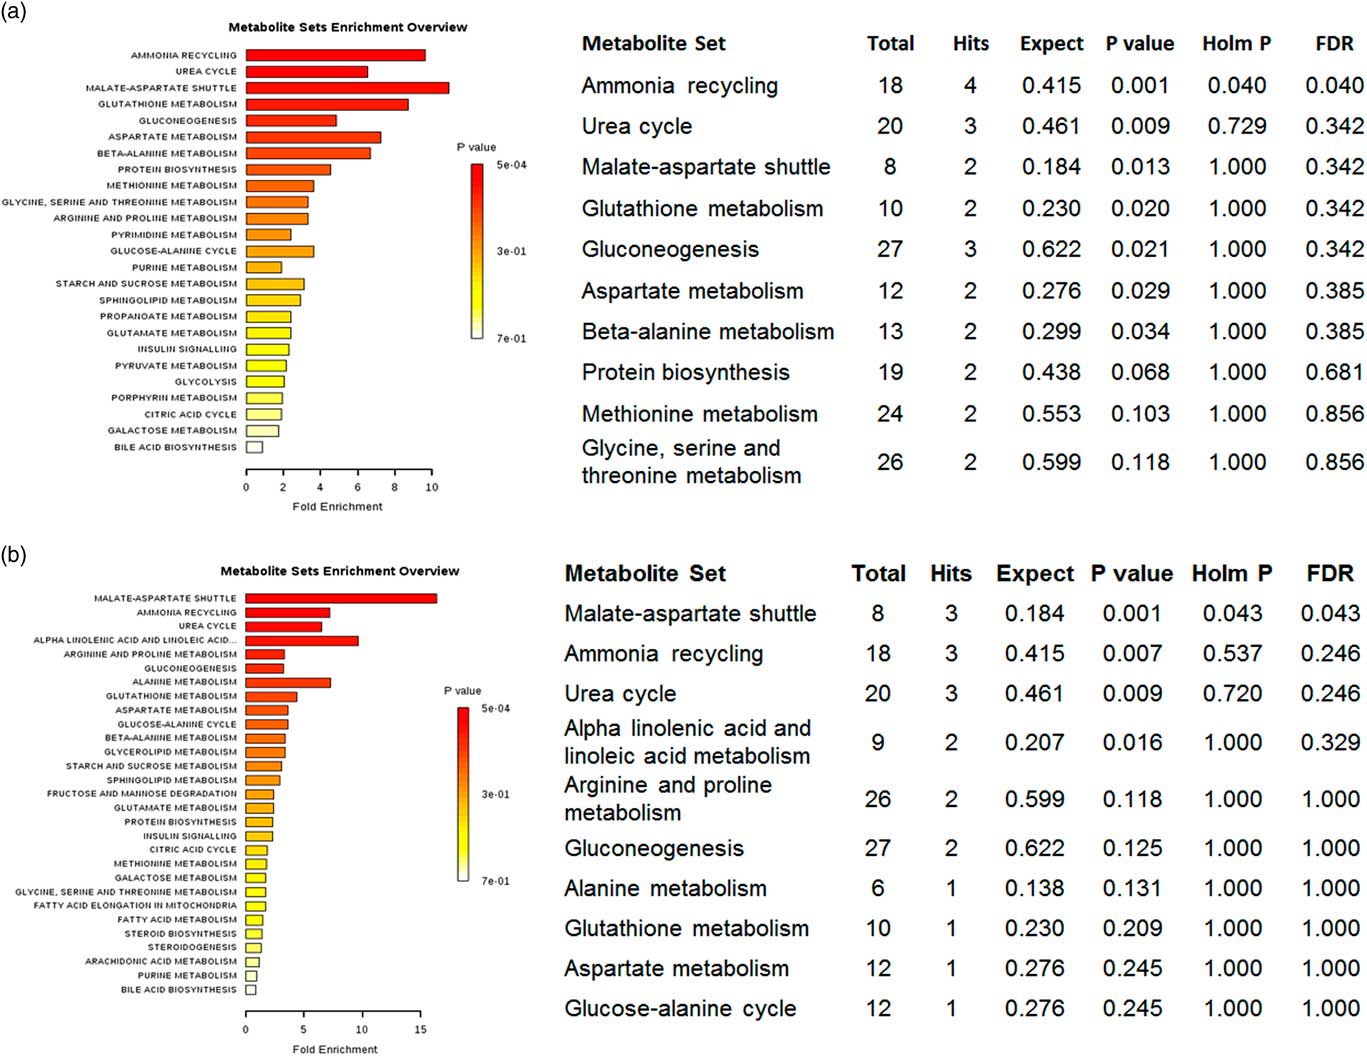
As shown in Figure 4a, metabolites in the 1000 mg/kg (−)-HCA treatment group were involved mainly in ammonia recycling; the malate-aspartate shuttle; glutathione metabolism; gluconeogenesis; aspartate metabolism; β-alanine metabolism; protein biosynthesis; methionine metabolism; and glycine, serine and threonine metabolism. As shown in Figure 4b, metabolites in the 3000 mg/kg (−)-HCA treatment group were involved mainly in the malate-aspartate shuttle; ammonia recycling; α-linolenic acid and linoleic acid metabolism; arginine and proline metabolism; gluconeogenesis; alanine metabolism; glutathione metabolism; aspartate metabolism; the glucose-alanine cycle; β-alanine metabolism; and glycerolipid metabolism. It is worth noting that most pathways analysed by KEGG enrichment were coincident with the results of metabolite set enrichment analysis.
Kyoto encyclopedia of genes and genomes (KEGG) pathway enrichment analysis of serum differential metabolites in broiler chickens. (a) Represents the 1000 mg/kg (−)-hydroxycitric acid (HCA) treatment group; (b) represents the 3000 mg/kg (−)-HCA treatment group. All the matched pathways are displayed in columns, and the length represents the fold change of enrichment and the colour represents the P-value. Total: the total number of metabolite in that set pathway; Expected=the expectation value; Hits=the number of metabolites in the experimental set matching the pathway set; Holm P=the P-value adjusted by Holm-Bonferroni method; FDR=the P-value adjusted using False Discovery Rate; Impact=the pathway impact value.

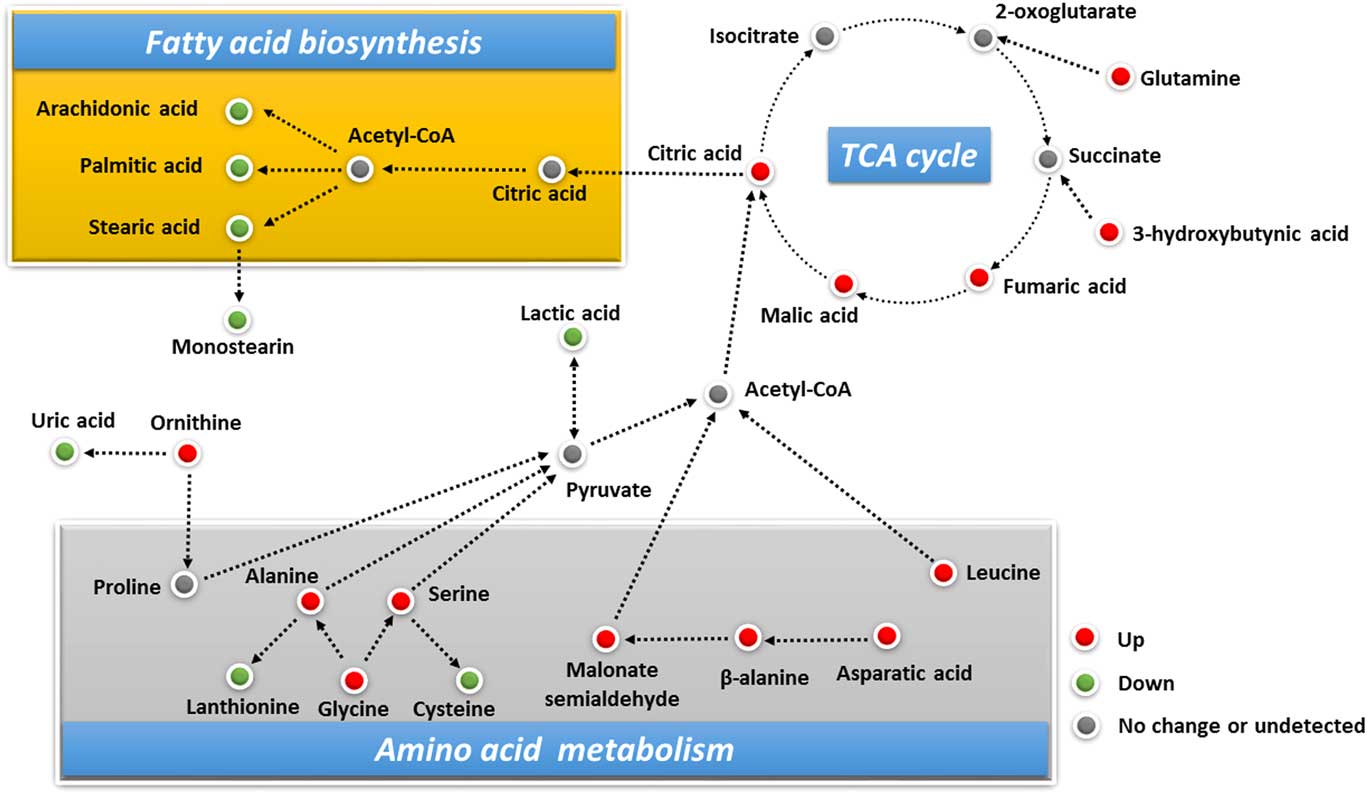
The above analysis showed almost no differences in the total metabolic pathways affected between the 1000 mg/kg and 3000 mg/kg (−)-HCA treatment groups; the discrimination was reflected mainly in the impact degree of the different metabolic pathways. An integrative plot of serum metabolite changes related to the metabolic pathways is shown in Figure 5. Taking the different metabolites and metabolic pathways into consideration, we found that treatment with 1000 mg/kg (−)-HCA increased mainly the amino acid contents and decreased the uric acid level, whereas 3000 mg/kg (−)-HCA treatment decreased mainly the contents of fatty acids and uric acid in broiler chickens. Overall the results suggest that (−)-hydroxycitric acid treatment enhanced protein synthesis and inhibited fat deposition.
Integrative view plot of main serum metabolite changes in broiler chickens. The metabolites whose contents increased are shown by red circles and those that decreased are shown by green circles; grey circles indicate metabolites whose contents did not change or were undetected in this study.

Discussion
To the best of our knowledge, this is the first study of the mechanisms of (−)-HCA’s effects based on changes in serum metabolites and metabolic pathways in an animal model. Our results showed that 20 metabolites in the 1000 mg/kg (−)-HCA treatment group, and 16 metabolites in 3000 mg/kg (−)-HCA treatment group, were altered significantly in broiler chickens. Metabolite set enrichment analysis and KEGG pathway enrichment analysis indicated that these metabolites were associated mainly with amino acid metabolism, protein synthesis, the citric acid cycle, uric acid and fatty acid synthesis.
The present study showed that1000 mg/kg (−)-HCA treatment increased the contents of alanine, glycine, serine, glutamine, leucine, β-alanine, threonic acid and asparatic acid significantly; meanwhile the alanine, serine, β-alanine, leucine and asparatic acid contents also increased notably in the 3000 mg/kg (−)-HCA treatment group. Although we had found that (−)-HCA decreased BW gain by reducing the abdominal fat deposition in broiler chickens, while it effect on the protein synthesis was not investigated in this study (Han et al., Reference Han, Li, Peng and Ma2016b). In addition, our previous study had shown that (−)-HCA treatment significantly increased the protein content in the liver and muscle by altering the metabolic direction of amino acids in rats (Han et al., Reference Han, Li, Wang and Ma2016a). Thus, we presumed that (−)-HCA supplementation altered the metabolic pathways of amino acids, which in turn promoted protein synthesis in broiler chickens. Amino acids are considered as an important energy sources for organism when energy substrates in the body are low. Some studies have reported that serum levels of amino acids increase under an energy demanding state (Bei et al., Reference Bei, Jia, Zhang, Xin, Ming, Shi, Zha, Shi, Huang and Yang2016; Zhou et al., Reference Zhou, Zhou, Elsheikha, Zhao, Suo and Zhu2016). Our previous study showed that supplementation with (−)-HCA increased hepatic glycogen content, while no changes were observed on the serum glucose content in broiler chickens (Han et al., Reference Han, Li, Peng and Ma2016b). In this study, no changes were also observed in the serum glucose content, which indicated that there was sufficient energy to meet the body’s requirements. In addition, metabolites set enrichment and KEGG pathway enrichment analysis showed that aminoacyl-tRNA biosynthesis, protein biosynthesis and nitrogen metabolism were altered significantly in the 1000 mg/kg (−)-HCA treatment group. In contrast to mammals, uric acid is the end product of protein metabolism in poultry. Importantly, our results showed that both 1000 and 3000 mg/kg (−)-HCA treatment decreased the serum uric acid content in broiler chickens. Therefore, we hypothesized that (−)-HCA treatment promoted protein synthesis by regulating metabolic pathways for amino acids in broiler chickens, and this activity might depend on the dose of (−)-HCA.
In this study, most of the amino acids that were elevated in serum were involved in β-alanine metabolism, pyruvate metabolism and the critic acid cycle. As shown in Figure 5, glycine can be converted into serine or alanine, and then to pyruvate, cysteine or lanthionine. The reduced cysteine and lanthionine contents suggested that serine or alanine were mainly converted into pyruvate in broiler chickens after (−)-HCA treatment. In the β-alanine metabolic pathway, asparatic acid is converted to β-alanine, and then to acetyl-CoA via an initial transformation to malonate semialdehyde. In addition, leucine is also converted into acetyl-CoA and then enters the citric acid cycle. Glutamine can be convert to 2-oxoglulatate or pyroglutamic acid. The pyroglutamic acid content was decreased and glutamine content was elevated in this study. It had reported that high level of glutamine corresponded with increased muscle protein synthesis in broiler chickens (Aggrey et al., Reference Aggrey, Lee, Karnuah and Rekaya2014). The lactic acid content was decreased significantly in the (−)-HCA treatment group, which indicated that pyruvate was mainly produced in the mitochondria and oxidative decarboxylation converted it into acetyl-CoA. Consistent with the amino acid metabolism, our results showed that the fumaric acid, malic acid and citric acid contents were evaluated significantly in broiler chickens after (−)-HCA treatment. Taken together, these results indicated that (−)-HCA treatment promoted the citric acid cycle in broiler chickens.
Many studies reported that in vitro and in vivo (−)-HCA supplementation suppresses de novo fatty acid synthesis in animals (Alti̇ner et al., Reference Alti̇ner, Ates, Gursel and Bi̇lal2012; Oon et al., Reference Oon, Yong, Boon Kee and Swee Keong2013). Recently, our study verified that (−)-HCA attenuates fat accumulation by regulating gene expressions associated with lipogenesis and lipolysis in broiler chickens (Han et al., Reference Han, Li, Peng and Ma2016b). However, until now, there has been no direct evidence to support the inhibition by (−)-HCA on fatty acid synthesis in an animal by detecting the changes of fatty acid content. Our results showed that the palmitic acid content was decreased in the 1000 mg/kg (−)-HCA treatment group, and the stearic acid, palmitic acid and arachidonic acid contents in the 3000 mg/kg (−)-HCA treatment group were decreased significantly in broiler chickens. The findings suggest that (−)-HCA treatment inhibited fatty acid synthesis. This results also in consist with the reported that supplemental (−)-HCA inhibited lipogenesis by inhibiting ATP-citrate lyase, sterol regulatory element binding protein-1c and fatty acid synthase expression which eventually led to the reduced abdominal fat deposition in broiler chickens (Han et al., Reference Han, Li, Peng and Ma2016b). Stearic acid was found to be associated more frequently with low-density lipoprotein-cholesterol (LDL-C) compared with other saturated fatty acids (Hunter et al., Reference Hunter, Jun and Kris-Etherton2009). Similarly, our previous study showed that the serum LDL-C content was decreased significantly in broiler chickens after treated with 3000 mg/kg (−)-HCA (Han et al., Reference Han, Li, Peng and Ma2016b). Palmitic acid is the first fatty acid produced during fatty acid synthesis and is the precursor of longer fatty acids; it is also a major body component of animals (Baker and Schotz, Reference Baker and Schotz1967). Stearic acid and palmitic acid, which are both saturated fatty acids that form glycerides for storage in animals (Lossow and Chaikoff, Reference Lossow and Chaikoff1955), were notably decreased in broiler chickens after (−)-HCA treatment. In addition, our results showed that (−)-HCA treatment deceased the monostearin content significantly in broiler chickens. Arachidonic acid is a polyunsaturated fatty acid present in phospholipids (especially phosphatidylethanolamine, phosphatidylcholine and phosphatidylinositides) of cells membranes in the body. Skeletal muscle is a specific site for arachidonic acid retention, accounting for an average of 10–20% of the phospholipid fatty acid content (Smith et al., Reference Smith, Atherton, Reeds, Mohammed, Jaffery, Rankin, Rennie and Mittendorfer2009). Stearic acid, palmitic acid and arachidonic acid are activated by acyl-CoA, and then these fatty acids participate in further cell functions via their incorporation into triglycerides, cholesterol esters and phospholipids of cell membranes. In addition, metabolites pathway analysis showed that fatty acid synthesis was altered in broiler chickens after (−)-HCA treatment. Combined with the above results, we hypothesized that (−)-HCA promoted the citric acid cycle, which in turn reduced the cytosolic acetyl-CoA, resulting in inhibition of fatty acid synthesis in broiler chickens.
In conclusion, our results showed that (−)-HCA inhibited fatty acid synthesis by promoting the citric acid cycle, which eventually reduced the cytosolic acetyl-CoA content in broiler chickens (Figure 5). In addition, the present study identified global changes in metabolites and analysed the main canonical metabolic pathways in broiler chickens supplemented with (−)-HCA. These results will lead to a better understanding of the mechanism of (−)-HCA’s effects in animals.
Acknowledgements
This work was supported by grants from the National Natural Science Foundation of China (No. 31572483) and the Priority Academic Program Development of Jiangsu Higher Education Institutions (PAPD).
Supplementary material
To view supplementary material for this article, please visit https:/doi.org/10.1017/S175173111700221X