1 Introduction
Conjoint analysis is a factorial survey experiment that is designed to measure multidimensional preferences. In a typical application, respondents are presented with a pair of hypothetical profiles whose attributes are randomly selected, and are then asked to choose their preferred profile. Examples of such profiles include political candidates (e.g., Teele, Kalla, and Rosenbluth, Reference Teele, Kalla and Rosenbluth2018), immigrants (e.g., Hainmueller and Hopkins, Reference Hainmueller and Hopkins2015), and public policies (e.g., Ballard-Rosa, Martin, and Scheve, Reference Ballard-Rosa, Martin and Scheve2017). Although it has been extensively used in marketing research (e.g., Green, Krieger, and Wind, Reference Green, Krieger and Wind2001; Marshall and Bradlow, Reference Marshall and Bradlow2002), conjoint analysis has quickly gained popularity in political science due to its wide applicability and relative simplicity (Hainmueller, Hopkins, and Yamamoto, Reference Hainmueller, Hopkins and Yamamoto2014). Indeed, as shown in Figure 1, the number of major political science journal articles that utilize conjoint analysis has increased dramatically over the last 5 years.
Recent growth of conjoint analysis and use of the uniform distribution for randomization in Political Science journal articles. Darker (lighter) fill represents the proportion of articles in which all the factors are randomized with the uniform (other) distribution. 88% of all reviewed articles use the uniform distribution. The plot is based on a review of articles published in political science journals from 2014 to 2018. See Supplemental Appendix A for the information about how the review was conducted.

The most commonly used quantity of interest in conjoint analysis is the average marginal component effect (AMCE), which represents the causal effect of changing one attribute of a profile while averaging over the distribution of the remaining profile attributes (Hainmueller et al., Reference Hainmueller, Hopkins and Yamamoto2014). Because conjoint analysis often involves many attributes, averaging over their distribution makes the interpretation of causal effects simpler and more practical than conditioning on their specific values. For example, a researcher may be interested in the AMCE of candidate’s gender that averages over the distribution of other candidate characteristics such as age, education, race, and policy positions. Thus, the definition of the AMCE critically depends on the distribution used to average over profile attributes.
Unfortunately, while this point is theoretically understood, in practice little attention has been paid to the choice of this distribution. As Figure 1 demonstrates, nearly 90% of the existing conjoint analyses use the uniform distribution. The problem is that the resulting estimate of the AMCE, which we call the uniform AMCE (uAMCE), gives equal weights to all conjoint profiles even when some of them are unrealistic from a substantive point of view. Ignoring the distribution of profiles fundamentally contradicts the key promise of conjoint analysis that the provision of information about several profile attributes makes the choice task realistic for respondents (Hainmueller, Hangartner, and Yamamoto, Reference Hainmueller, Hangartner and Yamamoto2015). In fact, if other attributes do not systematically affect respondents’ evaluation of the main attribute of interest, then one could simply elicit preferences over each attribute separately, making a conjoint experiment unnecessary. Therefore, conjoint analysis is beneficial precisely when we expect multiple attributes to jointly affect human decision making, and this is also the exact setting where the choice of profile distribution affects estimates of the AMCE the most.
In this paper, we study how the choice of profile distribution affects the conclusions of conjoint analysis. We define the population AMCE (pAMCE), which averages over the distribution of profile attributes in a target population of interest. Unlike the uAMCE, which is based on the uniform distribution, the pAMCE accounts for the relative frequency with which each profile occurs in the target population. This target profile distribution should be chosen according to the substantive interests of each study, similar to the choice of a target population of respondents in traditional survey sampling. The choice of distribution may be based on (1) real-world data, such as the characteristics and policy positions of actual politicians, or (2) a counterfactual distribution of theoretical interest. For each of the two scenarios, we provide empirical applications. We show that the difference between the uAMCE and pAMCE is large when the target profile distribution differs from uniform and when there exists interaction between the main attribute of interest and other attributes.
We propose two new strategies to estimate the pAMCE. The first approach, which we call design-based confirmatory analysis, incorporates the target profile distribution in the design stage (Section 4.1). We introduce three experimental designs that differ in terms of data requirements and necessary assumptions. In the most natural design, which we term joint population randomization, we propose randomizing conjoint profiles according to their target profile distribution rather than the uniform. We then use a nonparametric estimator of the pAMCE, which can be computed using a weighted linear regression. This is a straightforward generalization of a widely used regression estimator (Hainmueller et al., Reference Hainmueller, Hopkins and Yamamoto2014).
Our second approach, model-based exploratory analysis, takes into account the target profile distribution at the analysis stage, after randomizing profiles and collecting data (Section 4.2). This approach is useful in estimating the pAMCE when researchers have to randomize profiles based on distributions different from the target profile distribution, such as the uniform. We propose fitting a flexible two-way interaction model and estimating the pAMCE as a weighted average of coefficients. Although this approach yields less precise estimates than the design-based confirmatory analysis, we discuss how to use regularization methods to partially recoup the loss of statistical efficiency (Egami and Imai, Reference Egami and Imai2019).
One potential challenge of incorporating the target profile distribution is that the joint distribution of all attributes is difficult to obtain in some applications. For example, in a conjoint experiment of immigrant profiles, it may not be feasible to obtain the joint distribution of the (potentially many) attributes of immigrants that researchers wish to study. Recognizing this practical data constraint, we propose the marginal population randomization design, which only requires the knowledge of each factor’s marginal distribution. Here, researchers randomize each factor independently with its marginal distribution. While this design requires a stronger assumption of no three-way or higher-order interactions, we provide a method to test its validity empirically. We also discuss how researchers can combine marginal distributions and partial joint distributions among several factors to relax this assumption.
The concern for unrealistic profiles is not new. In fact, researchers often remove a set of unusual profile combinations (e.g., doctors without college degree). Unfortunately, avoiding extreme cases is not sufficient for estimating the pAMCE. While some have begun to use unequal probabilities when randomizing profiles to partially address this concern (e.g., Hainmueller et al., Reference Hainmueller, Hangartner and Yamamoto2015; Huff and Kertzer, Reference Huff and Kertzer2018; Leeper and Robison, Reference Leeper and Robison2018),Footnote 1 an overwhelming majority of researchers still use the uniform distribution without theoretically motivating it.Footnote 2 The substantive implication of this choice is that the resulting estimates of the AMCE are externally valid only when there is no interaction between attributes or when the uniform is the theoretically relevant profile distribution. Even though scholars have clearly discussed the importance of distributions used to randomize profiles (Hainmueller et al., Reference Hainmueller, Hopkins and Yamamoto2014),Footnote 3 there currently exists no systematic way to incorporate the target profile distribution into the estimation of the AMCE. The proposed methodology directly addresses this problem by developing new experimental designs and estimation strategies. We note that our focus is on the external validity of conjoint profiles, and is distinct from another important issue of representativeness of respondents in survey experiments (see, e.g., Mutz, Reference Mutz2011; Mullinix et al., Reference Mullinix, Leeper, Druckman and Freese2015; Coppock, Leeper, and Mullinix, Reference Coppock, Leeper and Mullinix2018; Miratrix et al., Reference Miratrix, Sekhon, Theodoridis and Campos2018).
We illustrate the proposed methodology using two empirical applications. First, we reanalyze a conjoint experiment of political candidates by Ono and Burden (Reference Ono and Burden2019). The primary goal of the study is to estimate the effect of a candidate’s gender on voter choice. The original study estimates the uAMCE of being female and finds that women candidates face discrimination in presidential but not in congressional elections. Specifying the target profile distribution to be the 115th U.S. Congress, we estimate the pAMCEs separately for Republican and Democratic legislators. We show that the null effect of gender found in the original analysis for Congressional candidates is due to the large number of unrealistic profiles produced by the uniform distribution. Once we average profiles according to their real-world distributions, we recover a different result: women face a disadvantage when they run for Congress as Republicans but have an advantage when they run as Democrats. We also demonstrate that the uAMCE and pAMCE are similar for Presidential candidates because there exists little interaction between the main attribute of interest and other attributes within this subgroup.
As is the case for our first application, in many conjoint analyses, there exist natural target profile distributions, for which we can collect relevant data. In some cases, however, it might be impractical to gather corresponding real-world distributions (e.g., conjoint analysis of refugee profiles in Bansak, Hainmueller, and Hangartner, Reference Bansak, Hainmueller and Hangartner2016). Alternatively, researchers may be interested in counterfactual profiles of theoretical interest, which may be rare or even absent in the real world. For example, Ballard-Rosa et al. (Reference Ballard-Rosa, Martin and Scheve2017) examines a variety of hypothetical tax policy proposals that are infeasible in the real world politics, but are nonetheless essential in testing the authors’ theoretical argument. Importantly, even in these scenarios, the AMCE estimates do depend on the choice of profile distribution. Thus, it is essential to use the proposed pAMCE framework to systematically investigate the sensitivity of the AMCE estimates to alternative theoretically relevant profile distributions.
Our second application, which is based on Peterson (Reference Peterson2017), considers precisely those research settings where no natural target population exists or counterfactual profiles are of theoretical interest. Peterson (Reference Peterson2017) examines how the amount of information about candidates alters the importance of copartisanship. By randomizing how much information voters receive, the author finds that the copartisan effect is weaker when they are shown additional information on policy positions and candidate attributes. We revisit this finding by applying the proposed methodology. We build three theoretically relevant counterfactual distributions that simulate high, medium, and low-information environments. We then show that the reduction in the effect of copartisanship is driven by the outsized influence of candidates’ positions on abortion and deficit spending. While the original findings are based on a specific information environment, the proposed pAMCE framework enables the systematic investigation of their robustness.
2 Motivating Empirical Applications
Before presenting the proposed methodology, we describe a conjoint analysis that will motivate and illustrate the methodology proposed in this paper. We provide two empirical applications. The first application (Ono and Burden, Reference Ono and Burden2019) is a common type of conjoint analysis based on profiles of politicians, which we use to demonstrate how to incorporate a real-world distribution of politicians’ characteristics. In the second application (Peterson, Reference Peterson2017), we illustrate the importance of considering alternative profile distributions even in settings where no natural real-world distribution exists. We show how to systematically examine counterfactual profile distributions motivated by theoretical considerations.
2.1 The Effect of Candidate’s Gender on Voter Choice
Scholars have long been interested in the conditions under which female candidates face obstacles to being elected (McDermott, Reference McDermott1997). A primary focus of the literature has been on whether a bias against female candidate is the result of taste-based or statistical discrimination (see, e.g., Arrow, Reference Arrow1998). While the taste-based discrimination argument implies that voters dislike the idea of having female candidates in office per se, the statistical discrimination hypothesis contends that voters, rightly or wrongly, associate female politicians with certain political backgrounds and policy preferences, and this association in turn shapes their vote choice. Under the statistical discrimination hypothesis, the provision of sufficient information about politicians beyond their gender should eliminate the bias against female politicians. If, on the other hand, voters are engaging in taste-based discrimination, they will disfavor female candidates even when other attributes are known.
In a recent study, Ono and Burden (Reference Ono and Burden2019) use a conjoint analysis to study the effects of candidate’s gender on vote choice. The authors test the aforementioned hypotheses by varying the gender of candidates and other factors such as partisanship. As in a typical conjoint analysis, respondents were asked to choose one of the two hypothetical political candidates, each of whom has the following factors: three demographic characteristics (age, race, gender), six political background (family life, years in office, area of expertise, partisanship, favorability rating, character trait), and four policy preferences (positions on abortion, immigration, national security and deficit reduction). In addition to attributes of the candidates, the original authors also randomly vary the office being sought at the candidate pair level; whether they run for President or Congress.
In Table 1, we summarize the levels of each factor used in this study. Each of 1,583 respondents evaluates 10 pairs of candidate profiles, indicating which one of the two profiles they prefer. Following the conventional conjoint analysis, all factors are independently randomized according to the uniform distribution so that each profile is equally likely. Under this uniform randomization design, the authors estimate the AMCE of candidate being female relative to male, marginalizing all other attributes, to be
 $-1.25$
percentage points (95% CI =
 $[-2.36, -0.19]$
). This result implies that that female candidates suffer from a small disadvantage. The authors suggest that, because the conjoint analysis also presents other relevant information about politicians, this negative estimate represents evidence of taste-based rather than statistical discrimination. Importantly, Ono and Burden (Reference Ono and Burden2019) finds that the overall effect is driven by presidential candidates and there is little gender effect on congressional candidates. In particular, the estimated AMCE of being female is only
 $-0.09$
percentage points (
 $[-1.71, 1.48]$
) for congressional candidates. On the other hand, the authors find a large negative effect of
 $-2.42$
percentage points (
 $[-3.96, -0.88]$
) for presidential candidates. These findings led to the conclusion that discrimination against female candidates exists mostly in presidential elections rather than congressional elections.
Factors and levels used in Ono and Burden (Reference Ono and Burden2019). All factors are independently and uniformly randomized with levels in each factor shown with equal probability.

2.2 The Effect of Information Environment on Partisan Voting
The study of copartisanship in the United States has long shown that voters demonstrate a strong preference for candidates of their own party (Campbell et al., Reference Campbell, Converse, Miller and Stokes1960). Although the importance of copartisanship is widely accepted, researchers disagree about its underlying mechanisms. Some argue that voters’ support for parties is deeply rooted (Bartels, Reference Bartels2000). As a result, voters may use motivated reasoning when making decisions about which candidates to support, assessing information as favorable as possible given their partisan attachments (Bolsen, Druckman, and Cook, Reference Bolsen, Druckman and Cook2014; Druckman, Reference Druckman2014). Others argue that partisan cues mainly serve as substitutes for relevant information such as political background and policy preferences (Lau and Redlawsk, Reference Lau and Redlawsk2001; Bullock, Reference Bullock2011).
To adjudicate between these two theories, Peterson (Reference Peterson2017) uses a conjoint analysis to estimate the extent to which the amount of information presented to voters conditions the importance of partisan cues. Respondents are asked to choose one of the two hypothetical candidates that vary along ten dimensions such as age, gender, race, and policy positions. These factors and their levels are given in Table 2.
Factors used in Peterson (Reference Peterson2017). Each respondent completed three choice tasks with each task containing two profiles. The full sample includes 1,059 respondents and 6,354 profiles. The design randomizes the number of factors shown to the respondent, which factors are shown, and the levels of each selected factor. The candidate’s partisanship is always shown.

A key feature of this study is that the randomization occurs in three steps. First, the author randomly selects the number of attributes to be presented to a respondent. The primary factor of interest, candidate party, is always shown, but the remaining nine factors are randomized to be shown or not shown. In particular, the number of additional factors is randomized to be 1, 3, 5, 7, or 9. In the second step, he then randomly chooses the selected number of factors from the remaining nine attributes. Finally, as in a typical conjoint analysis, levels are randomly chosen within each selected factor.
Under this design, Peterson (Reference Peterson2017) examines how the effect of copartisanship changes with the amount of information about candidates respondents possess. The original analysis finds that showing more information greatly reduces the effect of copartisanship, suggesting that partisanship partially serves as substitutes for other relevant information. The author also extends this analysis by investigating which factor plays an outsized role in reducing the effect of copartisanship. This analysis shows that the information about a candidate’s position on abortion policy and deficit spending diminish the effect of copartisanship more than demographic features such as race and gender.
3 Causal Quantities of Interest
In this section, we consider causal quantities of interest in conjoint analysis. We first show that most existing conjoint analyses implicitly estimate the uniform average marginal component effect (uAMCE), which gives equal weights to all conjoint profiles. Unfortunately, the profile distribution in the real world is likely to be far from uniform. Therefore, we consider an alternative quantity, the population average marginal component effect (pAMCE) that directly incorporates the knowledge about the target profile distribution. We discuss the conditions under which the pAMCE differs from the uAMCE.
3.1 The Setup
Following the setup of Hainmueller et al. (Reference Hainmueller, Hopkins and Yamamoto2014), consider a conjoint analysis with a total of N respondents. In the experiment, each respondent, indexed by
 $i \in \{1, \ldots , N\}$
, completes K choice (or rating) tasks, and for a given task, a respondent chooses one of J profiles (or rate each of them). A conjoint profile is composed of L attributes represented by the corresponding L factors, where each factor
 $\ell $
has a total of
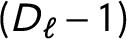
 $D_\ell $
levels. For example, the conjoint analysis of Ono and Burden (Reference Ono and Burden2019) has
 $N = 1,583$
respondents who are assigned to
 $K = 10$
tasks of choosing one of
 $J = 2$
candidates. Candidates differ in
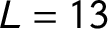 $L = 13$
factors and the levels of each factor are given in Table 1; for example,
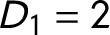 $D_1 = 2$
and
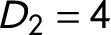 $D_2 = 4$
where the first and second factors represent gender and race, respectively.
We denote the jth profile presented to respondent i in the kth task by a profile vector
 ${\mathbf {T}}_{ijk}$
of length L. The
 $\ell $
th element of this vector represents the
 $\ell $
th factor of the profile, which takes one of
 $D_\ell $
levels, that is,
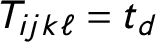
 $T_{ijk\ell } \in \{0, 1, \ldots , D_\ell -1\}$
. For example, if for the first respondent, the first attribute of the first profile in the first task is male, then we have
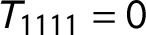 $T_{1111} = 0$
.
Using the potential outcomes framework (Neyman, Reference Neyman1923; Rubin, Reference Rubin1974), let
 $Y_{ijk} ({\mathbf {t}})$
represent the potential outcome for respondent i when the stacked vector of J profiles
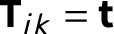 ${\mathbf {T}}_{ik} = {\mathbf {t}}$
are presented to respondent i as the kth task. When the outcome is choice-based, only one of J potential outcomes for task k by respondent i takes the value of one whereas the other
 $J-1$
potential outcomes are equal to zero. In contrast, when the outcome is rating-based, each outcome
 $Y_{ijk}$
corresponds to the rating of profile j given by respondent i in the kth task.
This notation is based on the stable unit treatment value assumption (Cox, Reference Cox1958; Rubin, Reference Rubin1990). In particular, we assume no carryover effect, implying that the outcome of a task is not affected by the same respondent’s previous tasks (Hainmueller et al., Reference Hainmueller, Hopkins and Yamamoto2014). In addition, it is often assumed that the position of profiles does not affect the outcome (Hainmueller et al., Reference Hainmueller, Hopkins and Yamamoto2014). Under these assumptions, the potential outcome
 $Y_{ijk} ({\mathbf {t}})$
can be simplified as
 $Y_{ik} ({\mathbf {t}})$
because respondents would reveal the same outcomes regardless of positions of profiles j.
Under this framework, we review the definition of the AMCE originally proposed by Hainmueller et al. (Reference Hainmueller, Hopkins and Yamamoto2014). The AMCE represents the average causal effect of changing levels within each factor while averaging over other factors. For example, we might be interested in estimating the effect of a candidate’s gender, averaging over the distribution of the other candidate characteristics such as age, ideology, and policy positions.
Definition 1 Average Marginal Component Effect (Hainmueller et al., Reference Hainmueller, Hopkins and Yamamoto2014)
The average causal effect of changing factor
 $\ell $
from level
 $t_0$
to
 $t_1$
for a given profile while averaging over the other factors is given by,
 $$ \begin{align*}\tau_{\ell} (t_1, t_0; \mathrm{Pr}({\mathbf{t}}_{ijk,-\ell}, {\mathbf{t}}_{i,-j,k})) = \sum_{({\mathbf{t}}_{ijk,-\ell}, {\mathbf{t}}_{i,-j,k})\in \mathcal{T}}& {\mathbb{E}} \left[Y_{ik} (t_1, {\mathbf{t}}_{ijk,-\ell}, {\mathbf{t}}_{i,-j,k}) - Y_{ik} (t_0, {\mathbf{t}}_{ijk,-\ell}, {\mathbf{t}}_{i,-j,k})\right] \nonumber\\& \times \mathrm{Pr}({\mathbf{t}}_{ijk,-\ell}, {\mathbf{t}}_{i,-j,k}), \end{align*} $$
where
 ${\mathbf {t}}_{ijk,-\ell }$
represents an
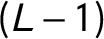 $(L-1)$
dimensional vector representing the levels of all factors except for factor
 $\ell $
of the jth profile in the kth task completed by respondent i,
 ${\mathbf {t}}_{i,-j,k}$
denotes the levels of all factors for the remaining profiles other than profile j, and
 $\mathcal {T}$
is the support of
 $\mathrm{Pr} ({\mathbf {t}}_{ijk,-\ell }, {\mathbf {t}}_{i,-j,k})$
. Finally, the expectation is over a random sample of the respondents and task positions.
At its core, the AMCE averages not only across respondents but also across conjoint profiles, such as political candidates. We show below that this marginalizing distribution over profiles plays an essential role in conjoint analysis.
3.2 The Uniform Average Marginal Component Effect
The definition of the AMCE clearly shows that the use of different profile distributions
 $\mathrm{Pr} ({\mathbf {t}}_{ijk,-\ell }, {\mathbf {t}}_{i,-j,k})$
can lead to substantively different conclusions (Hainmueller et al., Reference Hainmueller, Hopkins and Yamamoto2014). Nevertheless, in practice, little attention is paid to the choice of this profile distribution. In particular, most existing conjoint analyses use the uniform distribution, in which each factor is independently and uniformly randomized, making each conjoint profile equally likely. We call the resulting quantity as the uniform average marginal component effect (the uAMCE).
Definition 2 Uniform Average Marginal Component Effect
The uniform average causal effect of changing factor
 $\ell $
from level
 $t_0$
to
 $t_1$
for a given profile while marginalizing the other factors is given by,
 $$ \begin{align*} \tau^{\texttt{U}}_{\ell} (t_1, t_0) & = \tau_{\ell} (t_1, t_0; {{\mathrm{Pr}}^{\texttt{U}}}({\mathbf{t}}_{ijk,-\ell}, {\mathbf{t}}_{i,-j,k})) \notag\\ & = \sum_{({\mathbf{t}}_{ijk,-\ell}, {\mathbf{t}}_{i,-j,k})\in\mathcal{T}^{\texttt U}} {\mathbb{E}} \bigg[Y_{ik} (t_1, {\mathbf{t}}_{ijk,-\ell}, {\mathbf{t}}_{i,-j,k}) - Y_{ik} (t_0, {\mathbf{t}}_{ijk,-\ell}, {\mathbf{t}}_{i,-j,k})\bigg] {{\mathrm{Pr}}^{\texttt{U}}}({\mathbf{t}}_{ijk,-\ell}, {\mathbf{t}}_{i,-j,k}), \end{align*} $$
where
 ${\mathrm{Pr}^{\texttt {U}}}(\cdot )$
denotes the uniform distribution and
 $\mathcal {T}^{\texttt {U}}$
is the support of
 ${\mathrm{Pr}^{\texttt {U}}}({\mathbf {T}}_{ijk,-\ell }, {\mathbf {T}}_{i,-j,k}).$
The central problem of the uAMCE is that it equally weights all profiles regardless of how realistic they are. Because any AMCE represents a weighted average of causal effects across all profiles used in the experiment, the estimates partially based on unrealistic profiles may yield misleading findings. The problem is not entirely new. In fact, users of conjoint experiments are often concerned about unrealistic profiles and remove highly unlikely profiles (e.g., Hainmueller et al., Reference Hainmueller, Hopkins and Yamamoto2014). Although this restricted randomization can eliminate extreme cases (e.g., doctors without college degree), the overall distribution of profiles may still be far away from a target profile distribution. Given that one of the core advantages of conjoint experiments is to mimic real-world decision making process (Hainmueller et al., Reference Hainmueller, Hangartner and Yamamoto2015), it is critical to define causal quantity of interest that reflects a target population.
3.3 The Population Average Marginal Component Effect
To improve the external validity of conjoint analysis, we consider the population AMCE (pAMCE), which marginalizes factors over the target population distribution of profiles rather than the uniform distribution. This target population of profiles depends on the substantive context of each application, similarly to survey research where a target population of respondents must be specified. This can be obtained from a real world data set on the attributes of actual politicians as in the case of Ono and Burden (Reference Ono and Burden2019) study (our first application). Alternatively, it can be a counterfactual distribution of theoretical interest that, for example, represents a different information environment for voters as in the Peterson (Reference Peterson2017) study (our second application). Formally, we define the pAMCE as follows.
Definition 3 Population Average Marginal Component Effect
The population average causal effect of changing factor
 $\ell $
from level
 $t_0$
to
 $t_1$
for a given profile while marginalizing the other factors is given by,
 $$ \begin{align*} \tau^{\ast}_{\ell} (t_1, t_0) & = \tau_{\ell} (t_1, t_0; {{\mathrm{Pr}}^{\ast}}({\mathbf{t}}_{ijk,-\ell}, {\mathbf{t}}_{i,-j,k})) \notag\\ & = \sum_{({\mathbf{t}}_{ijk,-\ell}, {\mathbf{t}}_{i,-j,k})\in\mathcal{T}^\ast} {\mathbb{E}} \bigg[Y_{ik} (t_1, {\mathbf{t}}_{ijk,-\ell}, {\mathbf{t}}_{i,-j,k}) - Y_{ik} (t_0, {\mathbf{t}}_{ijk,-\ell}, {\mathbf{t}}_{i,-j,k})\bigg] {{\mathrm{Pr}}^{\ast}}({\mathbf{t}}_{ijk,-\ell}, {\mathbf{t}}_{i,-j,k}), \end{align*} $$
where
 ${\mathrm{Pr}^{\ast }}(\cdot )$
denotes the target population distribution and
 $\mathcal {T}^\ast $
is the support of
 ${\mathrm{Pr}^{\ast }}({\mathbf {T}}_{ijk,-\ell }, {\mathbf {T}}_{i,-j,k}).$
The distinction between the uAMCE and the pAMCE is simple and yet important. While the uAMCE marginalizes other factors over the uniform distribution, the pAMCE averages them over the target population distribution of profiles. Therefore, the pAMCE appropriately weights profiles according to the frequency with which they occur in the target distribution. Formally, we can characterize the difference between these two quantities as follows,

This difference between the uAMCE and the pAMCE has two components. The first term quantifies the average causal interaction effect between the factor of interest and all the other factors including those of other profiles (Egami and Imai, Reference Egami and Imai2019). For example, the effect of being female relative to male might be larger for white candidates than black candidates. The second term represents the difference between the uniform and the target profile distributions. Therefore, the difference between the uAMCE and the pAMCE is large when the causal effect of factor
 $\ell $
interacts with other factors and when the target profile distribution is far away from the uniform distribution.
3.4 Empirical Illustrations
Using the two studies introduced in Section 2, we empirically illustrate the importance of target profile distributions. For the first application, there exists a natural real-world profile distribution that can be used to estimate the pAMCE. Using data on the characteristics of actual politicians, we construct a distribution of profiles that more accurately reflects what real-world politicians look like. We show that this distribution is strikingly different from uniform. In our second application, we demonstrate how the pAMCE can be useful even when there exists no natural real-world profile distribution for which data can be collected. Specifically, we analyze theoretically relevant counterfactual distributions and systematically investigate how empirical findings change according to the choice of profile distributions.
3.4.1 The Use of Real-world Distributions
As in the vast majority of conjoint analyses, Ono and Burden (Reference Ono and Burden2019) randomize factors independently by choosing each level with equal probability. This produces a uniform distribution in which all attribute combinations are equally likely. While the uniform distribution is commonly used in applications of the conjoint analysis, the corresponding real-world distribution of attributes are rarely uniform.
Indeed, the uniform randomization produces highly unusual profiles. For example, two-thirds of Republican candidate profiles will have abortion positions of “neutral” or “pro-choice.” The difference between this distribution and the one that of actual Republican politicians is stark. Using a legislator scorecard produced by the National Right to Life Council, a conservative nonprofit that advocates for pro-life policies, only 1 of the 296 Republican legislators (0.33%) could be classified as pro-choice and only 2 (0.67%) as neutral. A similar pattern emerges for Democrats. Two-thirds of presented candidate profiles take a value of neutral or pro-life, yet similarly low percentages of Democratic politicians hold those positions.
The case of abortion position may be especially dramatic, but the real-world distributions of nearly all of the attributes presented in Table 1 differ markedly from the uniform distribution. As a target profile distribution, we use data of actual legislators in the 115th Congress and compute the real-world joint distribution of 12 of the 13 attributes examined in Ono and Burden (Reference Ono and Burden2019). We do not produce the distribution of the Trait attribute due to its highly subjective quality and thus keep the uniform distribution for it. Because party is strongly correlated with nearly all remaining attributes, we consider the target profile distributions of Republican and Democrat politicians separately. Supplemental Appendix B includes details about the construction of this joint distribution.
Figure 2 shows that the marginal distributions of actual politicians’ characteristics (gray bars for Democrats, shaded bars for Republicans) differ substantially from the uniform distribution (white bars). In the case of the gender, which is the focus of the original analysis, neither the Republican nor Democratic distributions resemble the uniform: only 10.2% of Republicans and 32.2% of Democratic legislators are female. We find a similar pattern for the remaining attributes. The difference is most pronounced for the attributes that are likely to be salient to subjects, such as race and major policy positions. This suggests that the uAMCE may significantly differ from the pAMCE.
Experimental and target profile distributions of factors in Ono and Burden (Reference Ono and Burden2019). We compare the uniform distribution used in the original experiment and two real-world distributions of politicians’ characteristics and policy positions; Republican and Democrat legislators.

Finally, we note that the original experiment considers hypothetical political candidates. Thus, the ideal target profile distribution would be the real-world distribution of the attributes for all candidates, not only for elected legislators. Unfortunately, because the original conjoint experiment was not designed with fidelity to the real-world distribution in mind, there are many factors for which it is not possible to gather corresponding real-world distributions using data from all candidates. As a result, we use politicians in the 115th Congress as our main target profile distribution, for whom we were able to collect real-world distributions for most factors (as visualized in Figure 2).
In Section 5.1, we consider the robustness of the pAMCE estimates by replacing profile distributions of race, gender, and experience, based on publicly available candidate-level datasets. We also consider different theoretically relevant profile distributions on policy dimensions. Even when it is infeasible to collect the real-world distribution of all factors for all candidates, it is critical to take into account more realistic profile distributions and improve the external validity of conjoint analysis.
3.4.2 The Use of Counterfactual Distributions
Peterson (Reference Peterson2017) is primarily interested in how the effect of copartisanship changes according to the amount of other relevant information about candidates. Therefore, our analysis focuses on the first two steps of the original randomization—randomizing the number of factors to show and then randomly selecting which factor to present given the selected number of factors to be shown. Because each randomization uses the uniform distribution, every factor is equally likely to be shown. In particular, the marginal probability of each factor being shown is a little above
 $50\%$
(see Figure 3). If researchers use the widely used linear regression estimator (Hainmueller et al., Reference Hainmueller, Hopkins and Yamamoto2014), the resulting estimate of the AMCE represents the causal effect of copartisanship while averaging over low, medium, and high information environments.
Original and counterfactual distributions of factors in the information experiment (Peterson, Reference Peterson2017). We compare the distribution used in the experiment and two counterfactual distributions of information environment.

Rather than averaging over different information environments that have distinct substantive meanings, we may be interested in investigating how the pAMCE depends on different information environments. In particular, we consider two counterfactual distributions: a low information environment in which subjects observe each factor (other than copartisanship) only
 $20$
% of the time, and a high information environment in which each factor is observed
 $80$
% of the time. Figure 3 compares these low- and high-information counterfactual distributions to the one used in the original analysis. As the figure demonstrates, these low and high-information environments differ substantially from the medium-information environment produced by the original design. This suggests that the AMCE estimate based on the conventional regression estimator may differ from the pAMCE s based on the two counterfactual distributions representing specific information environments of theoretical interest. The framework of the pAMCE is essential to systematically assess how the AMCE estimates might change under different profile distributions.
4 The Proposed Methodology
In this section, we propose two new approaches to estimate the pAMCE. First, we show how to conduct a design-based confirmatory analysis, in which we incorporate target profile distributions when designing experiments. In contrast, the second approach—a model-based exploratory analysis—takes into account target distributions after randomizing profiles. This latter approach is useful in estimating the pAMCE from existing conjoint experiments that have randomized profiles with distributions different from the target population.
4.1 Design-Based Confirmatory Analysis
The proposed design-based confirmatory analysis consists of new experimental designs and their associated estimators of the pAMCE. We describe each in turn.
4.1.1 Experimental Designs
We introduce three experimental designs; the joint population randomization design, the marginal population randomization design, and the mixed randomization design. While all experimental designs allow for the consistent estimation of the pAMCE, they differ in terms of data requirements and assumptions.
We begin with the joint population randomization design. In this design, researchers randomize profiles according to their target profile distribution.
Definition 4 Joint Population Randomization Design
 $$ \begin{align} && {{\mathrm{Pr}}^{\texttt{R}}}({\mathbf{T}}_{ik} = {\mathbf{t}}) = {{\mathrm{Pr}}^{\ast}}({\mathbf{T}}_{ik} = {\mathbf{t}})\ \ \ \ \mathrm{for\ all }\ {\mathbf{t}} \in \mathrm{\ support\ of}\ {\mathbf{T}}_{ik}\ \ \mathrm{and\ for\ all\ } i\ \mathrm{ and }\ k, \end{align} $$
where
 ${\mathrm{Pr}^{\texttt {R}}}(\cdot )$
denotes the distribution used for randomization and
 ${\mathrm{Pr}^{\ast }}(\cdot )$
represents the target profile distribution.
This design is simple and intuitive since it directly incorporates the target profile distribution into randomization. The main advantage is that the design allows for nonparametric estimation of the pAMCE using a weighted difference-in-means estimator described in the next section.
While the joint population randomization design enables nonparametric estimation, it requires the knowledge of the joint distribution of profile attributes. In practice, this requirement might be difficult to satisfy for many applications. An alternative design that relaxes this stringent data requirement is the marginal population randomization design. Under this design, researchers randomize each factor independently according to its marginal profile distribution of the target population.
Definition 5 Marginal Population Randomization Design
 $$ \begin{align} && {{\mathrm{Pr}}^{\texttt{R}}}(T_{ijk\ell} = t) = {{\mathrm{Pr}}^{\ast}}(T_{ijk\ell} = t) \ \ \ \ \mathrm{for\ all\ levels}\ t \ \ \mathrm{and\ for\ all\ }\ i, j, k, \ell. \end{align} $$
For example, we randomize three factors {Gender, Race, Education} independently with each marginal distribution,
 ${\mathrm{Pr}^{\ast }}(\texttt {Gender}), {\mathrm{Pr}^{\ast }}(\texttt {Race}),$
and
 ${\mathrm{Pr}^{\ast }}(\texttt {Education})$
, respectively, rather than using the joint distribution
 ${\mathrm{Pr}^{\ast }}(\texttt {Gender}, \texttt {Race}, \texttt {Education})$
.
The main advantage of this approach is that it only requires information about separate marginals of the target profile distribution. Gathering data on marginal distributions is likely to be easier in most contexts. In fact, some researchers have begun to incorporate marginal distributions of the target profile population in their research (see Leeper and Robison, Reference Leeper and Robison2018). Another significant benefit is that we can estimate the pAMCE using simple difference-in-means under this design. In practice, this means that researchers can estimate the pAMCE using a linear regression because factors are independent of each other.
The marginal population randomization design is not free of limitations. In particular, without further assumptions, this design estimates the approximate pAMCE where we only partially capture the target profile distribution. Nevertheless, compared to the uAMCE, this design already greatly improves the external validity of conjoint analysis. Indeed, a similar approximation strategy is often used in other contexts, including survey research, in which sampling weights are computed using population marginals, and causal inference with observational data, in which observed covariates are balanced only with respect to their marginal means.
What assumption is required for the consistent estimation of the pAMCE only with separate marginal distributions rather than the joint distribution of profile attributes? It turns out that we only need to assume the absence of three-way or higher order interactions among factors. Suppose that there are three factors Gender, Race, and Education, and they have two-way interactions; Gender
 $\,\times\,$
Race, Gender
 $\,\times\,$
Education, and Race
 $\,\times\, $
Education. In this case, a simple difference-in-means estimator is still consistent for the pAMCE so long as there exists no three-way or higher order interaction such as Gender
 $\,\times\, $
Race
 $\,\times\, $
Education. It is important to emphasize that the marginal population randomization design allows for the existence of any two-way interaction, which often captures the strongest interaction in many applications.
There are several ways to address concerns about the assumption of no three-way or higher-order interaction. First, researchers can extend this marginal population randomization design by incorporating the partial joint distributions. Suppose that the joint distribution
 ${\mathrm{Pr}^{\ast }}(\texttt {Race}, \texttt {Education})$
is available while all other factors are randomized independently according to their separate marginal distributions. In this case, we can consistently estimate the pAMCE of Gender via a weighted difference-in-means (see Section 4.1.2) even when there exists the three-way interaction Gender
 $\,\times\, $
Race
 $\,\times\, $
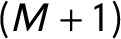
Education if the joint distribution of Race and Education is incorporated into randomization. In general, if we incorporate the joint distributions of M factors, the consistent estimation of the pAMCE is possible even if there exist
 $(M+1)$
-way interactions involving these factors. Finally, we can test the assumption of no three-way and higher-order interactions using the standard F-test (see Section 4.2.4).
As the final design, we introduce the mixed randomization design, which can yield more efficient estimates when researchers are interested in only a small number of factors (e.g., one or two) and view the remaining factors as background information they control for. For this design, we first separate L factors into two types
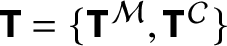 ${\mathbf {T}} = \{{{\mathbf {T}}^{\mathcal {M}}}, {{\mathbf {T}}^{\mathcal {C}}}\}$
; (1) main factors of interest
 ${{\mathbf {T}}^{\mathcal {M}}}$
, for which researchers wish to estimate the pAMCE, and (2) control factors
 $\;{{\mathbf {T}}^{\mathcal {C}}}$
, which are included as the background information. The distinction between the main and control factors is essential because there is a statistical tradeoff; as the number of the main factors increases, the estimation of the pAMCE becomes less precise. Under the mixed randomization design, we randomize the main factors of interest based on the uniform distribution and the control factors based on their target profile distribution.
Definition 6 Mixed Randomization Design
 $$ \begin{align} \mathrm{Main\ factors:} \ \ \ \ & {{\mathrm{Pr}}^{\texttt{R}}}(T_{ijk\ell} = t) = \frac{1}{D_{\ell}} \ \ \ \ \mathrm{for\ all\ levels}\ t\ \mathrm{in\ factor\ } \ell \in \mathcal{M} \ \ \mathrm{and\ for\ all }\ i, j, k\notag\\\mathrm{Control\ factors:} \ \ \ \ & {{\mathrm{Pr}}^{\texttt{R}}}({{\mathbf{T}}^{\mathcal{C}}}_{ik} = {\mathbf{t}}) = {{\mathrm{Pr}}^{\ast}}({{\mathbf{T}}^{\mathcal{C}}}_{ik} = {\mathbf{t}})\ \ \ \ \mathrm{for\ all\ } i\ \mathrm{ and }\ k. \end{align} $$
For example, as in the original study (Ono and Burden, Reference Ono and Burden2019), suppose researchers are primarily interested in estimating the pAMCEs of factor Gender and use the other 12 factors as control factors. Under the mixed design, we randomize Gender using uniform while randomizing the remaining factors based on their target profile distribution.
This design has two primary advantages. First, by prespecifying a small number of main factors at the design stage, researchers can increase the research transparency and credibility in the same way that preregistration does (Blair et al., Reference Blair, Cooper, Coppock and Humphreys2019). Second, under the mixed randomization design, we can often estimate the pAMCEs of the main factors more efficiently than under the two alternative designs. In fact, we show that when researchers have a single main factor, the mixed randomization design is optimal under the assumption of no cross-profile interaction effects (see Supplemental Appendix D.3). In contrast, when multiple factors are of interest, the comparison of statistical efficiency across the three designs gives an inconclusive answer (see Section 4.1.3 for the sample size formula).
4.1.2 The Weighted Difference-in-Means Estimator
We introduce a general weighted difference-in-estimator that is consistent for the pAMCE under all three experimental designs described above. We then show how this general estimator can be simplified under some designs.
Formally, the weighted difference-in-means estimator of the pAMCE can be written as follows (Hájek, Reference Hájek, V. P. and D. A.1971),
 $$ \begin{align} \widehat{\tau}^{\ast}_{\ell} (t_1, t_0) \ = \ \frac{\sum_{i=1}^N \sum_{j=1}^J \sum_{k=1}^K {\mathbf{1}}\{T_{ijk\ell} = t_1\} w_{ijk\ell} Y_{ijk}}{\sum_{i=1}^N\sum_{j=1}^J \sum_{k=1}^K {\mathbf{1}}\{T_{ijk\ell} = t_1\} w_{ijk\ell}} - \frac{\sum_{i=1}^N \sum_{j=1}^J \sum_{k=1}^K {\mathbf{1}}\{T_{ijk\ell} = t_0\} w_{ijk\ell} Y_{ijk}}{\sum_{i=1}^N \sum_{j=1}^J \sum_{k=1}^K {\mathbf{1}}\{T_{ijk\ell} = t_0\} w_{ijk\ell}}, \end{align} $$
where the weights are defined as,
 $$ \begin{align} w_{ijk\ell} & \ = \ \frac{1}{{{\mathrm{Pr}}^{\texttt{R}}}(T_{ijk\ell} \mid {\mathbf{T}}_{ijk,-\ell}, {\mathbf{T}}_{i,-j,k})} \times \frac{{{\mathrm{Pr}}^{\ast}}({\mathbf{T}}_{ijk,-\ell}, {\mathbf{T}}_{i,-j,k})}{{{\mathrm{Pr}}^{\texttt{R}}}({\mathbf{T}}_{ijk,-\ell}, {\mathbf{T}}_{i,-j,k})}. \end{align} $$
The weights equal the product of two terms. The first term represents the randomization distribution of
 $T_{ijk\ell }$
given all the other factors
 $\{{\mathbf {T}}_{ijk, -\ell }, {\mathbf {T}}_{i, -j, k}\}$
, whereas the second term is the ratio between the target profile distribution of
 $\{{\mathbf {T}}_{ijk, -\ell }, {\mathbf {T}}_{i, -j, k}\}$
and their randomization distribution. Therefore, the weights are greater for observations that are more prevalent in the target profile distribution than in the randomization distribution. We prove the consistency of this estimator in Supplemental Appendix D.1.
Under the joint population randomization design, the second term of the weights is equal to one and thus, weights are simplified as follows,
 $$ \begin{align*} w^{\texttt{Joint}}_{ijk\ell} & \ = \ \frac{1}{{{\mathrm{Pr}}^{\ast}}(T_{ijk\ell} \mid {\mathbf{T}}_{ijk,-\ell}, {\mathbf{T}}_{i,-j,k})}. \end{align*} $$
Under the marginal population randomization design, both the first and second terms are canceled out and hence, weights are equal to one for all observations. Therefore, simple difference-in-means is consistent for the pAMCE under the assumption of no three-way or higher-order interaction.
Result 1 (Estimation under Marginal Population Randomization Design)
Under the assumption of no three-way or higher-order interaction, the following simple difference-in-means estimator is consistent for the pAMCE after randomizing profiles according to the marginal population randomization design (Equation (3)).
 $$ \begin{align} \frac{\sum_{i=1}^N \sum_{j=1}^J \sum_{k=1}^K {\mathbf{1}}\{T_{ijk\ell} = t_1\} Y_{ijk}}{\sum_{i=1}^N\sum_{j=1}^J \sum_{k=1}^K {\mathbf{1}}\{T_{ijk\ell} = t_1\} } - \frac{\sum_{i=1}^N \sum_{j=1}^J \sum_{k=1}^K {\mathbf{1}}\{T_{ijk\ell} = t_0\} Y_{ijk}}{\sum_{i=1}^N \sum_{j=1}^J \sum_{k=1}^K {\mathbf{1}}\{T_{ijk\ell} = t_0\} } \xrightarrow{p} \tau^{\ast}_{\ell} (t_1, t_0) \end{align} $$
This difference-in-means estimator can be computed by regressing
 $Y_{ijk}$
on an intercept and
 ${\mathbf {X}}_{ijk\ell }$
with regression where
 ${\mathbf {X}}_{ijk\ell }$
is a vector of
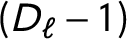 $(D_\ell - 1)$
dummy variables for the levels of
 $T_{ijk\ell }$
excluding the baseline level
 $t_0.$
Then, this difference-in-means estimator equals the estimated coefficient on the dummy variable for the level
 $t_1$
of factor
 $\ell $
(Greene, Reference Greene2011; Hainmueller et al., Reference Hainmueller, Hopkins and Yamamoto2014). We provide the proof in Supplemental Appendix D.2.
Finally, under the mixed randomization design, while weights do not have a simple expression, we can use the general weighted difference-in-means estimator given in Equation (5).
In practice, the proposed weighted difference-in-means estimator can be computed via a weighted linear regression model.Footnote 4 Since the weighted linear regression is used only to compute the nonparametric weighted difference-in-means estimator, no additional modeling assumption is imposed. This weighted regression estimator generalizes the regression estimator proposed in Hainmueller et al. (Reference Hainmueller, Hopkins and Yamamoto2014).
4.1.3 Effective Sample Size
When using the proposed weighting estimator, it is important to compute the effective sample size (ESS) to determine the statistical efficiency of each design prior to conducting an experiment. We use Monte Carlo simulation by randomizing profiles according to a specific design and then compute the ESS as follows (Kish, Reference Kish1965),
 $$ \begin{align} \mbox{ESS} \ = \ \frac{(\sum_{ijk} w_{ijk\ell})^2}{\sum_{ijk} w_{ijk\ell}^2}. \end{align} $$
When weights are equal to one for every observation, the ESS is equal to the total sample size
 $NJK$
. As weights diverge from one, the ESS becomes smaller. Using ESS, we can easily compute the following standard error multiplier between any two designs,
 $$ \begin{align} \sqrt{\frac{\mbox{ESS under one design}}{\mbox{ESS under another design}}}, \end{align} $$
which quantifies the expected ratio of standard error that would result under one design over that under another design. By computing the ESS and the standard error multiplier at the design stage, researchers can choose an experimental design that most efficiently estimates the pAMCEs. Note that since weights are different for each pAMCE, we must compute these statistics separately.
4.2 Model-Based Exploratory Analysis
When researchers incorporate the target profile distribution at the design stage, the above approach estimates the pAMCEs without bias. In some cases, however, we may wish to explore the pAMCEs of various factors using a conjoint experiment that has been fielded using profile distributions different from the target population. This is especially important when there exists no natural target profile distribution, leading to the use of the uniform randomization. Even in such cases, it is essential to examine the robustness of the AMCE estimates to alternative profile distributions that are of theoretical interest. To do so, we introduce a model-based estimator. While it requires additional modeling assumptions, this approach is useful for exploratory and sensitivity analyses. We also provide diagnostic tools for relevant modeling assumptions in Supplemental Appendix E.
4.2.1 Latent Utility Model
We begin by introducing a latent utility model that allows all two-way interactions. Specifically, we assume that the latent utility for each profile is a function of the main effect of each factor, the two-way interactions between all the factors, and the two-way interaction of the same factor between the two profiles within a given pair (e.g., the effect of age of one profile may depend on the age of the other profile). The modeling assumption is violated if three-way or higher order interaction effects exist. Although we believe that in most practical settings this assumption approximately holds, we offer a simple model specification test in Section 4.2.4.
Formally, our latent utility model of respondent i for profile j when compared against profile
 $j^\prime $
in the kth task is defined as follows,
 $$ \begin{align} \widetilde{Y}_{ijk}({\mathbf{T}}_{ijk}, {\mathbf{T}}_{ij^\prime k}) \ = & \ \ \widetilde\alpha + \sum_{\ell = 1}^L {\mathbf{X}}_{ijk\ell}^\top \widetilde{\beta}_\ell + \sum_{\ell = 1}^L \sum_{\ell^\prime \neq \ell} ({\mathbf{X}}_{ijk\ell} \times {\mathbf{X}}_{ijk\ell^\prime})^\top \widetilde{\gamma}_{\ell\ell^\prime} - \sum_{\ell = 1}^L {\mathbf{X}}_{ij^\prime k\ell}^\top \widetilde{\beta}_\ell \notag \\ & \ - \sum_{\ell = 1}^L \sum_{\ell^\prime \neq \ell} ({\mathbf{X}}_{ij^\prime k\ell} \times {\mathbf{X}}_{ij^\prime k\ell^\prime})^\top \widetilde{\gamma}_{\ell\ell^\prime} + \sum_{\ell = 1}^L ({\mathbf{X}}_{ij k\ell}\times {\mathbf{X}}_{ij^\prime k\ell})^\top \widetilde{\delta}_{\ell \ell} + \widetilde\epsilon_{ijk}, \end{align} $$
where
 ${\mathbf {X}}_{ijk\ell }$
is a vector of
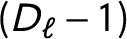 $(D_\ell - 1)$
dummy variables for the levels of
 $T_{ijk\ell }$
excluding the baseline level and
 $\,\times\, $
represents the cartesian product operator, for example,
 $({\mathbf {X}}_{ijk\ell } \times {\mathbf {X}}_{ijk\ell ^\prime })^\top \widetilde {\gamma }_{\ell \ell ^\prime } = \sum _{d=1}^{D_{\ell }-1} \sum _{d^\prime =1}^{D_{\ell ^\prime }-1} X_{ijk\ell d} X_{ijk\ell ^\prime d^\prime } \widetilde {\gamma }_{\ell d \ell ^\prime d^\prime }$
. The coefficients
 $\widetilde \beta _\ell $
denote the main effects of factor
 $\ell $
, while the coefficients
 $\widetilde \gamma _{\ell \ell ^\prime }$
indicate two-way interactions between the two factors
 $\ell $
and
 $\ell ^\prime $
. Finally, the coefficients
 $\widetilde \delta _{\ell \ell }$
represent two-way interactions between factor
 $\ell $
across the two profiles j and
 $j^\prime $
. Under the assumption of no profile-order effects, the effects of factors in profile j and those in profile
 $j^\prime $
are symmetric. This is why the effect of
 ${\mathbf {X}}_{ijk\ell }$
is
 $\widetilde \beta _{\ell }$
and that of
 ${\mathbf {X}}_{ij^\prime k\ell }$
is
 $-\widetilde \beta _{\ell }$
. Similarly, the effect of
 ${\mathbf {X}}_{ijk\ell } \times {\mathbf {X}}_{ijk\ell ^\prime }$
is
 $\widetilde \gamma _{\ell \ell ^\prime }$
while that of
 ${\mathbf {X}}_{ij^\prime k\ell } \times {\mathbf {X}}_{ij^\prime k\ell ^\prime }$
is
 $-\widetilde \gamma _{\ell \ell ^\prime }$
.
As in the conventional latent utility model, we do not directly observe the latent utility. Instead, we observe the choices made by respondents. Each respondent is assumed to choose profile j when its latent utility is higher than the latent utility of the other profile
 $j^\prime $
, that is,
 $$ \begin{align*} Y_{ik} ({\mathbf{T}}_{ijk}, {\mathbf{T}}_{ij^\prime k}) \ = \ \begin{cases} 1 & \ \mbox{if } \ \ \widetilde{Y}_{ijk}({\mathbf{T}}_{ijk}, {\mathbf{T}}_{ij^\prime k})> \widetilde{Y}_{ij^\prime k}({\mathbf{T}}_{ijk}, {\mathbf{T}}_{i j^\prime k}), \\ 0 & \ \mbox{otherwise.} \end{cases} \end{align*} $$
There are many ways to connect the latent utility model to the choice outcome model. For example, when we assume the error term follows the type I extreme value distribution, we obtain the well-known conditional logit model (McFadden, Reference McFadden and Zarembka1974). For the ease of interpretation, we rely on the following linear probability model (Egami and Imai, Reference Egami and Imai2019),
 $$ \begin{align} & \ \mathrm{Pr}(Y_{ik} = 1 \mid {\mathbf{T}}_{ijk}, {\mathbf{T}}_{ij^\prime k}) \notag \\ \ = & \ \bigg\{\widetilde{Y}_{ijk}({\mathbf{T}}_{ijk}, {\mathbf{T}}_{ij^\prime k}) - \widetilde{Y}_{ij^\prime k}({\mathbf{T}}_{ijk}, {\mathbf{T}}_{ij^\prime k})\bigg\} + 0.5 \notag \\ \ = & \ \alpha + \sum_{\ell = 1}^L ({\mathbf{X}}_{ijk\ell} - {\mathbf{X}}_{ij^\prime k\ell})^\top\beta_\ell + \sum_{\ell = 1}^L \sum_{\ell^\prime \neq \ell} ({\mathbf{X}}_{ijk\ell} \times {\mathbf{X}}_{ijk\ell^\prime}-{\mathbf{X}}_{ij^\prime k\ell} \times {\mathbf{X}}_{ij^\prime k\ell^\prime})^\top\gamma_{\ell\ell^\prime} + \sum_{\ell = 1}^L ({\mathbf{X}}_{ij k\ell}\times {\mathbf{X}}_{ij^\prime k\ell})^\top\delta_{\ell \ell} \end{align} $$
where the coefficients have direct connections to the latent utility model given in Equation (10), that is,
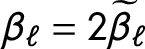 $\beta _\ell = 2\widetilde {\beta }_\ell $
,
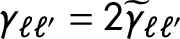 $\gamma _{\ell \ell ^\prime } = 2\widetilde {\gamma }_{\ell \ell ^\prime }$
and
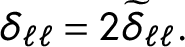 $\delta _{\ell \ell } = 2\widetilde {\delta }_{\ell \ell }.$
We estimate this linear probability model via ordinary least squares by regressing
 $Y_{ijk}$
on an intercept, the difference in the main terms for all the factors, the difference in the interaction terms for all the two-way interactions, and the interaction terms across profiles for all the factors.
This model does not impose the linearity assumption because each level of a given factor enters the model as a separate dummy variable. The model also allows for all two-way interactions between and across profiles. Therefore, the key assumption is the absence of three-way or higher order interactions, which can be easily relaxed at the expense of statistical efficiency.
4.2.2 Estimation of the Population AMCE
Using the above linear probability model, we can estimate the pAMCE as a weighted average of the estimated coefficients,
 $$ \begin{align} \widehat{\tau}^{\ast}_{\ell} (t_1, t_0) & \ = \ \widehat{\beta}_{\ell 1} + \sum_{\ell^\prime \neq \ell} \sum_{d = 1}^{D_{\ell^\prime}-1}\widehat{\gamma}_{\ell 1 \ell^\prime d} {{\mathrm{Pr}}^{\ast}}(T_{ijk\ell^\prime}=d) + \sum_{d = 1}^{D_{\ell}-1} \widehat{\delta}_{\ell 1 \ell d} {{\mathrm{Pr}}^{\ast}}(T_{ijk\ell}=d). \end{align} $$
where the marginal distributions are used as weights. Thus, under the two-way interactive linear probability model, we only need to collect the marginal distributions of the target profile population
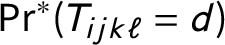 ${\mathrm{Pr}^{\ast }}(T_{ijk\ell }=d)$
. This greatly relaxes data requirements in practice.
As we saw earlier, when there is no interaction between or across factors, the uAMCE equals the pAMCE. That is, when
 $\widehat {\gamma }_{\ell 1 \ell ^\prime d} = \widehat {\delta }_{\ell 1 \ell d} = 0$
, we have
 $\widehat {\tau }^{\ast }_{\ell } (t_1, t_0) = \widehat {\tau }^{\texttt {U}}_{\ell } (t_1, t_0) = \widehat {\beta }_{\ell 1}.$
In addition, it is straightforward to estimate the difference between the uAMCE and the pAMCE,
 $$ \begin{align*} \widehat{\mbox{Diff}} \ \ = \ \ & \widehat{\tau}^{\ast}_{\ell} (t_1, t_0) - \widehat{\tau}^{\texttt{U}}_{\ell} (t_1, t_0) \\ = \ \ & \sum_{\ell^\prime \neq \ell} \sum_{d = 1}^{D_{\ell^\prime}-1}\widehat{\gamma}_{\ell 1 \ell^\prime d} \{{{\mathrm{Pr}}^{\ast}}(T_{ijk\ell^\prime}=d) - {{\mathrm{Pr}}^{\texttt{U}}}(T_{ijk\ell^\prime}=d)\}+ \sum_{d = 1}^{D_{\ell}-1} \widehat{\delta}_{\ell 1 \ell d} \{{{\mathrm{Pr}}^{\ast}}(T_{ijk\ell}=d) - {{\mathrm{Pr}}^{\texttt{U}}}(T_{ijk\ell}=d)\}. \end{align*} $$
Thus, as mentioned earlier, the difference is large when there exist significant interactions and when the target profile distribution is far away from the uniform distribution. Finally, we can decompose this difference as the sum of components due to different factors,
 $$ \begin{align} \widehat{\mbox{Diff}} \ = \ \sum_{\ell^\prime = 1}^L \widehat{\mbox{Diff}}_{\ell^\prime} \ = \ \sum_{\ell^\prime = 1}^L \sum_{d = 1}^{D_{\ell^\prime}-1}\widehat{\gamma}_{\ell 1 \ell^\prime d} \{{{\mathrm{Pr}}^{\ast}}(T_{ijk\ell^\prime}=d) - {{\mathrm{Pr}}^{\texttt{U}}}(T_{ijk\ell^\prime}=d)\}. \end{align} $$
Through this decomposition, researchers can unpack the origin of the difference between the uAMCE and the pAMCE.
4.2.3 Regularization
The main drawback of the model-based exploratory analysis is its large estimation uncertainty. When there are many factors and each factor has several levels, the model with all two-way interaction effects can produce large standard errors. We consider regularization as a way to partially recoup this loss of statistical efficiency relative to the design-based confirmatory analysis. For example, the conjoint analysis of Ono and Burden (Reference Ono and Burden2019) contains 13 factors with a total of 49 levels. This means that the estimated pAMCE will be the weighted average of a large number of interaction terms. In such cases, a regularized regression approach can be effective in reducing estimation uncertainty.
In particular, we follow Egami and Imai (Reference Egami and Imai2019) and collapse levels within factors using a regularized regression. For instance, even though Ono and Burden (Reference Ono and Burden2019) use six levels for factor Age (36, 44, 52, 60, 68, 76 years old), not all the differences between the six levels may be relevant. It may be, for example, that the effects for the first three levels are indistinguishable from each other and can be collapsed into fewer levels (e.g., 36/44/52, 60/68, 76 years old). We can use a regularized regression to identify such coarsening patterns. By reducing the number of levels, the proposed regularized regression can improve efficiency and estimate the pAMCE more precisely.
Specifically, we estimate the pAMCE by collapsing levels while avoiding regularization bias through cross fitting (Chernozhukov et al., Reference Chernozhukov2018). We begin by randomly splitting data into two parts, training and test data. Using the training data, we first collapse levels within factors via the generalized lasso (Tibshirani and Taylor, Reference Tibshirani and Taylor2011),

where we select tuning parameter
 $\lambda $
using cross validation. By weighting according to effect size, the adaptive weights help regularize smaller effects more and larger effects less.Footnote
5
Importantly, we do not shrink the coefficients
 $\beta _{\ell d}$
themselves and instead regularize their differences
 $|\beta _{\ell d} - \beta _{\ell ,d-1}|$
so that we can collapse unnecessary levels (Egami and Imai, Reference Egami and Imai2019). When levels are unordered, researchers can use an alternative penalty that regularizes all pairwise differences, that is,
 $\sum _{\ell = 1}^L \sum _{d=0}^{D_\ell -1}\sum _{d^\prime \neq d}|\beta _{\ell d} - \beta _{\ell ,d^\prime }|.$
Second, using the separate test data, we fit the proposed linear probability model with collapsed levels and then estimate the pAMCE based on the weighted average expression given in Equation (12). Because unnecessary levels are removed in the previous step, we can estimate the pAMCE more precisely. It is important that we collapse levels with the training data and estimate the pAMCE with the separate test data to remove bias due to regularization.
Finally, we flip the role of training and test data and repeat the two steps described above. We average the two estimates from each test data as the estimate of the pAMCE. For uncertainty estimates, we use the block bootstrap by sampling respondents with replacement. We implement the cross-fitting for each bootstrap replicate. Uncertainty estimates are calculated based on the empirical distribution of the estimated pAMCE over the bootstrap sample. In Supplemental Appendix F, we provide simulation studies to show how much the proposed regularization method can improve efficiency without inducing bias.
4.2.4 Assessing the Absence of Higher-Order Interaction
The model introduced above (Equation (11)) as well as the marginal population randomization design (Equation (3)) assumes the absence of three-way or higher order interaction. We can directly test the assumed absence of three-way interaction by conducting the standard F-test. Specifically, we incorporate three-way interactions between three factors
 $\ell , \ell ^\prime ,$
and
 $\ell ^{\prime \prime }$
by adding
 $({\mathbf {X}}_{ijk\ell } \times {\mathbf {X}}_{ijk\ell ^\prime } \times {\mathbf {X}}_{ijk\ell ^{\prime \prime }})^\top \zeta _{\ell \ell ^\prime \ell ^{\prime \prime }}$
to the two-way interactive model of Equation (11) where
 $\zeta _{\ell \ell ^\prime \ell ^{\prime \prime }}$
is a vector of coefficients for the three-way interactions. Then, we test the existence of this three-way interaction via F-test with the null hypothesis,
 $H_0: \zeta _{\ell \ell ^\prime \ell ^{\prime \prime }} = \mathbf {0}$
. When the statistical power of detecting three-way interaction effects is of concern, it is recommended to rely on the regularization approach described above.
4.3 Summary
Table 3 summarizes the methodologies introduced in this section in terms of required data and assumptions. Several points are worth emphasizing. First, if researchers expect the target profile distribution to differ from the uniform distribution and factors to interact with one another, we recommend that they use one of the proposed experimental designs. The design-based approach is considerably more efficient than the model-based approach.
Data requirements and assumptions of design-based and model-based approaches.

Second, the choice of experimental designs largely depends on the availability of data about the target profile distribution although the sample size calculation can be conducted to compare the statistical efficiency of these designs. Ideally, researchers have the joint distribution, and hence are able to use the joint population randomization design. If only the marginal distributions are available, the marginal population randomization can be used at the cost of making an additional assumption about the absence of third or higher-order interactions. If large higher-order interaction effects are expected, incorporating partial joint distributions can relax the assumption. In addition, the mixed-randomization design is available if researchers are interested in testing hypotheses about one or two factors while controlling for other factors.
Finally, even when there exists no natural target profile distribution for which data can be collected, it is important to conduct the model-based approach to explore the robustness of the AMCE estimates to the choice of profile distributions. We recommend researchers systematically examine different counterfactual profile distributions motivated by a theoretical consideration (see our second example based on Peterson, Reference Peterson2017 in Section 5.2).
5 Empirical Applications
We apply the proposed methodology to the empirical applications described in Section 2. For the first application, we find that two key conclusions regarding the effect of gender are due to the uniform distribution used in the original study. Estimating the pAMCE using the real-world profile distribution instead, we find that the effect of being a female candidate varies according to party and office they seek for. For the second application, we show how to systematically explore the pAMCE based on counterfactual distributions of theoretical interest.
5.1 The Effect of Candidate’s Gender on Voter Choice
In the first application, the primary quantity of interest is the AMCE of candidate’s gender on voter choice. Instead of the uniform distribution used in the original analysis, we estimate the pAMCE using the real-world distribution of elected politicians in the 115th Congress, as described in Section 3.4. In particular, we estimate this quantity separately using the distributions of Democratic and Republican politicians’ characteristics (see Figure 4).
Estimates of the pAMCEs of being female in Ono and Burden (Reference Ono and Burden2019). We estimate the pAMCE for Republican and Democrat politicians. Even though an estimate of uAMCE is close to zero for congressional candidates, the pAMCE for congressional candidates under the Democrat distribution is large and positive.

5.1.1 Design-Based Analysis
We begin by performing the design-based confirmatory analysis proposed in Section 4.1. Because in the original study each attribute is randomized according to the uniform distribution, we conduct a simulation study to assess the performance of the marginal population randomization and mixed randomization designs.Footnote 6 To do this, we first fit a linear regression model with all two-way interactions between the thirteen factors summarized in Table 1 and use this estimated model as the true data generating process. For the marginal population randomization design, we randomize each factor independently based on a marginal distribution of the target population. For the mixed randomization design, the primary factor of interest, that is, gender, is randomized according to the uniform distribution and the remaining factors are randomized using their target population distribution. We estimate the pAMCE via the simple difference-in-means under the marginal population design and the weighted difference-in-means under the mixed design. Standard errors are clustered by respondents. We repeat the same procedure 100 times and average over point estimates and standard errors.
The left plot in the top row of Figure 4 presents the results. First, we focus on the results based on the mixed randomization design. In contrast to the estimates of the uAMCE, we find that the pAMCE is estimated to be
 $-2.20$
percentage points (95% confidence interval
 $=[-3.30, -1.10]$
) when using the distribution of Republicans and
 $2.64$
percentage points (
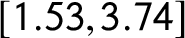 $[1.53, 3.74]$
) for Democrats. We obtain similar results under the marginal population randomization design although the standard errors are slightly larger. Recall that under the uniform distribution, the estimated uAMCE of gender on vote choice is small and negative. This demonstrates that the estimated AMCE critically depends on the target distribution of candidates’ attributes.
One key conclusion of the original study is that the negative effect of being female is found only for presidential candidates but not for congressional candidates. We revisit this finding by using the real-world politicians as the target profile distributions. In particular, we now conduct the design-based confirmatory analysis separately for congressional and presidential candidates. These results are presented in the top row of the second and third columns of Figure 4. Consistent with the original analysis, the estimated uAMCE of being female is
 $-0.09$
percentage points (
 $[-1.71, 1.48]$
) for congressional candidates and
 $-2.42$
percentage points (
 $[-3.96, -0.88]$
) for presidential candidates. For presidential candidates (the third plot in the top row), the pAMCE of being female is similar to the corresponding uAMCE for both Democratic and Republican distributions. Female presidential candidates face barriers compared to male candidates regardless of party. This result shows that the pAMCE and the uAMCE estimates can be similar even when the target profile distribution is far from uniform. This is because there exists little interaction between gender and other factors within this subgroup (see formal discussions in Section 3.3).
Interestingly, for congressional candidates (the second plot in the top row), the results of the uAMCE and pAMCEs diverge. The uAMCE implies that gender has little effect in congressional races. Yet a more realistic profile distribution suggests a more nuanced finding: women are disadvantaged when they run as Republicans and advantaged when they run as Democrats. Under the mixed randomization design, female Republican candidates are
 $1.98$
percentage points (
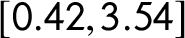 $[0.42, 3.54]$
) less likely to be chosen than their male counterparts, while female Democratic candidates are
 $5.69$
percentage points (
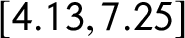 $[4.13, 7.25]$
) more likely to be chosen. The latter effect is large in substantive terms, equaling the effect of candidates’ experience in office and their position on deficit reduction.
5.1.2 Model-Based Analysis
Now, we illustrate the model-based exploratory analysis introduced in Section 4.2. This approach is useful especially when researchers are interested in exploring the pAMCE with conjoint experiments that have already been conducted using the uniform or any distributions different from the target distribution. First, we focus on estimating the pAMCE for both presidential and congressional candidates together as done in the original analysis. As explained in Section 4.2.3, we incorporate all two-way interactions among all the thirteen factors in Table 1 except for Office and then collapse levels within factors using the generalized lasso. Standard errors are calculated with 2,000 block bootstraps clustered by respondents.
As expected, the results are similar to those from the design-based analysis but with larger standard errors (see the left plot in the bottom row of Figure 4). The estimated pAMCE is
 $-2.87$
percentage points (
 $[-6.39, 0.63]$
) when using the distribution of Republican politicians and
 $2.84$
percentage points (
 $[-0.20, 5.87]$
) for Democratic politicians. We also repeat the same analysis for presidential and congressional candidates separately (the second and third plots in the second row). As in the design-based confirmatory analysis, we find that female congressional candidates have a disadvantage when they run as Republicans and have an advantage when they run as Democrats.
The standard errors are much larger than those in the design-based confirmatory analysis because the uniform distribution used in the experiment is markedly different from the target profile distribution. This postadjustment of the large differences reduces the effective sample size. Since the model-based analysis marginalizes all the two-way interactions, the efficiency loss is especially severe when the number of factors and levels within each factor are large, as in this example. Although regularization recoups some of this efficiency loss, the design-based analysis yields smaller standard errors in such high dimensional designs.
To investigate the sources of the difference between the uAMCE and pAMCE, we apply the decomposition formula given in Equation (13). For the sake of illustration, we focus on the difference between the estimated uAMCE and pAMCE for congressional Democratic candidates (the second plot in the bottom row). The first plot of Figure 5 shows the results of this decomposition, with each row representing the difference attributable to a single factor. We find, for example, that the difference due to factor Security Policy is about
 $1.6$
percentage points (
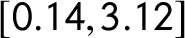 $[0.14, 3.12]$
), implying that the estimated AMCE increases by
 $1.6$
percentage points when we use the distribution of Democratic politicians for Security Policy rather than the uniform distribution. Importantly, less than 20% of the overall difference is attributable to Party, meaning that we cannot estimate the pAMCE just by considering the interaction between Gender and Party. The results show that the difference between the uAMCE (
 $-0.09$
percentage points) and pAMCE (
 $6.17$
percentage points) can be attributed to a combination of many factors even though the contribution of each factor is not necessarily precisely estimated. Even if the difference due to each factor is small, when aggregated across many factors, the overall difference between the uAMCE and the pAMCE can be substantial. This result underscores the need to collect relevant data for as many factors as possible when building the target distribution.
Decomposing the difference between the estimated uAMCE and pAMCE of being a female candidate. For congressional candidates, we compare the uAMCE and the pAMCE based on the Democrat distribution. The first plot decomposes the overall difference into each factor. The second and third factors investigates how effect heterogeneity and the difference in the profile distributions result in the difference in the uAMCE and the pAMCE.

To further unpack the source of this difference, we examine the conditional average marginal component effect (cAMCE). The cAMCE is the AMCE of the factor of interest—in this case, gender—conditional on the level of another factor.Footnote 7 A difference in the cAMCEs across the levels of the second factor implies an interaction with the factor of interest. For example, a difference in the cAMCEs of Gender conditional on Security Policy would indicate an interaction between Gender and Security Policy. We can use the cAMCE to determine whether each factor’s contribution to the difference between the uAMCE and the pAMCE (the first plot of Figure 5) is due to large interactions, large changes in distribution, or a combination of the two. If interactions between the primary factor of interest and secondary factors are responsible for most of the difference between the uAMCE and the pAMCE, even small changes in distribution will make the uAMCE different from the pAMCE.
The right two plots of Figure 5 visualize the distributions of three factors Security Policy, Abortion Policy, and Party alongside the cAMCEs of Gender conditional on each of the three factors. For example, the first row in the third plot presents the estimated cAMCE of being female relative to male, conditional on having the Security Policy factor equal to Cut military budget. Focusing on the Security Policy factor, we observe that although its cAMCEs are modest in size, the distribution for Democratic politicians differs substantially from the uniform distribution. Thus, the difference induced by the Security Policy factor is being driven primarily by distributional differences. Repeating this approach for each factor tells us whether the difference between the uAMCE and the pAMCE is a function of distributional changes or causal interactions.
As an important diagnostic, we evaluate the assumption of no three-way interactions. In particular, we incorporate three-way interactions between Gender, Party, and each of the four policy positions given that the difference between the uAMCE and the pAMCE is mostly attributable to those factors. Because we have information about the joint distribution of politicians’ attributes, we use them when we marginalize over three-way interactions to estimate the pAMCE. Figure 6 shows that the pAMCE estimates based on the three-way interaction model are similar to those based on the two-way model both in terms of point estimates and standard errors. This result demonstrates that, even when researchers have access only to marginal distributions of the target profile population, it is possible to consistently estimate the pAMCEs by using the marginal population randomization design.
Assess the existence of three-way interactions. We compare the pAMCE estimates from models that assume two-way interactions and that incorporate three-way interactions.

Finally, we examine the robustness of the pAMCE estimates based on the 115th Congress to alternative profile distributions based on the available candidate-level data rather than the data on elected politicians. Although these candidate-level data do not contain information for all factors, we can take into account a number of important candidates’ characteristics. In particular, we use DIME data set (Bonica, Reference Bonica2015) and the Reflective Democracy (RefDem) datasetFootnote 8 to obtain the profile distributions of three key variables (race, gender, and experience). We also use our substantive knowledge to investigate different theoretically relevant profile distributions on policy dimensions. We provide details of these alternative profile distributions in Supplemental Appendix C. We show that the pAMCE estimates are robust to these different profile distributions that more accurately reflect the real-world distribution of political candidates (see Figure A3 in Supplemental Appendix C). These results imply that the difference between the pAMCE and uAMCE is mainly driven by the fact that the uniform distribution is far away from the actual distribution of politicians’ characteristics. In contrast, the difference between the distribution of attributes for elected politicians and that for candidates is relatively minor and has little impact on the empirical findings.
5.2 The Effect of Information Environment on Partisan Voting
In this section, we revisit a major finding of the original study that the importance of copartisanship declines as voters are given more information about candidates.
5.2.1 Design-Based Analysis
We begin with the design-based confirmatory analysis. To estimate the pAMCE, we use the marginal population randomization design by randomizing each factor according to the counterfactual distributions of interest. We also employ the mixed randomization design, retaining the uniform distribution for a primary factor of interest—copartisanship, in this case—and using the counterfactual distributions for all remaining factors. We rely on a weighted difference-in-means estimator (Equation (5)) and cluster standard errors by respondents.
The left plot of Figure 7 presents results of this analysis. Consistent with the original finding, the pAMCE of copartisanship is estimated to be the largest under the low information distribution (
 $61.84$
percentage points,
 $[59.06, 64.62]$
) while the effect is the smallest under the high information distribution (
 $38.39$
percentage points,
 $[35.13, 41.65]$
) using the mixed randomization design. Results are similar under the marginal population randomization design. Thus, the importance of copartisanship in subjects’ voting decisions can vary by more than
 $20$
percentage points depending on the information environment.
The estimated population AMCEs of copartisanship in Peterson (Reference Peterson2017). We estimate the pAMCE of being copartisan under three different distributions – a medium information distribution and the low and high information distributions.

5.2.2 Model-Based Analysis
Next, we estimate the same three quantities using model-based exploratory analysis. To do so, we run an unregularized linear regression using all two-way interactions between the ten factors described in Table 2. While regularization is generally preferred, the factors here are binary. Since the goal of regularization is to improve efficiency by collapsing levels of a factor that have similar effects, regularization is not needed in this case. Standard errors are based on 2,000 block bootstraps clustered by respondents.
The second plot in Figure 7 presents these results. As in the design-based confirmatory analysis, the pAMCE of copartisanship is the largest under the low information distribution (
 $61.87$
percentage points,
 $[57.34, 66.40]$
) and the effect is the smallest under the high information distribution (
 $38.21$
percentage points,
 $[33.69, 42.73]$
). Although standard errors for the model-based exploratory analysis are larger than those of the design-based confirmatory analysis, the difference between them in this application is relatively small. This is due to the fact that the design in Peterson (Reference Peterson2017) is low-dimensional, comprised only of binary factors.
After showing that copartisanship effects are indeed smaller when a larger number of candidate characteristics are shown, the author conducts the second analysis to unpack the mechanism by identifying which information is responsible for reducing the effect of copartisanship. To answer this question, he considers an extreme counterfactual distribution, in which only one factor (in addition to copartisanship) is shown to respondents and examines the difference in the pAMCE of copartisanship with and without this additional factor. The author repeats this analysis separately for each of the nine factors and finds that policy positions on spending and abortion result in the largest differences.
In our pAMCE framework, there is no need to consider each factor in isolation. Instead, we directly examine the sources of the difference in the pAMCE of copartisanship between the low and high information environments. To do so, we use the decomposition formula. The left plot of Figure 8 shows that the difference observed in Figure 7 is mainly driven by two factors, Spending Stance (
 $-7.60$
percentage points,
 $[-12.16, -3.04]$
) and Abortion Stance (
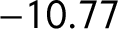 $-10.77$
percentage points,
 $[-15.38, -6.16]$
). This result suggests that respondents use copartisanship mainly as a cue for policy stances on spending and abortion, consistent with the original findings.
Decomposition of the difference between the two pAMCEs of copartisanship between high and low information environment. The left plot decomposes the overall difference into each factor. The difference is mainly due to the two factors, Spending Stance and Abortion Stance. The second and third plots investigate how the conditional AMCE and the difference in the profile distributions contribute to the difference.

Finally, we examine why these factors drive the difference in the copartisanship effect between the low and high information environments. The second and third plots of Figure 8 present the distribution and the cAMCEs of each factor. Taking Spending Stance as an illustration, we find that the cAMCE for Shown (the bottom estimate) is much smaller than for Not Shown (the second estimate from the bottom). There is a strong interaction between factors Party and Spending Stance, yielding the large difference of the pAMCE between the high and low information environments. In contrast, little difference exists in the cAMCEs of copartisanship conditional on Age (see the first and second estimates in the third plot). This is why the difference of the pAMCE due to Age is small (third estimate in the first plot).
6 Concluding Remarks
Over the last several years, conjoint analysis has become increasingly popular in political science. One advantage of conjoint analysis is its unique ability to help researchers systematically examine various decision making processes faced by individuals in the real world. This attractive feature has boosted the external validity of empirical conclusions based on conjoint analysis.
Yet, little attention has been paid to the choice of the profile distribution used for randomization. While most researchers use the uniform distribution for convenience, this leads to a causal quantity—the uniform average marginal component (uAMCE) effect—that gives equal weights to all possible profiles, including those that rarely occur in the real world.
We address this problem by defining an alternative quantity of interest, the population average marginal component effect (pAMCE), using the target profile distribution based on substantive knowledge. We propose new experimental designs and estimation methods for inferring the pAMCE. We then illustrate their use with two empirical applications, one using a real-world distribution and the other based on a counterfactual distribution motivated by a theoretical consideration.
While we focus on the issues related to the distribution of profiles in conjoint analysis, our proposed methodology applies to any factorial experiments with many factors. Moreover, the importance of designing realistic interventions goes beyond conjoint analysis and survey experiments. Indeed, unlike the widely recognized issues related to the representativeness of the experimental sample, the realism of treatments is an essential yet under-appreciated element of external validity. We thus believe that the use of realistic treatments is essential in ensuring the theoretical and practical relevance of any experimental research.
Acknowledgments
We thank Jens Hainmueller, Dan Hopkins, Dean Knox, Shiro Kuriwaki, Thomas Leavitt, Erik Peterson, and Teppei Yamamoto for helpful comments and conversations.
Data Availability Statement
Replication code for this article has been published in Code Ocean, a computational reproducibility platform that enables users to run the code and can be viewed interactively at de la Cuesta, Egami, and Imai (Reference de la Cuesta, Egami and Imai2020a) or at https://doi.org/10.24433/CO.9475665.v1. A preservation copy of the same code and data can also be accessed via Dataverse at de la Cuesta et al. (Reference de la Cuesta, Egami and Imai2020b) or at https://doi.org/10.7910/DVN/HVY5GR.
Supplementary Material
For supplementary material accompanying this paper, please visit https://doi.org/10.1017/pan.2020.40.