Introduction
The recent rapid development of transparent electronics[ Reference Fortunato, Barquinha and Martins 1 ] is driven by the revolution in transparent displays, overshadowing work on other transparent technologies necessary to deliver fully transparent and functional devices. Particularly, transparent energy storage devices are relevant for transparent personal or wearable electronic devices. The development of such power sources has been however limited. In the case of supercapacitors, works offering sufficiently thin carbon electrodes were presented offering effective capacitances around 1 mF/cm2 at a transparency around 50%[ Reference Gao, Shao, Wu, Wang, Zhang, Wang and Wang 2 , Reference Ge, Cheng and Chen 3 ] or 0.5 mF/cm2 at higher transparencies.[ Reference Kanninen, Dang Luong, Sinh, Anoshkin, Tsapenko, Seppälä, Nasibulin and Kallio 4 ]
An emerging competing approach is to apply intrinsically transparent wide band gap oxide semiconductor nanostructures such as Co3O4 [ Reference Liu, Gao and Yang 5 ] or zinc oxide (ZnO) to achieve device transparency with increased surface areas.[ Reference Borysiewicz, Wzorek, Mysliwiec, Kaczmarski and Ekielski 6 ] ZnO thin films are widely known as a transparent conducting electrode material,[ Reference Lyubchyk, Vicente, Alves, Catela, Soule, Mateus, Mendes, Águas, Fortunato and Martins 7 ] but they have not been thoroughly studied in transparent energy storage applications. The application of transparent nanostructured oxide materials in place of carbon may enable reaching capacitances higher than for carbon at elevated transparencies due to the limited thickness of the carbon films possible to maintain their transparency. The capacitance of the ZnO electrodes can be increased by coating them with thin enough MnO2 nanostructures. MnO2 is known for its high capacitance due to both redox and ion intercalation capabilities. MnO2 has to be very thin to be transparent; however, due to the presence of the ZnO scaffold, the total area of the electrode is large.
This work focuses on the influence of ZnO electrode morphology on the resulting device performance. In terms of carbon-based materials, it has been known that a hierarchical pore morphology yields the optimal results, facilitating both quasi-bulk electrolyte penetration as well as intercalation.[ Reference Beguin and Frąckowiak 8 ] We try to reach similar conclusions for the oxide-based system and relate the structural properties of the electrodes with the device electrical and optical performance, which can be beneficial for other works on the oxide electrodes. Furthermore, as most of the works concerning transparent supercapacitors apply lab-scale benchtop electrode fabrication techniques, the approach presented in this work is unique in its utilization of a proprietary magnetron sputtering technology to fabricate the ZnO nanostructures enabling high purity, rigid control, large area coating and high throughput of the process.
Experimental details
The ZnO films were deposited by reactive sputtering in a Surrey Nanosystems Gamma 1000C reactor using a process described thoroughly elsewhere.[ Reference Borysiewicz, Wojciechowski, Dynowska, Kamińska and Piotrowska 9 , Reference Borysiewicz, Dynowska, Kolkovsky, Dyczewski, Wielgus, Kamińska and Piotrowska 10 ] A 75 mm diameter Zn target was sputtered in an oxygen/argon mixture at low-pressure and low oxygen content using a DC power supply at 80 W. The substrate is not intentionally heated during deposition. We are able to control the morphology of the grown nanostructures by changing the flow values of the argon and oxygen sputtering gases.[ Reference Masłyk, Borysiewicz, Wzorek, Wojciechowski, Kwoka and Kamińska 11 ] We chose the following Ar:O2 sccm flow ratios for this experiment: 3:0.3, 3:0.6, 10:1, 10:2, 20:2, and 20:4 providing a wide spectrum of morphologies to be studied. From this point the samples will be identified by the flow ratios used, e.g. “20:2”. All the as-deposited films except “20:4” were zinc nanostructures and therefore were subjected postdeposition oxidation in a Rapid Thermal Processing (RTP) furnace at 400 °C for 5 min in pure oxygen. Subsequently, all samples were annealed in Ar and H2 gas mixture at 350 °C for 30 s to dope the ZnO with hydrogen.[ Reference Janotti and van de Walle 12 ] The ZnO is a material itself exhibiting only electrostatic charge storage therefore in order to achieve higher capacitances, we decided to cover it with solution-grown MnO2 nanoparticles. We applied the approach of Luo[ Reference Luo 13 ] for the synthesis of MnO2 nanoparticles where a reaction of KMnO4 with poly(allylamine hydrochloride) in water solutions was performed. We also added sodium dodecyl sulfate as surfactant to inhibit nanoparticle aggregation to maintain the high device transparency. The electrode morphology was studied using scanning electron microscopy and digital image processing was applied to the images to get statistical information concerning the pore sizes and their relationship to the capacitances. The capacitors were assembled using two symmetrical electrodes of 700 nm thickness, fabricated on fluorine-doped tin oxide covered glass. A shadow mask was used for the deposition to achieve an active device area of 1 cm2. A gasket was cut out of a 100 µm-thick double-sided scotch tape and the electrolyte used was a LiCl-based one gel electrolyte with poly(vinyl alcohol) and water as prepared by other groups.[ Reference Wang, Lu, Ling, Zhai, Wang, Tong and Li 14 ] The gel electrolyte was drop casted on one electrode, doctor bladed to be of equal thickness to the gasket and then the two electrodes were pressed together. The complete device was tested using a Gamry Reference 3000 potentiostat by measuring the cyclic voltammetry (CV), charge/discharge cycles from 0 to 1 V bias, and electrochemical impedance spectroscopy in the frequency range 0.1 Hz–1 MHz. Finally, optical transmission measurements were performed on a Woolam M2000 spectral ellipsometer and the transmission coefficient values and energy gaps were calculated.
Results and discussion
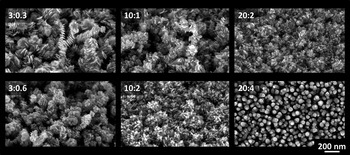
Figure 1 shows the plan-view scanning electron microscopy (SEM) images presenting the morphologies electrodes. It is necessary to note that for all process parameters, except the “20:4”, the as-deposited material is zinc with surface native oxide coverage. The “20:4” sample grows already as ZnO after deposition. The morphology evolution takes place during growth in the following manner: the more gas is flowing, the morphology becomes more dense as the crystallite sizes diminish due to the lowered mobility of the Zn adatoms with the increase in oxygen content at the growth surface. This in turn leads to the formation of new nucleation centers and smaller crystallite sizes as well as denser pores, as was described in detail in our previous work.[ Reference Masłyk, Borysiewicz, Wzorek, Wojciechowski, Kwoka and Kamińska 11 ] For the 20:4 the oxygen content is large enough for a transition to full ZnO growth to occur in the form of separated nanocolumns perpendicular to the substrate. Additionally, it can be observed that the increase in the oxygen flow induces less rough film morphologies, as their shape gradually progresses from heavily branched, rough films for 3:0.3 to smoother films with smaller crystallites and denser branches in 10:2 and 20:2. The roughness for the 20:4 sample is again high, but this is since the nanocolumns progress to the bottom of the substrate; however, the film thickness uniformity and orientation is high.
SEM plan view images of the ZnO electrodes. The numbers correspond to sample names.

Since the performance of the supercapacitor is related strongly to porosity and morphology of the electrodes, we analyzed the SEM images using digital processing in the ImageJ software. The images were binarized, which enabled to calculate relative porosities and pore area statistics. Relative porosity was defined as the ratio of pore area to the total image area. The binary images were skeletonized and total pore lengths in the image plane were determined. Owing to the nature of the skeletonizing process, statistics performed on these pore lengths represent the statistics of the pore areas and can be used for comparison, although the units are arbitrary.
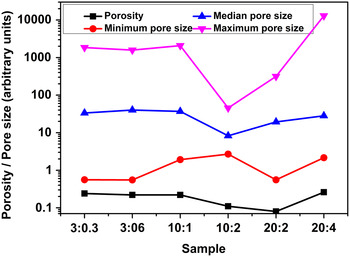
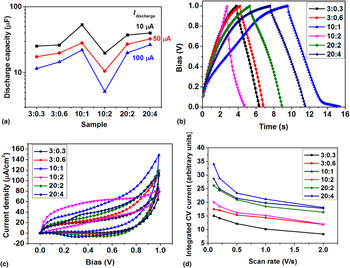
Figure 2 presents the results of the image analysis. It can be seen that the term “porosity” itself is not significantly related to the other size-related parameters, as it merely means the percentage of the film taken up by void spaces, or pores, no matter how big they are. This parameter can describe the densification of the film as discussed above. However, it does not correlate well with the effective device capacitances measured during cyclic charging and discharging shown in Fig. 3(a). The performance of single electrodes follows a similar trend and their electrochemical behavior is presented in Fig. S1 in the online Supplementary material.
Selected statistical parameters of the pores in the electrodes, yielded from image analysis of the SEM images.

Results of the performance tests of the supercapacitors. (a) Effective discharge capacity as a function of discharge current; (b) charge/discharge curves for 10 µA charge/discharge currents; (c) CV sweeps with the rate 1 V/s; (d) integrated CV current as a function of the CV scan rate.

The process parameters strongly influence the effective capacitances of the devices. The highest effective capacitances are registered for the sample “10:1” and the lowest for the subsequent “10:2”. It is worthwhile to note that by changing the morphology from the “10:2” to “10:1” the capacitance is increased by 250%. Comparing the morphology and pore parameter trends with the capacitances one sees that a dip in the capacitance trend corresponds to the dip in maximum and median pore sizes as well as the peak in the minimum pore size. Therefore, the overall range of pore sizes is the smallest for this sample. This means that this material has a more sponge-like architecture, without the hierarchical branching of micropores into mesopores and macropores. Such a hierarchical system is known to provide a better ion flow and results in higher currents in the device and thus higher capacitances.[ Reference Zhong, Xu, Li, Fu and Wu 15 , Reference Dutta, Bhaumik and Wu 16 ] The “3:0.3”, “3:0.6”, and “10:1” systems are the ones exhibiting wide pore size ranges and a hierarchical morphology. Out of these, the system “10:1” yields the highest effective capacitance, which may be due to an optimal hierarchy of the pore sizes achieved. The case of the sample “20:4” is different from the other ones due to the presence of separated nanocolumns and only several small size pores. However such morphology, although not hierarchical may also combine the mesoporosity for increased current flow with a well accessible electrode surface area for ions. In the studied case, it is also relevant to remember that it is not only the electrolyte that penetrates the pores of the ZnO electrode—the first to penetrate is the suspension of the synthesized MnO2 nanoparticles. To achieve a high coverage of the ZnO surface with MnO2, they have to get deep into the nanostructures and the optimal morphology for that might be related to the parameters of the suspension itself, depending on its preparation reaction and composition.
Increasing the charging current in Fig. 3(a) led to a drop in the device efficiency, with the smallest drop observed for the “20:4” morphology and the most significant for the “10:2” morphology. The electrode loading masses could be calculated based on the determined porosity of the electrodes and resulted in about 300 µg/cm2. The resulting gravimetric capacitances were in the range 0.015–0.17 F/g and are presented in detail in the Supplementary material (see online Supplementary material Fig. S2). The shapes of the charge–discharge curves and of CV curves presented respectively in Figs. 3(b) and 3(c) show nonlinearities, signifying a degree of non-electrostatic charge storage mechanisms; however, no significant redox peaks are seen in any of the samples except the “20:4”. There a peak around 0.32 V is visible in both anodic and cathodic currents. The spacing of the cathodic and anodic peaks is about 43 mV and their intensity ratio is 0.93 with regard to the respective baselines indicating an almost ideally reversible, redox, reaction.
In all CV scans, there is significant nonlinear current increase when the bias reaches 1 V, which might be related to a voltage peak in its vicinity; however, due to the limited voltage window of the water-based gel electrolyte used, we did not bias higher not to start the process of water electrolysis (taking place about 1.2 V).
Figure 3(d) shows the change of the integrated capacitance, related to the areas enclosed by the CV curves, as a function of the bias sweep rate, for each sample. The curves themselves are included in the supplementary material (see online Figs. S3–S8). The integration of the CV curve yields its area which, when normalized to the bias range and bias sweep rate can be related to the capacitance of the device. This “integrated” capacitance decreases at higher scan rates as shown in Fig. 3(d), which is a common observation in supercapacitors.[ Reference Leyva-García, Lozano-Castelló, Morallón and Cazorla-Amorós 17 , Reference Khalid, Cao, Wang and Zhu 18 ] This is due to a decrease of the accessibility of the surface of the electrode for the ions which do not have enough time to diffuse into the complex morphologies, reaching only the parts of the electrode closest to its surface. The analysis of the behavior of peaks found in CV measurements for this sample as a function of the voltage sweep rate shows that the potential difference between the peaks increases with the increase in the sweep rate, an indication of the irreversible processes (see online Fig. S9). Also, the intensity ratio changes with the cathodic current being always higher than the anodic, with the ratio reaching even 4.2 at the lowest rate of 0.1 V/s. The current intensities are proportional to the voltage sweep rate and not the square root of the voltage sweep rate (see online Fig. S10), indicating that for this sample, the electroactive species is not in diffusion regime, but is confined close to the electrode surface. It might be possible that since the material already grows as ZnO, not as Zn as for the other electrode morphologies, and does not undergo ex-situ high-temperature oxidation annealing, its surface chemistry could be oxygen-deficient, which may influence the reactivity of the electrode. It should be underlined that this analysis concerns only the species related to the peaks in the CV curves and not all ions in the electrolyte, behaving more or less electrostatically and yielding the complete shape of the CV curve.
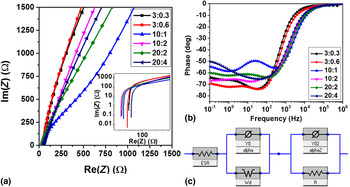
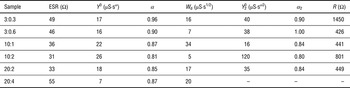
Electrochemical impedance spectroscopy measurements were performed on the devices and the Nyquist plots and phase changes as a function of probing frequency are presented in Figs. 4(a) and 4(b), respectively. The impedances increase in the low frequencies, with a behavior typical of a diffusion impedance and at frequencies around 1 Hz have a second time constant visible in the phase changes. Therefore, their behavior was modeled using a series connected resistance (ESR), a parallel constant phase element (CPE) with a Warburg impedance and a parallel CPE with a resistor [see Fig. 4(c)]. In all samples, except the “20:4” this model yielded a good fit, in the latter the second parallel CPE + R circuit had to be removed from the model. The model fit parameters are presented in Table I.
Results of electrochemical impedance spectroscopy. (a) Nyquist plots in the high frequency range, inset showing the full range in a log–log scale; (b) phase of the complex impedance as a function of the probing frequency; (c) the equivalent circuit used for fitting of the impedance versus frequency dependence.

Model fit parameters for EIS, ESR—series resistance, Y 0, α, and Y 0 2, α 2—the parameters of the first and second CPEs, W d—Warburg diffusion impedance, and R—resistance in the low-frequency CPE + R circuit. The symbols relate to the schematic in Fig. 4(c).

Interestingly, the series resistance is the lowest for the two samples with the most dense pores, i.e., “10:2” and “20:2”, followed by the sample with the highest capacitance (“10:1”). The sample with the nanowires on the other hand exhibits the highest ESR. This trend shows the same character as that obtained for the porosity values. The diffusion impedance trend on the other hand, as well as the 1/Y 0 2 both relate well to the capacitance values for the samples (see online Fig. S11).
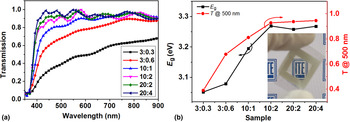
Finally, the optical transmission of the devices was measured [see Figs. 5(a) and 5(b)]. The transmission coefficient increases with the increasing gas flow. This is due to reduced light scattering on smaller nanocrystals as well as possibly a higher oxygen content in the electrodes, closer to that of ZnO. For the samples 10:2, 20:2, and 20:4 the transmission value for 500 nm light is above 90%. Small energy gap changes were recorded—an increase with the flow values, following that of the transmission. The energy gap reaches a plateau about 3.26 eV for the three final samples in order [see Fig. 5(b)], the value being almost identical with the energy gap for the pure ZnO.[ Reference Janotti and van de Walle 12 ]
(a) Optical transmission spectra for the supercapacitors; (b) optical transmission at 500 nm and energy gap for the devices. The visible oscillations are related to light interference in the device. Inset in (b) shows a photograph of the “20:2” device in front of the logo of the Institute of Electron Technology.

Conclusions
We fabricated nanostructured ZnO electrodes by magnetron sputtering with postdeposition annealing and decorated them with solution-grown MnO2 nanoparticles for transparent supercapacitors. By precisely controlling the growth conditions, various morphologies of the ZnO nanostructures were obtained. Then, a series of material and device characterizations was performed to find out the relationships between the morphologies and device performances.
Based on SEM image processing we found that the ZnO/MnO2 morphologies with the lowest capacitances were those where the pore size range was the smallest. The highest capacitances were obtained for larger pore size ranges and morphologies providing a good macroporous structure combined with mesoporous and nanoporous ones. The difference in capacitance between the worst and best devices was 250%, showing that choosing an optimal device morphology is of great importance for device performance. The character of the charge storage mechanism was not completely electrostatic as evidenced by nonlinearities in the characteristics. However, only for the electrodes with the nanocolumnar morphology did the CV show redox-like current peaks. Their analysis showed that these reactions were in fact irreversible, not redox, processes. Furthermore, the electroactive species were not diffusing but confined close to the electrode surface. In order to explain why such effects had taken place in these and not in other electrodes, additional chemical composition studies are planned. Electrochemical impedance spectroscopy of the devices revealed that the impedance is mostly described by the diffusion Warburg impedance in parallel with a CPE; however, a second parallel CPE/R circuit was needed to accurately describe the data around 1 Hz. The additional CPE/R circuit had to be removed for the devices presenting the current peaks, most probably due to the existence of another charge storage mechanism. Device transparencies above 90% for light of 500 nm wavelength were achieved. It was due to the small crystals or high alignment in the nanocolumnar case, leading to reduced light scattering. Variations in energy gap values indicate the possibility of changes in chemical composition, which topic will be addressed in the future.
Supplementary material
The supplementary material for this article can be found at https://doi.org/10.1557/mrc.2017.16.
Acknowledgments
This majority of this research was supported by the National Centre for Research and Development in the frames of the Lider V Programme through the project “Nanocoral zinc oxide-based supercapacitors for transparent electronics (NACZO)”, contract: LIDER/030/615/L-5/NCBR/2014.[ 19 ]