
1. Introduction
Inspired by the bouncing drops of Couder (Couder et al. Reference Couder, Protière, Fort and Boudaoud2005), we propose here (the first to our knowledge) experimental results on the dynamics of a Cartesian diver forced to oscillate in a layer of stably stratified fluid. In addition to studying this original dynamical system, the final goal of our investigations will be to explore new possibilities of hydrodynamical quantum analogues since, as we will see, our system associates a free moving particle and its own wave field.
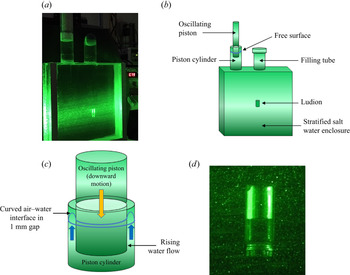
The Cartesian diver (also called ‘ludion’ in French) is a small object denser than the water in which it is immersed but which encloses a pocket of air. By decreasing the pressure in the water, this air pocket expands, increasing the buoyancy force that opposes the weight of the diver that rises accordingly. In contrast, if the pressure increases, the air compresses, causing the diver to sink. The first reference to such an object dates from 1648, when Raffaello Magiotti published his work on the resistance of water to compression (Magiotti Reference Magiotti1648). In this historical publication, we can find the very first drawings of a ludion, credited to Magiotti. The notes that Magiotti had accumulated were destroyed during the great plague that raged in Rome in 1656 and of which he died. Later, in the first half of the 18th century, John Theophilus Desaguliers, a French-born philosopher, became a curator of the experiments of the Royal Society in London. Desaguliers wrote a book on experimental philosophy, in two volumes (1734 and 1744), in which he presented the ludion (Desaguliers Reference Desaguliers1744). We will keep in the following both appellations: the ludion and the diver. However, it is not known how the names ‘Cartesian diver’ or ‘Cartesian devil’ appeared and were popularized (Ackerson (Reference Ackerson2020) and references therein). Unlike the case of a homogeneous fluid, in which the diver has an unstable equilibrium position except in a small window of perturbation amplitudes (Güémez, Fiolhais & Fiolhais Reference Güémez, Fiolhais and Fiolhais2002), if the diver is immersed in a stably stratified fluid it possesses a linearly stable equilibrium position, as can be observed on figure 1.
(a) Picture of the container with the stratified layer of salt water and the ludion at its stable height. (b) Drawing of the container with its filling tube and piston cylinder. Because of the density stratification, the ludion floats at an equilibrium position  $z=0$ around which it is forced to oscillate vertically when the pressure is periodically changed by moving the piston. (c) Sketch of the piston inside the pipe that illustrates the pressure oscillating terms coming from the hydrostatic pressure and from the Laplace capillary pressure induced by the curved air water interface in the 1 mm gap between the piston and the pipe. In the sketch, the piston is descending. The reverse situation occurs when the piston is rising, with an interface curved inversely. (d) Close-up of the ludion with the air–water interface.

If the pressure is varied sinusoidally, the diver oscillates vertically around its stable position and behaves as an oscillator which can experience a resonance when the driving frequency is tuned. The first part of this study (§ 2) is devoted to the presentation of the experimental set-up and to the measuring devices. Then the analysis of the ludion dynamics in the neighbourhood of this resonance is presented in § 3. These calculations describe the main characteristics of the ludion dynamics including its added mass and friction coefficients. A series of experiments whose results are described in § 4 are devoted to the determination of the resonance which is compared with the analytic prediction. If the forcing frequency is lower than the Brunt–Väisälä frequency, the diver generates internal gravity waves that we characterize by particle image velocimetry (PIV) (Thielicke & Stamhuis Reference Thielicke and Stamhuis2014) and present in § 5. At a high amplitude response to the periodic forcing, i.e. when the forcing frequency is close to the resonant frequency, the ludion dynamics shows a bifurcation to free horizontal locomotion in a similar way to the vertically flapping wing of Vandenberghe, Zhang & Childress (Reference Vandenberghe, Zhang and Childress2004) or, more recently, to the oscillating spheroids simulated by Deng & Caulfield (Reference Deng and Caulfield2018). As soon as the oscillation amplitude is sufficiently large, this horizontal swimming appears regardless of the value of the forcing frequency, i.e. with or without the presence of internal gravity waves. The description of the bifurcation to this free dynamics is given in § 6. Finally, in the last section, some perspectives of this work for future research will be given. In particular, we mention the possible interaction of the ludion trajectories with its own internal gravity waves, which is reminiscent of the drops that bounce on the free surface of a vibrating liquid (Couder et al. Reference Couder, Protière, Fort and Boudaoud2005; Perrard et al. Reference Perrard, Labousse, Miskin, Fort and Couder2014; Bush Reference Bush2015).
2. Experimental set-up and methods
All of the following experimental developments were realized in the Physics Department of UNAM in Mexico. For our experiments, a transparent acrylic rectangular container with dimensions  $33\,\textrm {cm} \times 33\,\textrm {cm}\times 6\,\textrm {cm}$ is filled with salt water (kitchen salt – NaCl) using the double bucket technique (Oster Reference Oster1965) to create the desired density stratification. The smallest dimension of this chamber is in the horizontal plane. Then a small hollow glass cylinder (the diver or ludion) (35 mm high for a diameter
 $D= 12.5$ mm) is introduced with care in order to preserve the density stratification. This diver (including its air pocket) was prepared to have a mean density intermediate between the minimum and maximum density of the fluid, and thus after its dropping it slowly sinks in the stratified layer and finds an equilibrium position. The fluid density vertical profile is measured by an Anton Paar MD 35 densimeter with an accuracy of
 $10^{-4}$. An example of such density stratifications is presented in the Appendix. It is worth mentioning that, as can be seen on the figure, the two density profiles measured before and after the experiments collapse nicely on a single curve proving that no mixing occurs in the experimental chamber. The stratification is characterized by its Brunt–Väisälä frequency
 $N = \sqrt {- ({g}/{\rho _0}) ({\textrm {d} \rho }/{\textrm {d} z})}$ where
 $z$ is the vertical coordinate,
 $g$ the gravity and
 $\rho$ the density of the fluid at level
 $z$. Here
 $\rho _0$ is the density of the fluid at position
 $z=0$, chosen at the ludion equilibrium position. As shown in figure 14, a linear fit of the density measurements leads to the determination of
 $N$ with an accuracy of a few per cent. Before filling the container with stratified salt water, some micrometre-sized PIV particles were added to the fluid. A 5 cm thick homogeneous dense layer of salt water is kept at the bottom of the container and a 10 cm thick layer of fresh water at the top. With the exception of a 50 mm inner diameter open pipe at its top wall (see figure 1a,b), the container is completely closed so that its pressure can be controlled by moving a piston (having a diameter of 48 mm) inside this pipe, which as a consequence modifies the vertical level of the free surface of water inside the pipe and thus the pressure in the container. At the outlet of the pipe, is inserted a porous material to prevent any flow at this outlet. The absence of flow entering the working area has been verified by PIV. In all of the experiments, the piston is translated sinusoidally in its cylinder at a chosen frequency by a precise stepper motor (NEMA 34 from Kollmorgen with 25 000 steps per rotation), causing a rise or a descent of the water surface inside the piston cylinder. This change in pressure is a priori measured by the amplitude of the free surface oscillations which is in all the cases presented here equal to 1.4 cm. In fact, this pressure oscillation needs to be supplemented by a surface tension contribution that is added when comparing the theory with the experimental data. A sketch of the piston inside the pipe is presented in figure 1(c) and illustrates the presence of a Laplace capillary pressure term due to the narrow gap between the piston and the cylinder. The size of this small gap is of the order of 1 mm and the surface tension pressure is calculated to be of the same magnitude of the hydrostatic pressure. Thus, the total change in pressure is in fact twice the 140 Pa estimated first. To complement the description of the experimental set-up, a close-up of the ludion is also presented in figure 1(d). The forcing frequency is varied from 0.3 to 2.5 rad s
 $^{-1}$ and each run is recorded for several minutes by a video camera (JVC Everio GZ-RY980) at a rate of 60 images per second. The video images have a resolution of
 $1920 \times 1080$ pixels. The position of the ludion is then calculated by a specially designed tracking software based on the brightness of the image, as the ludion reflects the laser light more intensively that the fluid background. Thus the accuracy of the spatial detection is one pixel, that represents in our case 0.1 mm. Note that the constant vertical gradient of the optical index of refraction due to the density gradient induces no image distortion of the ludion and thus no effect on the determination of its displacement. Moreover, if we estimate this effect for the determination by PIV of the fluid velocity in the gravity wave field (see Sutherland et al. Reference Sutherland, Dalziel, Hughes and Linden1999), the deviation of the optical rays through the layer is calculated to be less than
 $0.2$ pixel, an effect that has been neglected in the following. Several dozen stratifications were realized and the ludion dynamics investigated. However, only some of them have been exhaustively analysed. In the following, we will focus on two of them (
 $N = 1.6$ and
 $N = 2.3$ rad s
 $^{-1}$) having more than
 $20$ different experimental forcing frequency values each and permitting accurate description on the same data sets the ludion resonance and its bifurcation to swimming.
3. The forced damped oscillator model
From the theoretical point of view, it is straightforward to write down the equation of motion of the ludion from the momentum conservation equation. In fact, this question has already been addressed in the past in the context of oceanography. Larsen (Reference Larsen1969) was the first to study the damped oscillations of a neutrally buoyant sphere in a stratified layer. He explicitly calculated the loss of power due to the radiation of internal gravity waves, neglecting the viscous friction. His results show that this radiative damping stops any small oscillations in a few periods of oscillations. However, Larsen's calculation was criticized by Winant (Reference Winant1974) who reconsidered the problem in the light of experiments performed by Cairns, Munk & Winant (Reference Cairns, Munk and Winant1979) on the descent of neutrally buoyant floats in the ocean. Winant (Reference Winant1974) considered for his analysis a quadratic drag law as opposed to the linear law used by Larsen (Reference Larsen1969) that takes into account the gravity wave radiation. The conclusion drawn by Winant (Reference Winant1974) and observed in the experiments, was that at small displacements of the sphere, the damping term is due to internal gravity waves as predicted by Larsen (Reference Larsen1969), whereas one needs to incorporate in the equation of motion the quadratic drag term at large displacements as encountered in float descents from the sea surface.
In our experiments, the glass cylinder itself (of density  $\rho _g$) occupies a volume
 $V_g$. Its mass is thus
 $M= V_g \rho _g$. The buoyancy force that opposes its weight is
 $F_B = g \rho (z) (V_a + V_g)$, where
 $\rho (z)$ is the density of the fluid surrounding the ludion at position
 $z$ and
 $V_a$ is the volume of the air bubble entrapped in the cylinder. Therefore, at equilibrium, supposed at
 $z=0$ and fluid density
 $\rho _0$, we have
 $M = \rho _0 (V_a + V_g)$. When changing the pressure in the container of stratified salt water by oscillating the piston up and down in its pipe, the initial volume of the air bubble
 $V_{a0}$ varies following a process that we suppose to be adiabatic:
 $V_a(t,z) = V_{a0} ({P_0}/{P(t,z)})^{1/\gamma }$, where
 $\gamma$ is the ratio of specific heats of air. This hypothesis can be justified by the fact that the period of oscillation of the ludion will be around three seconds, i.e. smaller than the heat diffusion time in the air bubble of the order of five seconds. Let us also remark that supposing an isothermal process will only imply to take the value of
 $\gamma$ equal to unity.
In the following, to obtain the equation of motion for the ludion that moves along the vertical axis of a distance  $\xi$ versus the equilibrium position
 $z=0$, we will suppose that the change in volume of the air bubble trapped inside the diver affects only the buoyancy force. This is equivalent to the classical Boussinesq simplification of buoyant flows. The equilibrium pressure
 $P_0$ is modified by the addition of a small perturbation
 $\textrm {d} p =\rho _0 g \,\textrm {d} h \cos (\omega t)$ created by moving the piston up and down in the pipe, inducing, respectively, a decrease or an increase of the water level in the pipe of a quantity
 $d h$. The motion of the ludion is then described by the following equation:
 \begin{equation} M \frac{\textrm{d}^2 \xi}{\textrm{d} t^2} ={-} M g + F_B + F_A + F_H - \mu \frac{\textrm{d} \xi}{\textrm{d} t}, \end{equation}
where  $F_A$ is a hydrodynamical force that originates from the motion of water entrained by the displacement of the ludion. This force is classically written as
 \begin{equation} F_A={-} \textrm{Re}\left(C_A M \frac{\textrm{d}^2 \xi}{\textrm{d} t^2}\right), \end{equation}
with  $C_A$ a complex added mass coefficient:
 $C_A = C_{Ar} + \textrm {i} C_{Ai}$. When the motion is periodic with an angular frequency
 $\omega$,
 $F_A$ can be split into two terms (Lai & Lee Reference Lai and Lee1981; Ermanyuk & Gavrilov Reference Ermanyuk and Gavrilov2003; Voisin Reference Voisin2007) that represent the added mass and the added friction to be incorporated into the equation of motion. Both coefficients
 $C_{Ar}$ and
 $C_{Ai}$ depend on the frequency
 $\omega$:
 \begin{equation} F_A={-} C_{Ar} M \frac{\textrm{d}^2 \xi}{\textrm{d} t^2} + \omega C_{Ai} M \frac{\textrm{d} \xi}{\textrm{d} t}. \end{equation}
Therefore, the first term of  $F_A$ will be added to the inertial term of (3.3) and the second term will be a new dissipative term that complements the friction term
 $\mu ({\textrm {d} \xi }/{\textrm {d} t})$ supposed to be for the simplification of the Stokes type because of the relatively low value of the Reynolds number of the flows, as we will see later. We should note, however, that the study of the motions of bodies and of their drag in stratified layers has been the subject of intense research (see the review by Magnaudet & Mercier (Reference Magnaudet and Mercier2020)) and it is today admitted that a supplementary drag (versus the drag exerted by the homogeneous fluid) originates in the buoyancy of the fluid entrained with the body (Yick et al. Reference Yick, Torres, Peacock and Stocker2009). Let us mention, for instance, the calculation of Motygin & Sturova (Reference Motygin and Sturova2002) of the added mass and friction terms for an oscillating cylinder that radiates planar interfacial waves in a two-layer fluid system.
Here,  $F_H$ is the history force, or the Basset force that appears when the motion is accelerated (Boussinesq Reference Boussinesq1885; Basset Reference Basset1888). Very often, this term is omitted in the determination of the drag forces applied to moving bodies, in particular when the fluid is stratified; the reason being that the motions are generally considered quasistatic (Yick et al. Reference Yick, Torres, Peacock and Stocker2009). This memory force has been, however, explicitly calculated by Candelier, Mehaddi & Vauquelin (Reference Candelier, Mehaddi and Vauquelin2014) in the case of a sphere and in the limit of small Reynolds and Péclet numbers. This memory term also has two origins: the first is due to the retroaction of the emitted waves on the motion of the ludion via the pressure field as it was calculated by Larsen (Reference Larsen1969) in the time domain, or by Lai & Lee (Reference Lai and Lee1981) in the frequency domain (for more explanations, see appendix A of the article of Ermanyuk & Gavrilov (Reference Ermanyuk and Gavrilov2002)); and the second that represents the usual viscous diffusion of vorticity in the boundary layers surrounding the body. This term is classically written as
 \begin{equation} F_H={-} \textrm{Re}\left(\eta \int_{-\infty}^{t} \frac{\textrm{d}^2 \xi / \textrm{d} \tau^2}{\sqrt{t-\tau}} \textrm{d}\tau\right), \end{equation}
where  $\eta$ is a complex coefficient
 $\eta = \eta _{r} + \textrm {i} \eta _{i}$.
In the same way we did for  $F_A$,
 $F_H$ can be split into two terms thanks to the periodicity of the motion that starts at
 $t=0$, as follows:
 \begin{equation} F_H={-} \eta_r \int_{0}^{t} \frac{\textrm{d}^2 \xi / \textrm{d} \tau^2}{\sqrt{t-\tau}} \textrm{d}\tau-\omega\eta_i \int_{0}^{t} \frac{\textrm{d} \xi / \textrm{d} \tau}{\sqrt{t-\tau}} \textrm{d}\tau . \end{equation}
With an appropriate change of variables, the analytical expression of  $F_H$ shows the appearance of the transcendental Fresnel integrals. However, if we study the behaviour of the ludion at large time, i.e. after tens of periods of oscillation, we can consider the limits of the integrals as time goes to
 $\infty$ which are finite and known quantities, and
 $F_H$ simplifies to
 \begin{equation} F_H={-} \sqrt{\frac{\rm \pi}{2\omega}} \left({\frac{\eta_r +\omega\eta_i}{\omega^2} \frac{\textrm{d}^2 \xi}{\textrm{d} t^2}+ \frac{\eta_r - \omega\eta_i}{\omega}\frac{\textrm{d} \xi}{\textrm{d} t}}\right). \end{equation}
Therefore, as can be seen in (3.6), this memory or history force  $F_H$ can be incorporated in the already existing added mass and added friction terms. This result was also used by Abad & Souhar (Reference Abad and Souhar2004) in the case of an oscillating sphere in a homogeneous fluid. In order not to overload the notation, we will keep the coefficients
 $C_{Ar}$ and
 $C_{Ai}$ knowing that they come from both the added mass force and the history force. Anyway, our experiments will not be able to disentangle the different origins of these terms.
To calculate  $F_B$, we will expand its expression at first order in
 $\xi$ and
 $\textrm {d} p$ taking into account the variation of density along the vertical axis and the change in volume due to the change in pressure, as follows:
 $$\begin{gather} \rho (z)= \rho_0 +\left. \xi \frac{\textrm{d} \rho}{\textrm{d} z}\right|_0, \end{gather}$$
 $$\begin{gather}V_a(z,t)= V_{a0} + \left. \xi \frac{\partial V_a}{\partial z}\right|_0 + \left. \textrm{d} p \frac{\partial V_a}{\partial p}\right|_0. \end{gather}$$
At first order, we obtain the following expression of the buoyancy force:
 \begin{equation} F_B=g \rho_0 (V_{a0} + V_g)+ \xi \left(g (V_{a0}+V_g) \left.\frac{\textrm{d} \rho}{\textrm{d} z}\right|_0 + g \rho_0 \left. \frac{\partial V_a}{\partial z}\right|_0\right)+ g \rho_0 \,\textrm{d} p \left. \frac{\partial V_a}{\partial p}\right|_0. \end{equation}
The first term in the expression of  $F_B$ will disappear as it is opposed to the weight of the ludion, and the equation of motion at first order reads
 \begin{align} (1+ C_{Ar}) \frac{\textrm{d}^2 \xi}{\textrm{d} t^2} &= \xi \left( \frac{g}{\rho_0} \left.\frac{\textrm{d} \rho}{\textrm{d} z}\right|_0 + \frac{g}{V_{a0}+V_g} \left.\frac{\partial V_a}{\partial z}\right|_0 \right)+ \frac{g\,\textrm{d} p}{V_{a0}+V_g} \left. \frac{\partial V_a}{\partial p}\right|_0 \nonumber\\ &\quad -\left(\frac{\mu}{M} + \omega C_{Ai}\right) \frac{\textrm{d} \xi}{\textrm{d} t}. \end{align}
The first term on the right-hand side of (3.10) is simply equal to  $-N^2 \xi$. The derivative of the volume in the second term can be rewritten as a function of the pressure, using the fact that the process is supposed to be adiabatic, i.e.
 \begin{equation} \left. \frac{\partial V_a}{\partial z} \right|_0 = \frac{- V_{a0}}{\gamma P_0} \left. \frac{\partial P_a}{\partial z} \right|_0, \end{equation}
that finally leads to (when using the hydrostatic pressure expression)
 \begin{equation} \frac{g}{V_{a0}+V_g} \left. \frac{\partial V_a}{\partial z} \right|_0 = \delta \frac{g^2 \rho_0}{\gamma P_{0}} = \omega_0^2, \end{equation}
with  $\delta = 1 - {\rho _0}/{\rho _g}$ and
 $\omega _0^2 = \delta ({g^2 \rho _0}/{\gamma P_{0}})$,
 $P_{0}$ being the reference pressure of the air pocket entrapped inside the ludion when this one is at its equilibrium position. The forcing term of (3.10) is the third term on the right-hand side and is equal to
 $- \delta \omega _0^2 \textrm {d} h \cos (\omega t)$ if the free surface position is periodically changed by an amplitude
 $\textrm {d} h$ by the piston oscillations.
Finally, the equation of motion of the ludion along the vertical axis takes the form at first order of a damped forced harmonic oscillator, as follows:
 \begin{equation} (1+ C_{Ar}) \frac{\textrm{d}^2 \xi}{\textrm{d} t^2} = \xi ( - N^2 + \omega_0^2) - \omega_0^2 \,\textrm{d} h \cos(\omega t) - \left(\frac{\mu}{M} + \omega C_{Ai}\right) \frac{\textrm{d} \xi}{\textrm{d} t}. \end{equation}
The eigenfrequency is proportional to  $\sqrt { N^2 - \omega _0^2}$. We see that in a non-stratified fluid, i.e. when
 $N =0$, we recover the fact that the equilibrium position of the ludion in a pure fluid is unstable at the first order of the expansion. In fact, Güémez et al. (Reference Güémez, Fiolhais and Fiolhais2002) have shown that when the ludion is close to the air–water interface, the nonlinear terms induce a saddle-node bifurcation in a limited domain of height and pressure perturbations (a fold catastrophe to take the terminology used by Güémez et al. (Reference Güémez, Fiolhais and Fiolhais2002)). This effect will be ignored in the following as the density stratification (if large enough) of the fluid makes our system stable at first order. It is then traditional to rename the damping coefficient by
 $2 \lambda$, so that
 \begin{equation} 2 \lambda = \frac{\dfrac{\mu}{M} + \omega C_{Ai}}{1+ C_{Ar}}. \end{equation}
4. Experimental observation of the resonance
As already explained, the ludion is then carefully immersed in the stratified fluid layer that is illuminated with a green laser sheet in order to record with a video camera (60 frames per second) the ludion oscillations as well as the PIV particle motions in itsneighbourhood.
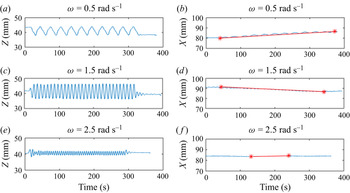
Figure 2 presents three examples of the dynamics of the ludion. We will be first interested in the amplitude of the vertical motions along the  $Z$ axis which are illustrated in the left-hand column of the figure. The horizontal motions (along the
 $X$ axis) will be studied later in § 6. As can be observed, the amplitude
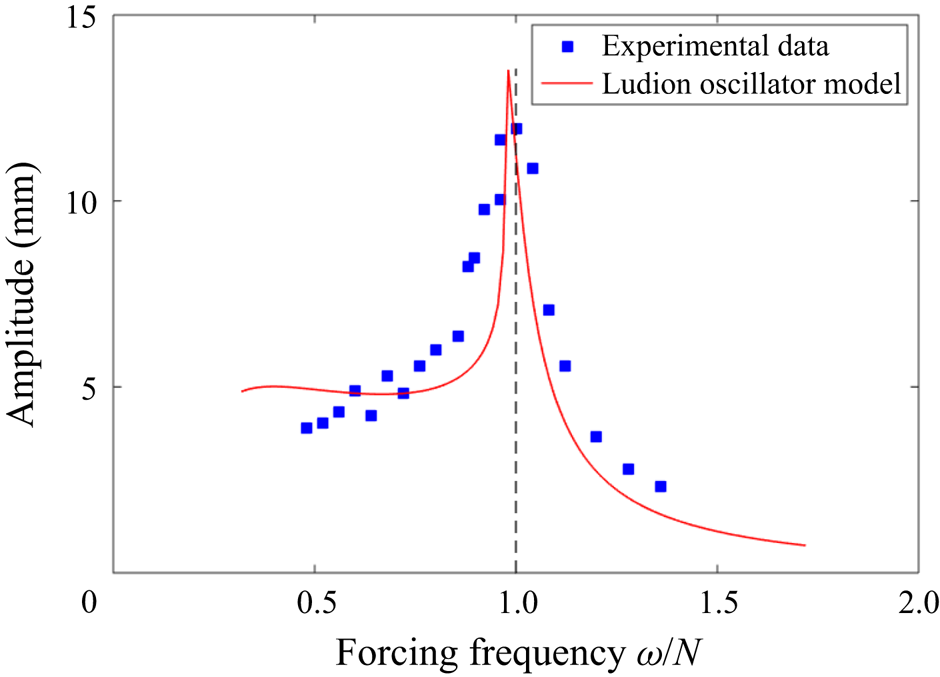
 $A$ of the vertical excursions is a function of the forcing frequency as expected by the resonant response of a damped forced oscillator. Figure 3 shows this behaviour. We observe also that the maximum amplitude is reached for a frequency slightly smaller than
 $N$ as expected from the model.
Tracking of the ludion by video image analysis for three forcing frequencies with a Brunt–Väisälä frequency  $N = 1.6$ rad s
 $^{-1}$: (a,c,e) vertical oscillations versus time; (b,d,f) horizontal excursion versus time. Red stars are the minimum and the maximum horizontal coordinates of the ludion. The red solid line between the stars is used to calculate the mean horizontal velocity between the stars.

Resonant curve of the ludion with a Brunt–Väisälä frequency  $N = 1.6$ rad s
 $^{-1}$. The data points (squares) are the vertical oscillation amplitudes
 $A$ collected from the experimental trajectories. The red solid line is the result of the analytical expression of the resonance of the oscillator that takes into account the added mass and added friction coefficients interpolated from the transient measurements, whereas the forcing free surface elevation
 $\textrm {d} h$ is chosen equal to 2.8 cm and the effective glass density as defined in the text, measured to be equal to 1445 kg m
 $^{-3}$. There are no free coefficients in the theoretical model. There are no error bar drawn on this plot as the accuracy of the oscillation amplitude measurement is better than the size of the symbols.

In order to get a comparison between our ludion oscillator model and the experimental data, we need to compute the different coefficients of (3.13). First, the mass of the ludion is determined by measuring its weight, but it appears that this mass needs to be completed by the mass of the water entrapped under the air pocket and transported with the glass cylinder. From the picture of the ludion we can guess that air and water are approximately of equal volume inside the diver. Note that this mass of water is considered to be constant as the relative change of volume of the air pocket is calculated to be of the order of  $2\times 10^{-3}$ inducing a displacement of the air–water interface not detectable on the video images. This will lead to an effective glass density (mean density of the non-compressible part constituted by glass and entrapped water in the cylinder) of 1445 kg m
 $^{-3}$, i.e. smaller than the real glass density. The second term to be estimated is the real pressure changes experienced by the ludion. This was first estimated by the rise and fall of the water level in the piston pipe. But as already mentioned, the changes in the water level need to be completed by a surface tension term equal to 140 Pa. Therefore, we will use a value of 2.8 cm that will lead to a good comparison with the experimental data. Then we can measure the added mass and friction coefficients by the study of the ludion damped oscillations after the forcing is stopped. This technique was already used by Ermanyuk (Reference Ermanyuk2000) and we will use directly the analytical relations derived in their work. The first step to evaluate
 $C_{Ar}$ and
 $C_{Ai}$, is to determine the damping coefficient
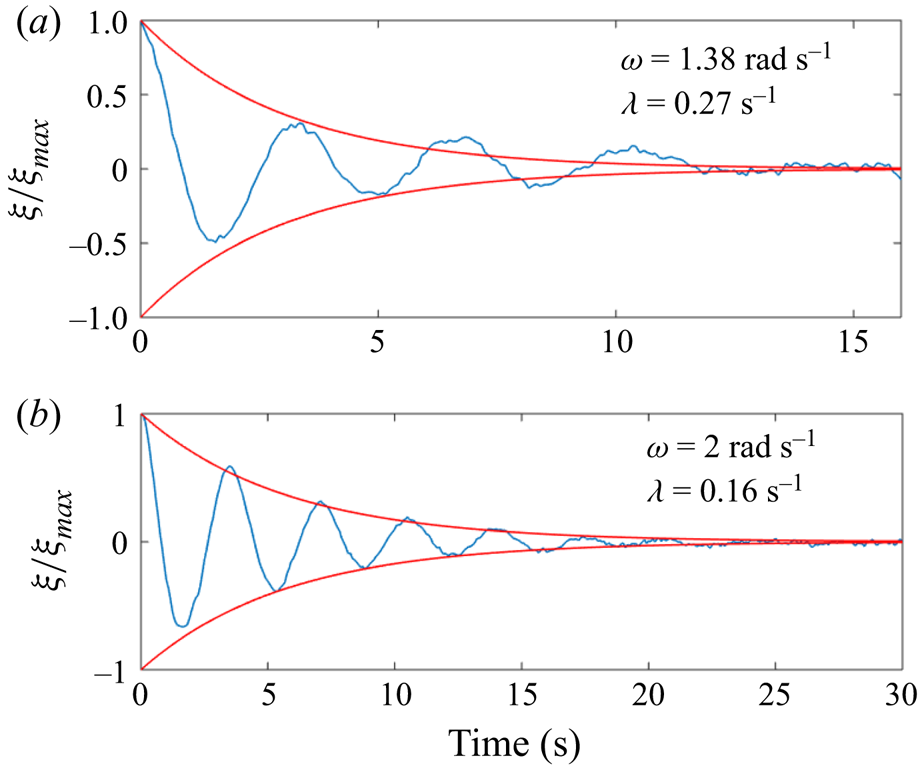
 $\lambda$ from a best fit of the temporal evolutions. Figure 4 shows two examples of the damped oscillations of the ludion when the forcing is stopped. Note that contrary to the power-law decaying oscillations observed by Biró et al. (Reference Biró, Gábor Szabó, Gyüre, Jánosi and Tél2008), an exponential damping law properly fits our experimental data at least on the rather limited number of periods of oscillation that we measured.
Transient vertical oscillations of the ludion when the forcing is stopped ( $N = 1.6$ rad s
 $^{-1}$). A linear fit of the logarithm of
 $\xi /\xi _{max}$, leads to the measurement of the damping coefficient. Here (a)
 $\lambda = 0.27$ s
 $^{-1}$ when frequency
 $\omega = 1.38$ rad s
 $^{-1}$ and (b)
 $\lambda = 0.16$ s
 $^{-1}$ when frequency
 $\omega =2$ rad s
 $^{-1}$.

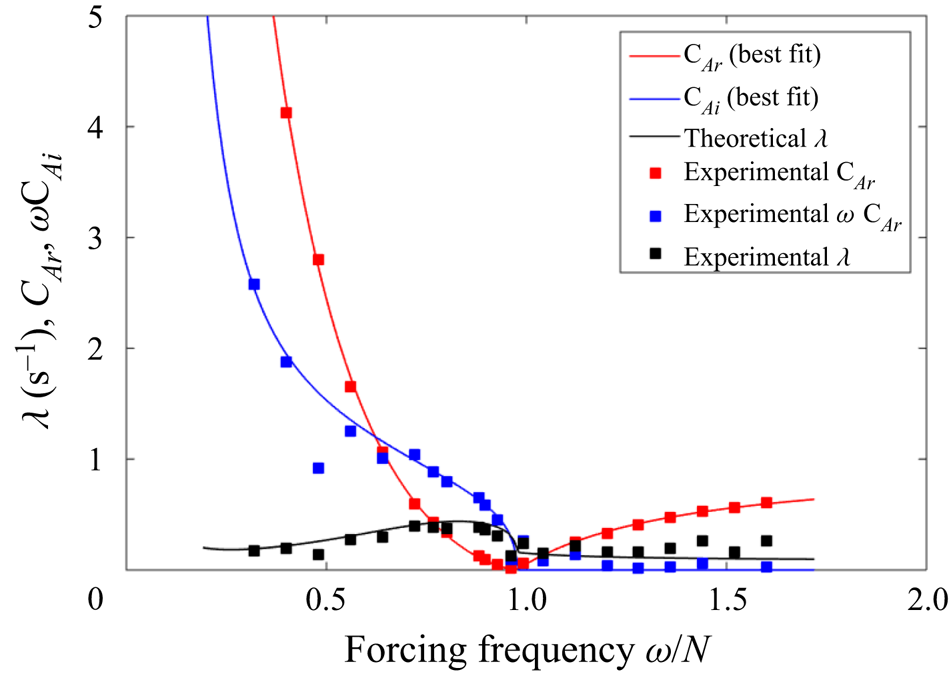
We performed this analysis for the whole range of forcing frequencies. Figure 5 shows the evolution of  $\lambda$ as a function of
 $\omega$. In particular, we recover the typical shape of the damping coefficient evolution with its modification by the emission of gravity waves as it is calculated theoretically (see Lai & Lee Reference Lai and Lee1981; Ermanyuk & Gavrilov Reference Ermanyuk and Gavrilov2003; Voisin Reference Voisin2007). We clearly see that when
 $\omega$ is larger than
 $N$, the damping is only due to the viscous effects with a typical frequency estimated around
 ${\mu }/{M} = 0.16\,\textrm {s}^{-1}$ that permits us to recover
 $\omega C_{Ai} = 0$ when
 $\omega$ is larger than
 $N$. From this experimental data, and using the formulae given by Ermanyuk (Reference Ermanyuk2000), we can explicitly write the added mass and friction coefficients as
 $$\begin{gather} C_{Ar}= \left\|{\frac{N^2 - \omega_0^2}{\omega^2+\lambda^2} -1}\right\|, \end{gather}$$
 $$\begin{gather}\omega C_{Ai} = 2\lambda \frac{N^2 - \omega_0^2}{\omega^2+\lambda^2} - \frac{\mu}{M}. \end{gather}$$
Evolution of the damping mass and friction coefficients with the reduced forcing frequency  $\omega /N$. First the typical time scale of the damping is extracted from the exponential fits of the transients (black squares). Then, using the formula explicitly derived by Ermanyuk (Reference Ermanyuk2000), we can calculate the real part
 $C_{Ar}$ and the imaginary part
 $\omega C_{Ai}$ of the complex added mass. The solid curves are then heuristic interpolations calculated from a modified analytical formula given by Voisin (Reference Voisin2007) for an oscillating sphere (see Appendix A).

The experimental values of  $C_{Ar}$ and
 $\omega C_{Ai}$ are computed and plotted in figure 5. It is remarkable that these experimental data points possess the same trends obtained by the theoretical calculations of Lai & Lee (Reference Lai and Lee1981), Ermanyuk & Gavrilov (Reference Ermanyuk and Gavrilov2003) and Voisin (Reference Voisin2007) for spheres and horizontal cylinders. Therefore, we were able to interpolate them by modifying the analytical expressions obtained by Voisin (Reference Voisin2007) for a vertically oscillating sphere (see Appendix A). In particular, we observe that
 $C_{Ar}$ possesses a finite asymptotic value when
 $\omega$ increases above
 $N$, in accordance with the classical observations made on spheres or cylinders for which
 $C_{Ar}$ approaches the values
 $1/2$ and
 $1$, respectively, for spheres and cylinders oscillating in non-stratified fluids, which is equivalent to fast oscillations in a stratified fluid layer. We also recover the known property that added mass and friction coefficients are zero when
 $\omega =N$, reflecting the resonance proximity where the fluid moves in phase with the ludion, thus exerting no additional force on it. On the contrary, when
 $\omega$ tends to zero, the added mass coefficient seems to diverge: fortunately the acceleration of the ludion decreases too, making the added inertial term finite. These interpolating curves are then used to recalculate the friction coefficient
 $\lambda$ (called ‘analytical
 $\lambda$’ in figure 5) to be used in the oscillator model in order to reproduce the resonant response of the ludion. Note that this operation is not an adjustment procedure to obtain a best fit of the resonant curve, but rather an interpolation method to give to the theoretical model some realistic input functions describing properly the underlying physics. The fact that our measures of
 $\lambda$,
 $C_{Ar}$ and
 $\omega C_{Ai}$ are close to the theoretically expected trends is a proof of the consistency of our analysis. Then, using these analytical expressions and values of
 $\lambda$,
 $C_{Ar}$ and
 $\omega C_{Ai}$, the prediction of the model (red line) – i.e. the analytical expression of the harmonic oscillator resonance – gives without any free coefficients a satisfactory prediction of the experimental resonance curve as can be observed in figure 3. In particular, the slight deviation of the resonant frequency versus the Brunt–Väisälä frequency
 $N$ is visible. Note also the presence of a ‘shoulder’ on the left-hand wing of the resonant curve, which is reminiscent of the increase of the power loss by the radiation of internal gravity waves.
5. A gravity wave generator
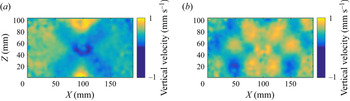
When the forcing frequency is less than the Brunt–Väisälä frequency, internal waves accompany the diver in its oscillations. Seeding the salt water with micrometre-sized particles, it is possible to measure the fluid motions around the ludion using PIV (Thielicke & Stamhuis Reference Thielicke and Stamhuis2014). Figure 6(a) shows in colour the vertical velocity field in a vertical plane. A typical Saint Andrew's cross is clearly visible for a forcing frequency  $\omega$ equal to 1.38 rad s
 $^{-1}$ some 30 periods after the oscillations started. However, as shown in figure 6(b), multireflections of the gravity waves on the lateral walls and on the density gradients at the bottom and top homogeneous layer frontiers make the wave pattern to look like a chessboard pattern reminiscent of an underlying eigenmode. In the present case, the eigenfrequency of mode (
 $n_x = 4,\ n_y = 1,\ n_z = 2$) where
 $n_j$ is the number of wavelengths in direction
 $j$, is also equal to 1.38 rad s
 $^{-1}$. Note, however, that this correspondence is obviously frequency dependant and does not occur in general. Moreover, we did not find at this point of our experimental work any correlation between the amplitude of the vertical oscillations as described in § 4 and the possible excitation of a global eigenmode in the container.
(a) The Saint Andrew's cross of the internal gravity waves emitted by the ludion measured in a vertical plane by PIV (forcing frequency  $\omega = 1.38$ and
 $N = 1.6$ rad s
 $^{-1}$) 30 periods after the beginning of the oscillation (Vertical velocity field). (b) The chessboard pattern after multireflections have occurred, approximately 10 periods of oscillation later.

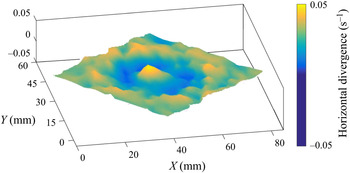
As it is well known, the arms of the Saint Andrew's cross are wave conical isophase surfaces. These cones can be observed in horizontal planes as presented by the horizontal divergence of the velocity field in figure 7 measured 1 cm above the highest position of the ludion.
The horizontal divergence of the velocity field in a horizontal plane 1 cm above the ludion (forcing frequency  $\omega =1.26$ and
 $N = 1.6$ rad s
 $^{-1}$). The target pattern is centred on the ludion horizontal position.

6. The diver can also swim
As visible on the right-hand column plots of figure 2, in some of the experiments we have observed that the ludion moves or swims along the permitted horizontal axis  $X$. We recall that in the other direction, the ludion is confined between two vertical walls distant of 6 cm. To describe these motions, we have detected the maximum displacements of the ludion along the horizontal axis during the recording time of the run. Then we calculated the corresponding mean velocity represented by the slope of the red lines in figure 2. We have analysed two sets of experiments with different density stratifications leading, respectively, to
 $N= 1.6$ and
 $N=2.3$ rad s
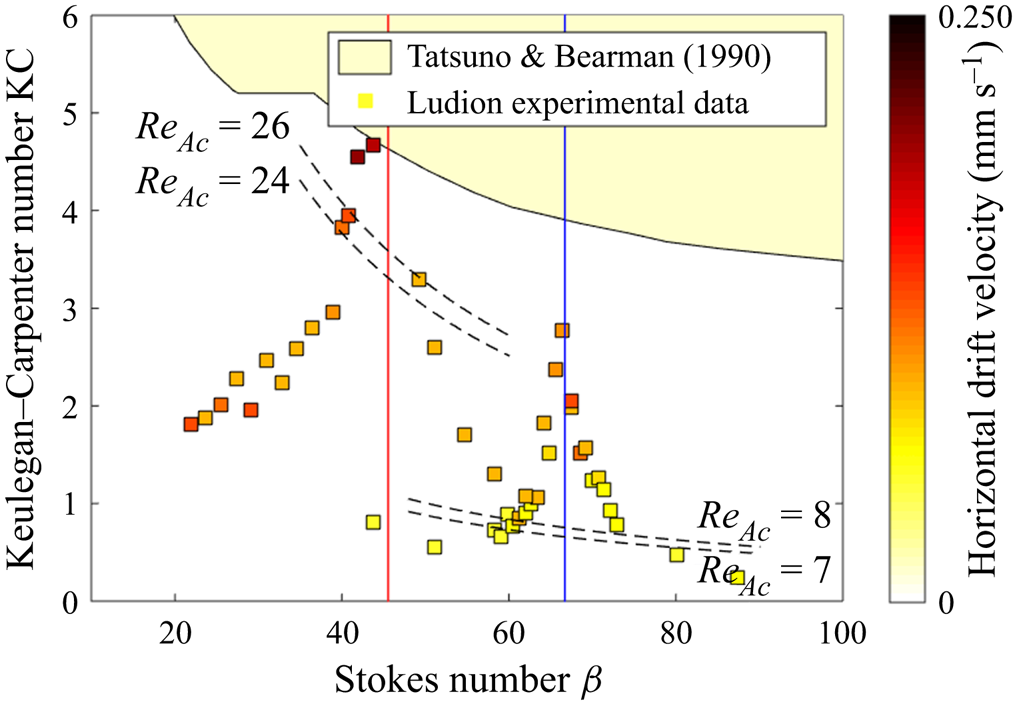
 $^{-1}$. As already noted in the introduction, this kind of horizontal locomotion associated with a vertically oscillating body has already been observed, in particular for the vertically flapping wing of Vandenberghe et al. (Reference Vandenberghe, Zhang and Childress2004), or more recently for the oscillating spheroids simulated by Deng & Caulfield (Reference Deng and Caulfield2018) where it is demonstrated that this horizontal propulsion is directly linked to a symmetry breaking in the vortical flow pattern generated at each oscillation. These last studies follow in fact the seminal experimental work of Tatsuno & Bearman (Reference Tatsuno and Bearman1990) on the flow generated by horizontal oscillations of a cylinder in a homogeneous fluid. Tatsuno & Bearman (Reference Tatsuno and Bearman1990) produced a classification of the different flows they observed as a function of two non-dimensional parameters: the Keulegan–Carpenter number
 $KC = 2{\rm \pi} A/D$ and the Stokes number
 $\beta = \omega D^2 / 2{\rm \pi} \nu$, where
 $\nu$ is the kinematic viscosity of water. In particular, these authors determined a transition between symmetric and asymmetric flows (called Regime
 $D$ in their article). It is this critical threshold that Deng & Caulfield (Reference Deng and Caulfield2018) as well as other authors refer to as the transition towards propulsion. Therefore, even if the ludion is a small vertical cylinder (and not a sphere), and even if all of these previously cited experiments and calculations were realized in non-stratified fluids, we will also refer to the curve of Tatsuno & Bearman (Reference Tatsuno and Bearman1990) in the following. Note, moreover, that in the case of stratified fluids, the oscillating body is always attached in one way or another to an oscillating device. This is the case for instance for the experiments of Lin, Boyer & Fernando (Reference Lin, Boyer and Fernando1994) where a classification diagram is also presented in the (
 $KC$,
 $\beta$) plane for a Froude number larger than
 $0.20$ and compared with the results of Tatsuno & Bearman (Reference Tatsuno and Bearman1990). In particular, a critical threshold is found above which internal gravity waves are emitted by the periodic oscillations of a sphere. The generation of internal gravity waves by oscillating bodies in stratified fluids (see for instance Flynn, Onu & Sutherland (Reference Flynn, Onu and Sutherland2003)) has of course a long standing history starting from the description of the ‘herring bone’ pattern by Mowbray & Rarity (Reference Mowbray and Rarity1967) and Stevenson (Reference Stevenson1969). More recently, Chashechkin & Prikhod'ko (Reference Chashechkin and Prikhod'ko2007) have also documented the flow patterns (cumulative jets and wave beams) around oscillating spheres and their singular features using a schlieren technique.
Using the non-dimensional parameters  $KC$ and
 $\beta$ as defined above, we plot in figure 8 the resonant curves for both Brunt–Väisälä frequencies
 $N= 1.6$ and
 $N= 2.3$ rad s
 $^{-1}$. In both cases, the Froude number defined as
 $Fr= \omega A / N D$ stays between
 $0.05$ and
 $1$. In this figure, the data points are coloured following the intensity of the horizontal velocity experienced by the ludion. As can be observed, the more intense vertical displacements lead to larger horizontal velocities. We have also represented with dotted lines the estimated thresholds for the apparition of horizontal excursions. By defining a flapping Reynolds number
 $Re_A = \beta KC/2{\rm \pi}$ we can describe the transition between oscillations with and without horizontal motions. We observe in figure 8 that these thresholds are lower than the one detected by Tatsuno & Bearman (Reference Tatsuno and Bearman1990). Therefore, we can conclude that density stratified flows associated with vertical oscillations of a body seem to be more sensitive to flow symmetry breaking and, as a consequence, to horizontal propulsion.
The resonant curves in the ( $\beta, KC$) plane for both
 $N=1.6$ rad s
 $^{-1}$ (red vertical line) and
 $N=2.3$ rad s
 $^{-1}$ (blue vertical line). The colours of the data points are functions of the horizontal velocity as given in the colourbar. Dashed lines refer to instability thresholds given by constant values of flapping Reynolds numbers determined on the bifurcation diagrams of figure 9.

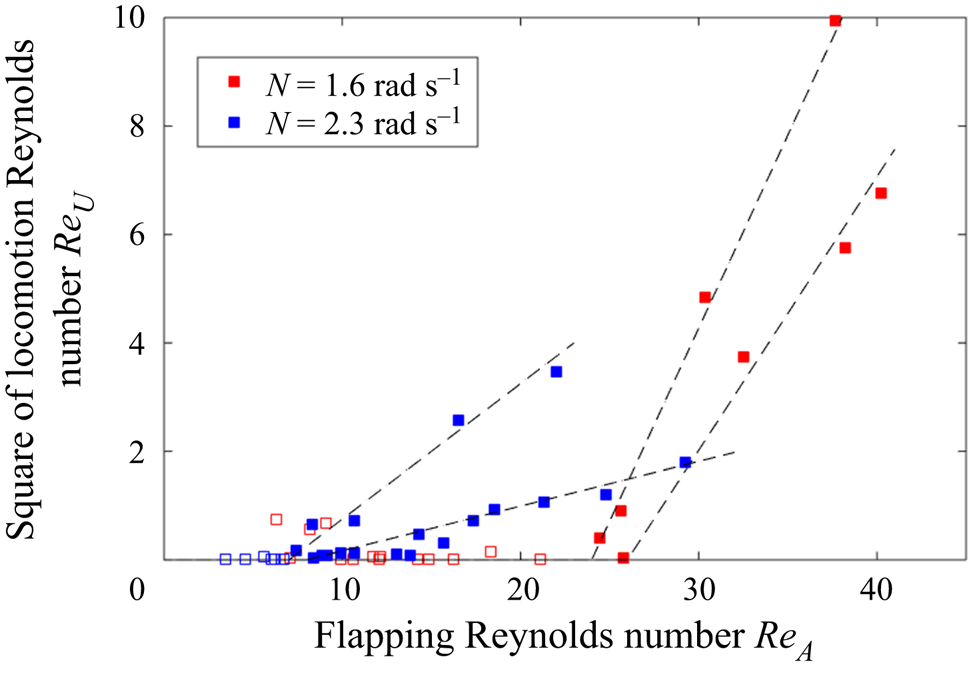
To compare with the numerical observations of Deng & Caulfield (Reference Deng and Caulfield2018), we have calculated for each experiment the locomotion Reynolds number  $Re_U = V_H D /\nu$. As described in figure 9, in both cases we observe pitchfork supercritical bifurcations with the amplitude of the horizontal velocity
 $V_H$ (proportional to the locomotion Reynolds number) varying as the square root of the distance to thresholds. Using the accuracy of our spatial detection (
 $\pm$0.1 mm) at a rate of 60 Hz, we estimate the maximum relative error on these Reynolds numbers of the order of
 $10^{-2}$, i.e. less than a unit at the considered Reynolds numbers and thus not plotted on figure 9. A particular feature of our study is the observation for both sets of experiments of two bifurcated branches having slightly different threshold values. These branches seem not to be correlated with the left-hand or right-hand wing of the resonant curves and might correspond to different flow symmetries as described in Deng et al. (Reference Deng, Xue, Mao and Caulfield2017). Note also that if the critical flapping Reynolds numbers that we observe have similar values to those for the oscillating spheroids of Deng & Caulfield (Reference Deng and Caulfield2018), the locomotion Reynolds numbers are several orders of magnitude lower in our case, revealing the poor efficiency of our swimmer due to the high drag of the ludion's vertical cylindrical shape moving along a horizontal trajectory – a feature that was obviously not optimized in our study.
Pitchfork bifurcations towards horizontal motions of the ludion. We observe the different branches that bifurcate at different threshold values. Here the horizontal velocities have been converted into locomotion Reynolds numbers. For each experiment, two bifurcated branches are observed (solid symbols).

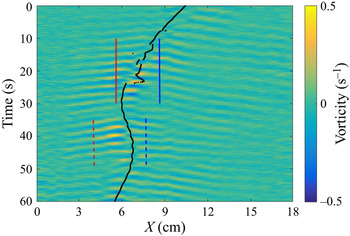
To characterize the interaction between the ludion and the internal gravity waves it emits, we calculate the space–time diagram along a horizontal line located just above the diver using the PIV vorticity fields in the plane  $(X, Z)$. Figure 10 presents this diagram where the propagation of the waves is visible on each side of the trajectory which is, as expected, the source of the waves. On the figure, we have also reported in black the trajectory of the ludion as determined by the tracking study presented in § 4. Except from limited local defects which are due to spurious laser reflections on the glass cylinder and thus a poor position determination by our tracking algorithm for these particular times, the correspondence between the detected trajectory and the trace of the ludion on the PIV map is good. As is expected from a wave emitter moving at a given velocity, the frequency of the gravity waves should be shifted by a Doppler shift given by the product
 $k_xV_H$, where
 $k_x$ is the wavenumber of the gravity waves in the
 $X$ direction and
 $V_H$ the horizontal instantaneous locomotion velocity of the ludion. On the same figure, we have also drawn four lines on each side of the trajectory. Between the solid red and blue lines the ludion swims towards the left, whereas between the dashed red and blue line it swims towards the right. The velocity
 $V_H$ between the solid lines is equal to approximately 0.8 mm s
 $^{-1}$. Note that this instantaneous velocity is larger than the mean velocity (equal to 0.23 mm s
 $^{-1}$) calculated on a longer period of time and reported in figure 8. The wavelength of the gravity waves can also be estimated in figure 10 around 40 mm. This value corresponds to a wavenumber equal to
 $k_x=0.157$ rad mm
 $^{-1}$. These values give then a Doppler shift equal to 0.12 rad s
 $^{-1}$.
Space–time diagram of the PIV vorticity field together with the ludion trajectory as calculated by our tracking software (black line). Four lines are drawn ahead or behind the ludion, along which the Fourier spectra of the vorticity fields are calculated and presented in figure 11.

To check this prediction, we calculate the Fourier spectra of the vorticity along the four lines of figure 10. They are represented on figure 11 keeping for each spectrum the colour and line styles identical to those of figure 10. As can be observed, the angular frequency of the waves emitted ahead of the trajectory (and crossing the red solid line and the blue dashed line) are slightly larger than the frequency of the waves emitted behind (and crossing the red dash line and the blue solid line). As can be checked on figure 11, the separation between the maxima of the spectra is equal to 0.23 rad s $^{-1}$, leading to a shift of
 $\pm$0.12 rad s
 $^{-1}$ between the wave angular frequencies and the forcing frequency
 $\omega$, validating as expected the presence of a Doppler shift. Note, moreover, that associated with this frequency shift there is also a slight increase of the wave amplitude behind the ludion. We have at this stage of the study no interpretation of this effect.
Fourier spectra of the vorticity field along the lines drawn in figure 10. As can be observed, the angular frequency of the gravity waves ahead of the ludion is higher that of the waves behind, as expected by a Doppler shift. In this example,  $\omega = 1.50$ and
 $N = 1.60$ rad s
 $^{-1}$.

7. Conclusions and perspectives
This work is the first step of the study of the swimming of a vertically oscillating but free – in the horizontal plane – neutrally buoyant body (the ludion) in a density stratified fluid. All of the presented experiments were performed in a rectangular but narrow container in order to constrain the horizontal displacements in a single direction. We have been able to measure and model the resonance of the ludion taking into account the added mass and added friction terms in the equation of motion. We have also shown that the Basset (or memory) term can be incorporated in the added coefficients because the motion is harmonic and supposed to last for a sufficiently long time. In particular, we have measured the damping rate of the ludion oscillations during transients. As expected, the radiation of internal gravity waves increases the energy loss and thus the damping term. This emission of these gravity waves for forcing frequencies less than the Brunt–Väisälä frequency has been characterized by PIV measurements. Then a bifurcation towards locomotion (the swimming) is observed above a critical flapping Reynolds number measured at values lower than what was expected from previous works performed in homogeneous fluids. Finally, we showed that this swimming of the ludion is accompanied by a Doppler shift of the wave frequency.
Our experiments on the swimming of the ludion in a stratified fluid are of course reminiscent of the drops that bounce on the free surface of a vibrating liquid (Couder et al. Reference Couder, Protière, Fort and Boudaoud2005; Bush Reference Bush2015). Some differences between the bouncing drops and our system should, however, be pointed out. First, the ludion experiences a forced resonance and as a consequence its oscillation is not the result of a parametric instability as is the case for the drops bouncing on a subcritical wave pattern of a Faraday instability. However, this difference should not be so crucial as the surface waves are in fact also locally forced by the bouncing droplets in the same way the ludion forces the internal gravity waves. Moreover, in our system (and also in the case of the capillary surfers of Ho et al. (Reference Ho, Pucci, Oza and Harris2021)), the waves are continuously emitted and interacting with the body, which is not the case for the drops as they leave the fluid surface. However, it appears that in our case the threshold to locomotion is not caused by the waves as we observed horizontal displacements even when the forcing frequency is higher than the Brunt–Väisälä frequency. This is different from the walkers which start to move because of the presence of their waves. Another important difference with Couder walkers is the propagating nature of the internal gravity waves emitted by the ludion, whereas the Faraday surface waves induced by the bouncing drops are stationary in a frame linked to the drops. Even if not the cause of swimming, the gravity waves should interact with the ludion through the surface integral of the pressure they exert on it. One of the results of the waves’ effect on the ludion motions is the presence of some added mass and added friction terms evidenced in the equation of motion and that we characterized through our experimental measurements. As it is the case for the bouncing drops, history or memory terms exist but we were not able to evaluate them as we cannot disentangle them from the added mass and friction terms. We have, moreover, highlighted the presence of a Doppler shift on the gravity wave frequency as they are emitted by a moving source. This will cause phase shifts between the waves emitted by the front and by the rear sides of the diver, inducing pressure differentials and horizontal forces that in their turn should modify the ludion motions. The feedback loop, between the swimming of the ludion and the wave pattern it emits, is certainly quite subtle.
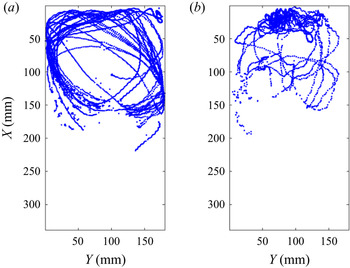
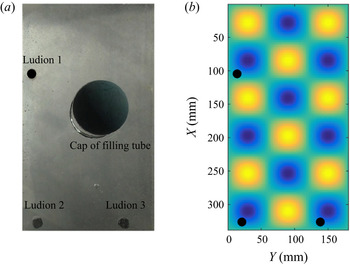
To open perspectives on these works, we present in figure 12 two trajectories of the ludion in a horizontal plane of a larger container, and using the same experimental procedure as that described above for the experiments in the narrow container. In these two examples, two ludions were immersed at different depths in the layer and we could record from the top, long temporal series of swimming. In both cases, the ludion moves along trajectories confined on one half of the container. In the first case, the trajectory winds up along elliptic loops whereas in the second case the ludion describes loops close to trefoils (Perrard et al. Reference Perrard, Labousse, Miskin, Fort and Couder2014) before slowing down, attracted to a motionless position. In fact, it happened quite often during these first experiments in an extended geometry, that the ludion was attracted by some fixed locations and stayed motionless at one of them. These locations may correspond to suitable spatial positions inside an underlying eigenmode, proving in a sense that the internal gravity waves can indeed interact with the ludion and may drive some of its behaviours. This is the case for instance in the experiments presented in figure 13(a) where after the introduction of three divers in the stratified layer, they were all of them attracted to three places that, as can be observed in figure 13(b), seem to correspond to trapped locations in an underlying eigenmode that possesses an eigenfrequency very close to the forcing frequency. This particle trapping is similar to what happens in the walker system where the bouncing drops are attracted and pinned in a periodic wave pattern (Sungar et al. Reference Sungar, Tambasco, Pucci, Sáenz and Bush2017). Note that an important constraint in respect for this pinning is the identical phase difference between each ludion and the mode itself as the three divers are locked at the same phase difference to the forced pressure oscillations. As a consequence, there are quantized separations (i.e. integer numbers of half-wavelengths in both directions) between the ludions that freely move to the locked positions in the horizontal plane. This is of course reminiscent of the recent experiments by Ramananarivo et al. (Reference Ramananarivo, Fang, Oza, Zhang and Ristroph2016) on a pair of flapping wings in tandem. In this case, the flying wings are observed to move naturally to some positions separated by an integer number of wavelengths of the periodic vortex pattern of the wing wake. The same situation is also encountered with capillary surfers (Ho et al. Reference Ho, Pucci, Oza and Harris2021) where two self-propelled particles floating in a vibrating bath can travel together, separated by an integer number of capillary wavelengths. This remarkable observation also opens up new perspectives for the possible use of our experimental set-up to study the crystalline arrangements of groups of self-propelled bodies (the so-called active matter) as often encountered in flocks of birds and schools of fish.
Two examples of trajectories of the ludion in a larger container for  $N = 1.29$ rad s
 $^{-1}$ (a) nearly 2 h recording with
 $\omega = 1.23$ rad s
 $^{-1}$ and (b) 3/4 hour recording at
 $\omega = 1.20$ rad s
 $^{-1}$.

An example where three ludions were introduced in the experimental set-up. (a) A top view of the container where after a transient the three ludions were trapped, motionless, in the horizontal plane. These oscillate vertically in phase as they are forced with the pressure oscillation with  $\omega = 2.136$ and
 $N = 2.19$ rad s
 $^{-1}$. (b) Superimposed on the three ludions positions, the eigenmode at a frequency equal to 2.135 rad s
 $^{-1}$ with half a wavelength in the vertical direction, three in the
 $Y$ direction and six in the
 $X$ direction.

Therefore, and even if at this stage of our study it is not yet possible to precisely quantify the effect of the internal gravity waves on the motions and trajectories of the ludion, our observations encourage us to continue the search for possible hydrodynamics analogies with undulatory mechanics, in the quest for a new fluid mechanics example of a wave–particle duality as already beautifully observed and explored by Couder et al. (Reference Couder, Protière, Fort and Boudaoud2005), Perrard et al. (Reference Perrard, Labousse, Miskin, Fort and Couder2014) and Bush (Reference Bush2015) for the Couder walkers.
Acknowledgements
We thank B. Favier, G. Verhille, B. Voisin and S. Perrard for fruitful discussions during the course of this study.
Funding
This research was financed by DGAPA-UNAM, under contract PAPIIT IN-114218 ‘Vorticidad y ondas (internas y de superficie) en dinámica de fluidos’ and IRPHE of Aix Marseille University.
Declaration of interests
The authors report no conflict of interest.
Appendix A
A.1. Density profile measurements
Figure 14 presents an example of the density profile measurements performed by translating the inlet of our Anton Paar MD 35 densimeter along the vertical direction inside the experimental chamber. The density is measured every 2 cm and as can be seen in the figure, the profiles before and after the experimentations collapse nicely on a single curve permitting us to determine by least squares interpolation, and outside the top and bottom layers, the constant Brunt–Väisälä frequency of the fluid layer. This plot shows that no mixing occurs by the density measurements themselves, neither by the introduction of the ludion nor even by performing several dozens of runs, to describe the resonance curve as presented in § 4.
Density profile measurements before the introduction of the ludion in the stratified water layer and after the experimentation for  $N = 1.60$ rad s
 $^{-1}$. The collapse within a few per cent of the two data sets shows that no mixing occurs in the container.

A.2. Interpolation of the measured complex added mass coefficients
Figure 5 presents the evolution with the forcing frequency of the experimental values of  $C_{Ar}$ and
 $\omega C_{Ai}$ that are calculated from the experimental values of
 $\omega$ and
 $\lambda$. As can be checked on the theoretical calculations of Lai & Lee (Reference Lai and Lee1981), Ermanyuk & Gavrilov (Reference Ermanyuk and Gavrilov2003) and Voisin (Reference Voisin2007), the general trends of these variations are largely recovered. In these articles, it is shown in particular that
 $C_{Ar}$ and
 $\omega C_{Ai}$ depend on the aspect ratio of the considered oscillating body. As the ludion is a finite-size cylinder that oscillates vertically along its axis – a case never considered theoretically – we will modify the analytical expressions derived for the sphere by Voisin (Reference Voisin2007) in order to interpolate our experimental data points. These functions will then be used to calculate the ‘analytical
 $\lambda$’ of figure 5 necessary to compute the resonant curve using the classical analytical expression of the harmonic oscillator resonance. The complex added mass coefficient
 $C_z$ for a sphere oscillating vertically at frequency
 $\omega$ in a stratified fluid of Brunt–Väisälä frequency
 $N$ is (Voisin Reference Voisin2007)
 \begin{equation} C_z(\omega /N)=\left(1-\frac{N^2}{\omega^2}\right) \frac{B(\omega /N)}{1-B(\omega /N)}, \end{equation}
with
 \begin{equation} B(\omega /N)=(\omega^2 /N^2) \left[1-\left(1-\frac{N^2}{\omega^2}\right)^{1/2} \arcsin(N/\omega)\right]. \end{equation}
We will then defined heuristically the real and imaginary parts of  $C_A$ by
(i)
 $C_{Ar} = 10\, \textrm {Re}(C_z)^{1.4}$ and $C_{Ai} = 1.44\,\textrm {Im}(C_z)^{0.6}+ 0.22(\omega /N)^{-2.4}- 0.16$, if $\omega \leq N$;
(ii)
$C_{Ar} = 3.8\,\textrm {Re}(C_z)^{2.1}$ and $C_{Ai} = \textrm {Im}(C_z)$, if $\omega \geq N$,


where the different coefficients have been determined by best fit trial and error method. These analytical expressions are then used in the ludion oscillator model.