Almost 50 years after its onset, the nationwide scope of the upheaval known as the Chinese Cultural Revolution remains obscure. In the relatively open atmosphere of the early post-Mao era, dramatic exposés of collective violence, private jails, torture, executions, and even mass killings were regularly published. As part of an early 1980s campaign to “thoroughly repudiate the Cultural Revolution,” frank accounts of violence and persecution, often accompanied by numbers, were published as short newspaper accounts and longer articles in journals on party history (Schoenhals Reference Schoenhals, Karlsson and Schoenhals2008: 81–87). This openness ended after China's political crisis of 1989, when the subject became more sensitive and publication was heavily restricted. The much richer body of materials available in the post-Mao era nonetheless has supported new research outside China (Esherick et al. Reference Esherick, Pickowicz, Walder, Esherick, Pickowicz and Walder2006): narrative accounts of the period and of Mao's role (MacFarquhar and Schoenhals Reference MacFarquhar and Schoenhals2006), of conflict in provincial capitals (Bu Weihua 2008; Dong and Walder Reference Walder2010, Reference Su2011, Reference Walder2012; Forster Reference Forster1990; Wang Reference Wang1995), and of the politics of key insurgent groups (Perry and Li Reference Perry and Xun1997; Walder Reference Walder2009).
All of the recent studies focus on large cities and institutions that were at the epicenter of national politics, and on the students and workers who participated actively in the urban insurgencies. The true scope of the upheaval at the national level remains obscure. Early publications concluded that the Cultural Revolution was primarily an urban phenomenon (Baum Reference Baum and Robinson1971). Work based on post-Mao sources suggests an extensive rural impact, though delayed (Walder and Su Reference Walder and Su2003). Publications based on Mao-era sources described insurgencies with scant reference to violence, while post-Mao accounts emphasized violent persecutions that included beatings, torture, and even mass killings (Su Reference Su, Esh-erick, Pickowicz and Walder2006, Reference Su2011; Walder Reference Walder2009; Walder and Su Reference Walder and Su2003). Early studies considered the Cultural Revolution to have ended in 1968, with the imposition of martial law, and ended their accounts then (Lee Reference Lee1978; Rosen Reference Rosen1982; Walder Reference Walder1978). Yet post-Mao sources made clear that severe state-directed terror began with the imposition of martial law (MacFarquhar and Schoenhals Reference MacFarquhar and Schoenhals2006; Walder and Su Reference Walder and Su2003).
While correcting earlier misconceptions, the new sources have only deepened questions about the temporal and geographic scope of these political activities and their human costs. How destructive was the mass insurgency on a national scale, and how severe were the persecutions that followed its suppression? How does the scale of persecution in the Cultural Revolution compare with the Soviet “Great Terror” of the 1930s or other notorious political episodes during the twentieth century? Decades after these events, we are still limited to describing persecutions in detail and providing partial statistics for selected provinces (Margolin Reference Margolin, Courtois, Werth, Panné, Paczkowski, Bartošek and Margolin1999: 526–42).
Beyond these uncertainties about the scope and impact of these conflicts are questions about their political character. One enduring image of the Cultural Revolution, indeed one of its distinctive features, was a mass insurgency that targeted party officials, intellectuals, school officials, and individuals from “reactionary” households. Harrowing accounts of victims subjected to brutal and humiliating public “struggle sessions,” beatings, torture, and killings at the hands of student and worker militants fill post-Mao accounts and memoirs (Thurston Reference Thurston1987; Wang Reference Wang2001). A second image is one of armed battles between mass factions that fought for territory and control of government offices and enterprises, sometimes summarily executing rivals after their surrender. The summer of 1967 has been described as a state of civil war in a country where civilian rule had disappeared and military control had yet to be enforced (Dong and Walder Reference Walder2011; Schoenhals Reference Schoenhals2005). A third image is of a nationwide campaign of organized terror, carried out in the guise of “Cleansing the Class Ranks” under the direction of revolutionary committees established under martial law. These campaigns decimated insurgent forces, but expanded to target all who were suspect because of their class origins, political histories, or foreign ties (MacFarquhar and Schoenhals Reference MacFarquhar and Schoenhals2006: 253–62).
These three images of the Cultural Revolution are very different forms of political activity, and the prevalence and relative impact of each during this period shapes our historical understanding of the period. To what extent should it be understood as a popular insurgency, as warfare between armed mass factions, or as a broad-gauged campaign of state-directed terror and repression? How extensive, and how damaging, were the three different facets of Cultural Revolution politics that I have just described?
Local Annals as a Source of Systematic Data
I draw on an underexploited source of information to address these questions. The impulse to expose the abuses of the Cultural Revolution may have subsided after China's political upheaval of 1989, but some of the material from post-Mao investigations subsequently found their way into local annals published as part of a coordinated effort to document the history and accomplishments of the People's Republic. Local annals (difang zhi) revive a historical tradition from China's imperial past. The imperial versions were chronicles of local history, surveys of the local economy and society, and biographies of imperial degree holders, prominent families, and other local notables. Surviving annals from the last two dynasties, the Ming and Qing, have served as sources of systematic evidence about patterns of popular protest and collective violence (Rowe Reference Rowe2007; Tong Reference Tong1991). Some local annals were compiled in the Nationalist era, but the effort was severely limited by warlord politics, foreign invasion, and civil war. The publication of local annals finally resumed in the mid-1980s.
A two-decade effort to collect relevant accounts from these publications ended in 2010 with a near-complete collection of published annals for 2,213 cities and counties.Footnote 1 The first new annals were published in the mid-1980s; half of them were published by 1994, and more than 90 percent by 2001. Relevant pages from the original publications were photocopied and filed for subsequent use. Information from the annals was coded into a database of events for the period from June 1966 to December 1971.
Local annals in a typical rural county contain around 500 pages of closely printed material in one volume, with scores of statistical tables on a variety of subjects. Annals for medium-sized cities are often published in several volumes and well more than 1,000 pages; large cities and provincial capitals publish annals that can fill more than a dozen volumes. In contrast, annals published in poorer and more remote counties are often much less elaborate, with only a few hundred pages of large type, limited statistical material, and sketchy coverage of local histories. All annals cover roughly the same range of subjects. Their publication was coordinated at the province level: annals follow a relatively standard format within provinces (subject headings, order of presentation, and coverage devoted to different topics). Information about local political events is located under a variety of headings. The most common is the “chronicle of major events” (dashiji), a factual chronology organized by date, included in virtually all publications (only 17 local annals did not contain one). These chronologies typically begin with the earliest recorded history of the jurisdiction, but they provide the most detail on the period after 1949. Additional information is frequently found in other sections, usually under the headings “Communist Party of China,” “Political Affairs,” or “Major Political Campaigns.” These separate sections frequently include statistics that are the result of internal investigation reports conducted shortly after Mao's death; many include detailed historical narratives of local political events during the period of interest.
The Database
The jurisdictions in our database do not correspond completely to those in existence in 1966; we have reconciled boundary changes to ensure that there are no gaps in coverage or double counting.Footnote 2 Some of the jurisdictions in existence in 1966 were merged with others, split in two, or renamed. These boundary changes were reconciled by examining materials in the annals and tracing the history of boundary changes in the national register of jurisdictions (Ministry of Civil Affairs 1998). The resulting data set of 2,213 jurisdictions includes all cities (84 prefecture level and 89 county level) and 2,040 out of 2,050 county-level jurisdictions (counties, Mongolian banners, and special districts). Background data on each jurisdiction was gathered from other sections of the local annals or from statistical yearbooks. Valid data for the mid-to-late 1960s were located for almost all jurisdictions for total population, urban population, ethnic Han Chinese population, number of nonagricultural employees, number of party members, and number of government officials.Footnote 3
Teams of trained coders read the photocopied accounts and were instructed to record two kinds of information. The first was summary data on the number of “casualties” that resulted from political activities during this period—the number of “unnatural” deaths and the number of other “victims” (various forms of political persecution that included imprisonment, public beatings, expulsion from homes, and charges of counterrevolutionary activity). Rules for counting casualties were conservative. Coders were instructed to record a value of zero unless a specific number was mentioned in the text, even if there were repeated references to widespread casualties without mention of specific numbers. Two teams of researchers coded these figures separately; numbers that did not match (roughly one-third after the first coding) were checked against the original sources and reconciled. The second kind of information was about specific events—their type, the date of their occurrence (month, year, and, if available, day), and number of deaths, injuries, or victims that were generated by that event.
To supplement the statistical materials in local histories we applied the same coding rules to data that we obtained from other sources for 103 jurisdictions (4.7 percent of the total). For 86 of these jurisdictions, the materials are detailed internal party investigation reports for every city and county in Guangxi. The materials for the remaining 17 jurisdictions in 10 provinces are a mixture of unpublished draft chronologies, published provincial annals that contained data about counties or cities, published histories of local communist parties, or other accounts that draw on internal archival materials. These materials provide more statistical detail than published annals, permitting us to evaluate the completeness of published data.
Despite our restrictive coding rules and the lack of detail in many accounts, a total of 232,799 deaths were reported in the published annals. The number of deaths increased to 273,934 after recording data from supplementary sources for 103 localities. The total number of reported victims of imprisonment, beatings, expulsions from homes, and other forms of persecution was just less than 13 million in the published annals and was 13.4 million when the internal data were added. From beatings, torture, and wounds during armed conflicts, a total of 256,476 injuries were reported in the published annals. These numbers are based on our restrictive coding rules: the actual figures were surely much higher. This is obvious both from the many narrative accounts of political upheavals or persecution campaigns that provided no numbers. It is also obvious from the large gap between the published annals and the alternate sources for 103 jurisdictions that draw on internal government data (discussed in the following text). For the majority of reported casualties it was possible to tie them to specific dates and types of events, permitting analysis of the distribution of casualties through time and their causes.
The database also contains extensive information about local events: 15 different “one time” events (e.g., the first mention of a Red Guard organization, or the first mention of opposed local factions). The most important of these, and the ones to be analyzed here, are the date of a “power seizure” of local government by insurgents (1,801 out of 2,213 jurisdictions), the first local intervention by armed forces (1,924 jurisdictions), and the establishment of a “revolutionary committee” that signaled the restoration of local government (2,194 jurisdictions). There are another 14,313 repeatable events in the database, classified by type, date, and number of reported casualties (deaths, injuries, victims, recorded as zero if no specific numbers were given).
These data are not a complete count of all events and casualties. They are a sample from a larger population that cannot be directly observed. In using the data, we assume that the distribution of event types approximates the underlying distribution. Similarly, we assume that the number of casualties generated by types of events—for example, due to the actions of insurgents versus authorities—will not be seriously biased. We also assume that the dates when types of events are reported reflect the periods when such events were most common. In short, the data generated by the coding of local annals is a sample of a larger population, from which we can derive insights about the structure of the conflict, its evolution through time, and the causes of casualties.
The Frequency and Timing of Reported Events
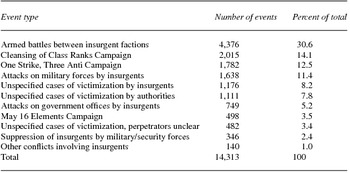
Table 1 shows the frequency distribution of “repeatable” events. By far the most common reported event was an armed battle between insurgent forces, 30.6 percent of the total. More than half of the reported events involved the actions of insurgents—their attacks on military forces (11.4 percent), their victimization of targeted individuals and groups (8.2 percent), and their attacks on government offices (5.2 percent). Overall, 56.4 percent of the events reported in the local annals involved the activities of insurgent groups. Official narratives emphasize the destructiveness of the mass insurgency, and the high proportion of reports on insurgent activities in the annals bear this out.
The frequency of reported event types

The most common events that involved actions initiated by authorities—local governments, military units, or security forces—were repression campaigns conducted as part of the suppression of insurgent groups and the rebuilding of local governments. A total of 40.3 percent of all reported events were of this nature. The most common were the “Cleansing the Class Ranks” campaign (or its local equivalent, 14.1 percent), which took place primarily in 1968 and 1969, and the “One Strike, Three Anti” campaign (12.5 percent), which was primarily in 1970. Unspecified acts of victimization by authorities comprised 7.8 percent of the total.
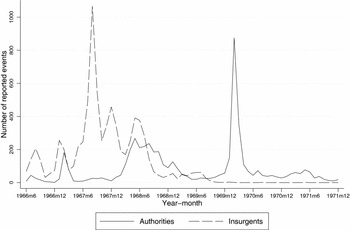
The temporal distribution of these events reflects the ebb and flow of a large insurgency that was eventually subjected to massive repression. Figure 1 divides events into those that were clearly the actions of insurgents and those that were the actions of authorities, and traces their distribution over time. The insurgency develops rapidly in late 1966 and exhibits several peaks before subsiding after mid-1967. An initial peak in August 1966 coincides with the rise of the student rebellion, which eventually targeted local governments. A second peak in early 1967 marks the upsurge of insurgent attacks that toppled local governments in power seizures. By far the largest peak was in the summer of 1967, the high tide of armed battles between insurgent factions, which subsided gradually before dropping precipitously after the spring of 1968. This pattern confirms existing historical accounts of this phase of the Cultural Revolution, which portray the summer of 1967 as the most violent period of the insurgency.
The temporal distribution of events, by actors

The events that mark the actions of authorities trace a very different pattern. There are few reported actions of authorities until February 1967, when there is a brief peak as armed forces intervene to stabilize public order in the wake of insurgent power seizures, and a subsequent drop until the spring of 1968, when the effort to curtail the rebellion and disband mass organizations began in earnest. The sustained peak that begins in May 1968 and continues until early 1969 reflects direct government and army actions against insurgents and the onset of the “Cleansing the Class Ranks.” The large spike in early 1970 reflects the brief but intense “One Strike, Three Anti” campaign, which further consolidated the power of the new authorities.
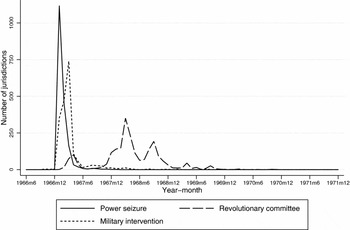
Figure 2 displays the temporal distribution of one-time events that mark important turning points: the date of an insurgent “power seizure” that indicated the fall of the local party committee and government; the date of the first local intervention by military forces to “support” these power seizures by stabilizing public order; and the formal establishment of a “revolutionary committee” that incorporated military officers, insurgent leaders, and selected party officials in new organs of state power. The most striking feature of this figure is the rapidity and deep penetration of power seizures across the country, which reflects a remarkably far-reaching collapse of civilian governments. Any suspicions that the upheavals of this period were restricted to major cities can now be laid to rest. Of the 2,213 jurisdictions in our sample, just less than half reported power seizures in January 1967 alone, and more than three-fourths had done so by the end of March 1967. It has long been known that such power seizures occurred at the province level, but this is the first evidence that the vast majority of all local governments in China were similarly disrupted in a remarkably concentrated period of time.
The temporal distribution of major political events

The rapidity and thoroughness of this collapse helps to explain the next spike in activity, which reflects the intervention of armed forces. It has long been known that the army was called out at the end of January 1967 to stabilize public order after power seizures, but this is the first evidence of the extent of military involvement. By the end of March 1967 armed forces had reportedly intervened in 70 percent of the jurisdictions, and by June 1967, just less than 80 percent.
The third milestone event, the establishment of a revolutionary committee, signaled the end of the popular insurgency and the reestablishment of local government under military control. There is a small peak from March to May 1967, covering only 9.5 percent of jurisdictions, but the effort was halted almost completely during the upsurge of fighting between armed insurgent factions in the summer of that year. By the end of 1967 only 18 percent of jurisdictions had reportedly established a revolutionary committee. The effort resumed at an accelerated pace in 1968, peaking in March–April and again in August–September. By November 1968, 91.5 percent had established revolutionary committees, and 99 percent one year later. The effort coincided closely with the upsurge in actions by authorities traced in figure 1.
The Distribution of Casualties and Their Causes
The impression given by the frequency and timing of events is that a massive insurgency was gradually quelled by the forces of order. Official portrayals of the period emphasize the “chaos” generated by the insurgency, and post-Mao memoirs emphasize the violence and cruelty that often characterized rebel actions. In terms of the number of reported events, the actions of insurgents and the actions of authorities are roughly equally balanced. If we left the analysis here, we would conclude that a chaotic and destructive insurgency wrought havoc throughout China from late 1966 and into early 1968, before “order” was gradually restored, after some delay, by military forces. The unspoken assumption of such a portrayal is that the forces of order moved in and curtailed the path of insurgent destruction that swept across China.
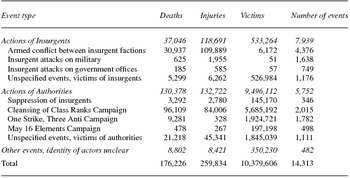
This portrayal, however, is highly misleading. If we draw on data about the casualties linked to these same events, we gain a very different perspective. Table 2 tabulates the casualties linked to the 14,313 repeatable events in our database. It is clear that the actions of authorities were vastly more destructive than the actions of insurgents, at least as reported in the published annals. While the number of injuries is roughly evenly divided between actions of insurgents and authorities, the authorities are responsible for the overwhelming majority of deaths and victims. Of the 176,226 deaths that can be linked to specific events, almost three-quarters (130,378) are due to the actions of authorities. Of the more than 10 million reported victims of political persecution, more than 90 percent suffered at the hands of authorities.
Distribution of casualties by event type

The table clarifies how the numbers were generated. On the insurgent side, the vast majority of reported deaths and injuries were from armed conflicts between insurgent factions. Insurgent attacks on government and military forces generated small numbers. The vast majority of those victimized in some way by insurgents were due to “unspecified” events, primarily (as we shall see) during the first eight months of the period, when the targets of rebel groups were attacked and subjected to struggle sessions and imprisonment. In short, insurgents were indeed responsible for a large number of deaths, but they were most likely to kill other insurgents.
By contrast, the actions of authorities appear to have been far more ruthless and efficiently destructive. The vast majority of deaths were generated by the “Cleansing the Class Ranks” campaign, conducted by military and civilian authorities after the establishment of revolutionary committees. Three times as many reported deaths were generated by this campaign as by the earlier armed battles among insurgents. Narrative accounts specify three causes: executions carried out after political trials; deaths in captivity, primarily as the result of harsh interrogations; and suicides by those undergoing interrogation. These deaths occurred after the dismantling of insurgent organizations and the restoration of “order.” The “Cleansing” campaign is also responsible for generating the majority of victims of political persecution, although the much less deadly “One Strike, Three Anti” campaign also generated large numbers. Those who were targeted in these campaigns suffered some combination of investigation, imprisonment, coercive interrogation, expulsion from homes or jobs, or a political verdict that stigmatized them and their immediate family members for years thereafter.
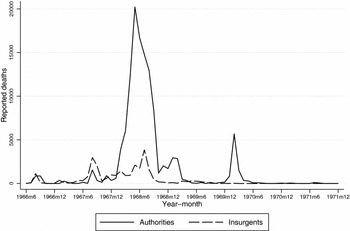
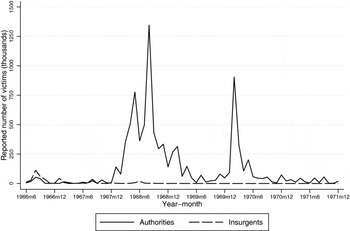
Figures 3 and 4 show the temporal distribution of deaths and victims due to the actions of insurgents and authorities, and they provide an additional perspective on the balance between rebellion and repression. Figure 3 traces deaths through time, and makes starkly clear the huge imbalance between the insurgency-generated casualties and those due to the actions of authorities. Deaths due to the action of insurgents peaked in the late summer of 1966, during the rise of rebel movements, and again in the summers of 1967 and 1968, which coincided with the two peaks of armed battles between insurgent forces. A massive spike in deaths generated by the forces of order dominates the period from the spring through early fall of 1968—primarily the fallout from the “Cleansing” campaign that followed rapidly upon the restoration of local government. A second spike in early 1970 occurred long after the insurgency was quelled.
Temporal distribution of deaths, by perpetrators

Temporal distribution of victims, by perpetrators

Figure 4 shows an even more pronounced pattern. The vast majority of victims generated by the insurgency were concentrated in the fall of 1966 with the rise of rebel attacks on authorities and others, and in early 1967 during the power seizures. From that point on the insurgent movements were preoccupied with fighting one another, an activity that generated deaths and injuries, but few of the kinds of victims typical of their earlier activities. These numbers are dwarfed by the gigantic spike in victimization at the hands of authorities during much of 1968, and by the brief but intense upsurge in early 1970.
The huge imbalance of these numbers, and their temporal distribution, yield two broad conclusions. First, if in 1968 the authorities finally acted to curtail a destructive insurgency, it is obvious that the cure was far worse than the disease. The magnitude of suffering at the hands of the authorities was far out of proportion to that due to insurgents. Second, it seems clear that the “restoration of order” in 1968 was anything but that. Instead, it was the beginning of a massive campaign of state-directed terror that in some respects was unprecedented in the history of the People's Republic of China, and went far beyond the actions necessary to bring an unruly insurgency to heel. The insurgency of the early years may well have been an unprecedented event in the history of twentieth-century communism, but the suppression campaigns waged from 1968 forward were a form of state-directed terror analogous to the Soviet campaigns of the Stalin era.
Estimating Total Casualties
These findings make more pressing the question of the true magnitude of the events that we have described. Published speculations about “unnatural deaths” during this period have ranged from a low of 250,000 to much higher than 15 million. Rummel (Reference Rummel1991: 262–63) reviewed the range of such speculations in English-language secondary sources and settled on a figure just more than eight million (2.1 million deaths from the insurgency and its suppression and six million victims who died in prison camps).
How can the sources at our disposal provide more confident estimates? Many of the accounts in these annals make clear that there were extensive local upheavals and harsh persecution campaigns, yet nonetheless provided no specific numbers. We coded these cases as zero. In many cases, specific numbers for deaths and victims of specific political campaigns were reported, but the account usually made clear that this was a partial number that referred only to one type of event or one time period. In these cases the coders were constrained to report only these numbers. The raw number of reported deaths and injuries are therefore only a fraction of the actual number—but how small a fraction? The preceding analysis is limited to casualties that can be tied to specific events and dates. If we consider the total numbers reported in all of our sources, there were more than 273,000 reported deaths and more than 13.4 million other victims. What is a plausible estimate of the true numbers?
Our strategy for estimating the underlying numbers of deaths and victims will draw on information about variations in levels of detail in local annals, provincial variations in editorial policy, and data from sources other than published annals—especially the classified internal party investigation reports from one region that experienced widespread mass killings. Two different methods will point toward a plausible range of estimates. First, I compare levels of reporting in different sources to estimate probable levels of underreporting in published annals. Second, I employ sample selection models to derive statistical estimates of the total casualties that would have been reported had all the published annals reported at roughly equal rates. Finally, I will compare these statistical estimates with the probable levels of underreporting estimated in the first step to generate a final range of estimates.
Comparing Reports from Different Sources
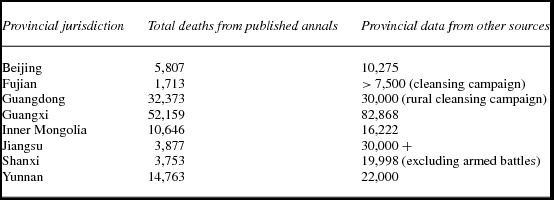
There are two ways of gauging underreporting in local annals. The first is to compare officially published numbers for entire provinces against tabulations from all of that province's local annals. Deliberate censorship and concealment of negative information was clearly practiced by the editors of annals, based on directives issued at the provincial level. Journals published by provincial offices in charge of compiling local histories openly debated the extent to which the Cultural Revolution should be covered in detail or only generally, in “broad strokes” (Walder and Su Reference Walder and Su2003: 79–82). Different provinces adopted different standards, reflected in wide variations in the length of chronologies and the extent to which they provided any coverage of political events in other sections of their annals. Provincial variation is too large for it not to be strongly influenced by province-level editorial policy. Accounts in the annals from Anhui and Zhejiang averaged only 2,700 words. At the opposite extreme, Shaanxi averaged more than 11,300. A regression model that predicts the log of account length by province, total population, and a dummy variable for cities shows that all three are strongly related to account length, accounting for 42 percent of the variation. By far the strongest single predictor is province, which alone accounts for 35 percent of the variation in length. These different levels of coverage resulted in huge differences in the number of reported deaths. Local annals in Anhui Province reported a grand total of only 638 deaths, Henan only 1,378, and Hubei only 1,776, while Liaoning reported 18,189 and Guangdong 32,373. The annals for Tianjin, a large municipality of six million, reported only 343 deaths, while nearby Beijing, a city of equal size, reported a total of 5,807.
These comparisons tell only part of the story. Provincial data published by other Chinese organizations report death tolls that are much higher than the totals in the local annals. This is true even for provinces whose annals reported relatively high numbers of deaths. Table 3 illustrates the problem for the cases in which we have separately published provincial figures. The numbers provided for Shanxi and Jiangsu were some five to eight times larger than the totals in the local annals. Guangxi's local annals, which reported by far the largest number of deaths (52,159), reported less than two-thirds of those enumerated by internal party investigations (82,868).
Underreporting of deaths in local annals, based on provincial data

Sources for provincial data: Beijing (Dangdai Beijing 1989: 165–66); Fujian (Fujian Annals 1999: 178); Guangdong (Dangdai Guangdong 1991: 118); Guangxi (Guangxi Zhuang Autonomous Region Party Committee 1988); Inner Mongolia (Inner Mongolia Party Annals 1999: 224); Jiangsu (Dangdai Jiangsu 1989: 121); Shanxi (Dangdai Shanxi 1989: 155); Yunnan (Dangdai Yunnan 1991: 175).
The extraordinarily detailed Guangxi investigations, which filled 18 book-length volumes, provide us with a way to estimate an upper limit for politically induced mortality in China as a whole. Guangxi is notorious for having unusually high death tolls due to mass killings in 1968 (Su Reference Su, Esh-erick, Pickowicz and Walder2006, Reference Su2011). The investigations conducted by the Guangxi Party Committee are probably the most thorough official accounting of deaths and victims—and on a per capita basis the death tolls there are surely well in excess of most other Chinese regions. The implied death rate for Guangxi was .0033, or 3.3 persons per thousand. If we apply this death rate to the Chinese population of just under 731 million at the time (excluding Tibet) this implies a nationwide death toll of 2.42 million. We regard this as an absolute upper limit on the number of deaths nationwide. A confident estimate will be considerably lower—but how much lower?
The next step is to compare figures in local annals with figures from other, primarily unpublished sources. The 86 annals from Guangxi reported 62.9 percent of the deaths counted in the internal investigation reports. This is a much higher rate of reporting than in a smaller sample of 17 jurisdictions scattered across 10 provinces for which we have unpublished internal data on death tolls. In this smaller sample, only 15.5 percent of the deaths reported in the internal sources were published in the annals. The Guangxi annals probably reported relatively fully on their death tolls because the compilers had at their disposal the recently completed investigations. How accurate, then, can we estimate the local annals to have been in reporting deaths? The average rate of reporting for the 17 non-Guangxi jurisdictions was 26.7 percent. The average rate of reporting for all 103 jurisdictions, including the 86 Guangxi cases, is 59.6 percent. This defines upper and lower boundaries for estimating the rate of reporting of actual numbers. The higher number is an upper limit heavily influenced by the relatively accurate Guangxi annals. The actual rate of reporting is probably much closer to 26.7 percent, which I treat as a lower boundary.
Another way to employ these figures is to compare our upper boundary estimate of 2.42 million deaths, derived from the Guangxi investigation reports, with a similar figure derived from the unpublished death tolls for the 17 non-Guangxi jurisdictions. The death rate in the unpublished figures for these jurisdictions is .0021, or 2.1 persons per thousand. This is considerably lower than the Guangxi figure (.0033), and translates to a national death toll of 1.53 million. This is surely much closer to the probable actual number than the extrapolation based on the Guangxi reports, although the projection is based on a very small number of cases.
Our second measure for political casualties is the number of total “victims,” which includes all of those who were injured, and much larger numbers who were subjected to beatings, harsh interrogation, demotions or firings, banishment from cities, or some other form of political stigma in “false cases.” This is a much less clearly defined category than death, but these figures convey the extent of the type of political persecutions long associated with the Cultural Revolution. The numbers of victims reported in local annals appear to be much closer to actual numbers. The Guangxi annals reported numbers of victims that were close to 70 percent of the numbers in the internal investigation reports. The published figures for the 17 other cases for which we have internal accounts report a similarly high percentage—close to 64 percent.
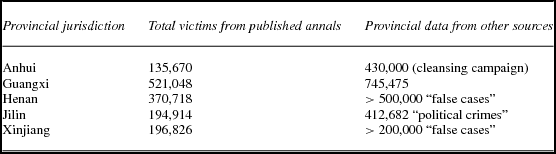
To be sure, there was systematic underreporting of victims in some provinces, as was the case for deaths. Table 4 shows that annals from Anhui, Jilin, and Henan reported at very low rates. However, annals in a number of provinces reported numbers of victims that outstripped the toll of victimization in Guangxi's internal reports. Yunnan's 1.5 million victims represented 6.6 percent of its population, Shanghai's 721,000 victims represented 6.5 percent, and Beijing's 336,000 represented 4.7 percent. Guangxi's rate of victimization was just less than 3 percent, less than half that of Yunnan and Shanghai and only sixth overall. All of this suggests that reporting on numbers of victims is much more complete than for deaths.
Underreporting of victims in local annals, based on provincial data

What do the figures in the previous paragraphs suggest for national estimates of victims? There were just less than 13 million reported victims in all of the annals. If the rates of reporting nationwide were similar to the relatively high percentages in the 103 cases in which we can compare published and internal figures (.67), this would imply a national estimate of 19.4 million people. If the true national rates of victimization were actually close to the 6.5 percent reported in Shanghai and Yunnan, the national number would be 48 million—a number that should be treated as an extreme upper limit. The victim rates implied by Guangxi's internal figures (.0297) were much lower than published figures for a number of provinces. If Guangxi's internal figures applied nationwide the number of victims would be 21.7 million. I suspect that the rate of reporting on numbers of victims was significantly less than our estimate of .67, a number heavily influenced by Guangxi's highly accurate annals. If we were to adjust this downward to a rate of 50 percent, this would yield a figure of 26 million.
Inferences from Statistical Models
The estimates derived in the preceding text are based on the application of simple arithmetic to differences in reporting at the provincial and local level, and differences between published and unpublished sources. There are, however, statistical methods designed to compensate for levels of underreporting in data of this sort. The reality of underreporting has long plagued those who use conflict data, whether it comes from official government sources or news accounts. China's local annals have features that distinguish them from other sources used in historical and contemporary research. Local annals are based on archival materials, but they are necessarily selective in what they report. This selectivity is also prevalent in newspaper accounts, which are by far the most common source of conflict data (Earl et al. Reference Earl, Martin, McCarthy and Soule2004; Olzak Reference Olzak1989). The two greatest concerns about newspapers are that they are more likely to report some kinds of events than others, based on variable and shifting conceptions of what is newsworthy, and that geographic coverage is biased toward major media centers (Danzger Reference Danzger1975; Snyder and Kelley Reference Snyder and Kelly1977).
This introduces sample selection bias: there are unspecified processes that influence which events make it into the sample to be analyzed. In some respects, this is analogous to sampling on the dependent variable: it is almost impossible to know whether the absence of reported events in a certain locality truly indicates the absence of an event, or selectivity in reporting (Franzosi Reference Franzosi1987; Olzak Reference Olzak1989). One common approach, which I have used in the preceding text, is to compare data from news reports with data from other sources, especially government data or archives (McCarthy et al. Reference McCarthy, McPhail and Smith1996). Another common approach is to employ statistical models designed to compensate for sample selection bias: two-stage estimators that, first, estimate the likelihood that an event will be reported, and, second, that adjusts coefficients to take into account the results of the first-stage estimation. The main difficulty in using such an approach is that it is rarely possible to convincingly specify and measure the features that influence selectivity in reporting (Franzosi Reference Franzosi1987; Olzak Reference Olzak1989).
Local annals have features that make these problems more manageable. The first is that there is a report for almost every locality in the country. None of the concerns about regional bias in newspaper coverage affect data from local annals. If a locality does not report a certain kind of event, or does not give a figure for casualties, that locality enters the data set as a zero. Each locality is required to compile accounts of some kind. Selectivity in regional coverage is largely absent in the sense that plagues newspaper data.
The second feature is that unlike newspaper data, it is easier to specify the reasons for selectivity in reporting and to measure them. The first reason for underreporting is simply the level of resources and attention that local governments devoted to the compilation of these volumes. In many of the poorer rural jurisdictions the level of detail and coverage in virtually all sections of these volumes are often low. Other jurisdictions, especially more prosperous and urbanized ones, evidently put much more editorial and financial resources into their annals, reflected in higher levels of detail and precision in all sections of the publication. A second reason for underreporting is provincial-level editorial directives of the kind described in the preceding text.
How can we estimate the extent to which variations in reportage reflects underlying variation in the actual course of events, or simply the extent to which local governments devoted resources and attention to the compilation of their local histories? Because we have accounts from all localities, an obvious measure is the level of detail in accounts of the period as measured by the raw count of the number of words in the general chronology of events for the years of interest. As a control to account for likely underreporting of events and casualties, we recorded the number of words in the chronology of events for the period from June 1966 to December 1971. We also recorded the number of words in other sections of the annals devoted to political events during this period, and the number of words in other sources, if they were available. The number of words in the general chronology and whether there are separate sections devoted to political event are direct indicators of level of detail in the annals. The number of words in separate sections of the annals devoted specifically to political events, however, may also reflect how many events actually took place. This introduces some uncertainty into this measure, but the pervasiveness of underreporting minimizes the problem.
These features of local annals provide opportunities to specify a selection model that are absent with most newspaper data. Account length, province (which we have already seen strongly affects levels of coverage due to editorial policy), and other features of the local jurisdiction (e.g., total population or urban population) can be employed in a first-stage model for selection into the sample, before subsequently estimating a model whose coefficients will lend themselves to a national estimate.
Judgments about the extent of underreporting ultimately rely on intuition about the relationship between account length, provincial editorial policy, and the difference between published and unpublished accounts. Because we have control variables that are related to levels of reporting, a regression framework is an obvious method to account statistically for the different factors that influence reports of casualties, including provincial editorial policy. One could estimate a regression model with number of casualties as the dependent variable, generate coefficients for account length and total population, multiply them by the sample means, add the resulting number to the constant term, and derive an estimate for per-jurisdiction casualties based on reports in accounts of average length. This number, when multiplied by the number of jurisdictions in the sample (2,213), would yield an estimate of the national total.
A standard regression model would suffer from the familiar problem of sample selection bias: truncated or censored data on the dependent variable yields biased coefficients for causal variables, leading to erroneous inferences (Berk Reference Berk1983). In our case, we are simply trying to get a less biased estimate of the relationship between account length, local population, and reported casualties. Our problem is one of censoring. We know that underreporting is widespread, that this is related to the length of the account devoted to chronicling the period, and that provincial editorial policy systematically affects both account length and reports of deaths. We want to take these processes into account systematically.
The most common method to account for censoring is to estimate a two-step Heckman selection model. The first step estimates a probit model that predicts censoring on the dependent variable—that is, the likelihood that a given report generates missing data. This generates a new independent variable that is used in a subsequent ordinary least squares regression model to adjust regression coefficients for censoring (Heckman Reference Heckman1979). The estimator is not a panacea; it can also produce biased estimates if certain statistical assumptions are violated (Stolzenberg and Relles Reference Stolzenberg and Relles1997; Winship and Mare Reference Winship and Mare1992). In our case we are interested in generating a range of plausible estimates, which are far more sensitive to our substantive judgments about what level of reporting constitutes censoring than the specifics of the computation models.
To apply this technique to our problem we first need to decide what variables influence censoring on the dependent variable (deaths or victims). We designate two variables for this first stage: province, represented by 27 dummy variables for each of the provinces (with one excluded as a contrast category), and the urban population in the jurisdiction, which indicates the presumably larger resources at the disposal of governments that publish annals. For the second-step equation, we employ a jurisdiction's total population and the total number of words in the published annals that were used in coding the data set. The basic strategy is to estimate the impact of total population and number of words on reported casualties, and use these coefficients and the constant term to generate a figure for the predicted casualties per jurisdiction, which in turn can be used to generate a national estimate for all 2,213 jurisdictions.
Note that this procedure does not include any information derived from the internal figures for 103 of our jurisdictions, 86 of which are from Guangxi. This is too small a percentage of our cases (fewer than 5 percent) and too atypical (Guangxi). Including this information would bias estimates upward—we cannot assume that longer accounts would result in casualty levels that approached Guangxi's. This means that these statistical models will derive estimates of what the annals would report if all of them reported casualties with equal accuracy—that is, after discounting the cases that are the most obvious candidates for underreporting. These estimates, in turn, will then be adjusted according to the proportions derived in the earlier section, based on differences in published annals and internal data (with a range from .267 to .594).
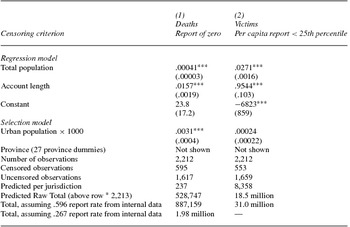
Table 5 reports estimates for deaths (column 1) and for victims (column 2). The model for deaths adopts the most conservative possible criterion for designating “censored” accounts—a report of zero for deaths in the published local annals. Eliminating zero reports from the second-stage estimation essentially treats zero reports as missing data and discards those cases in the second-stage estimation, while adjusting the coefficients in the second stage from the results in the first stage, which models the probabilities of a zero report. In the first-stage equation, we designate province and total urban population of the jurisdiction as the predictors for a zero report. The reasoning is that there are very wide provincial variations in the length and detail provided in annals (discussed at length in the preceding text), and that more urbanized regions will have more resources to devote to the compilation of annals. The second-stage estimation predicts number of reported deaths as a function of total population and the number of words devoted to describing the period.
Estimates of underreporting from Heckman selection models

*p < .05. **p < .01. ***p < .005.
The estimate for deaths (column 1) treats 595 cases as censored, and derives its second-stage estimate based on the remaining 1,627 cases. After multiplying through the coefficients in the second stage with sample means for population (320,285) and account length (4,969 words), and adding to the total the constant term, the model yields a figure of 528,747. This number is more than double the raw number of deaths reported in the annals, and represents a statistical estimate of the number of deaths that would have been reported if all local annals reported deaths at roughly equal rates. When we adjust this number by our high (.596) and low (.267) boundaries of likely underreporting (derived from our comparisons of published and internal data in the preceding text), we derive a low estimate of 887,159 and a high estimate of 1.98 million.
Our procedure for the number of victims (column 2) uses a somewhat broader definition of censoring—accounts that report victims per capita in the bottom quartile. The criterion is broader because, as we observed earlier in this article, annals tended to report more freely on numbers of victims than numbers of deaths. The advantage of this criterion is that it treats the number of cases that are censored (553) to be roughly the same as the number of cases censored in the equation for deaths. The raw predicted total for numbers of victims is 18.5 million, which is only 41 percent larger than the raw number reported in the annals—consistent with our earlier conclusion that reports of victims were more accurate. Because we assume that these figures are more accurately reported, we adjust this figure only by the estimate of a higher reporting rate of 59.6 percent, which yields a national estimate of 31 million victims.
Summary: The Range of Estimates
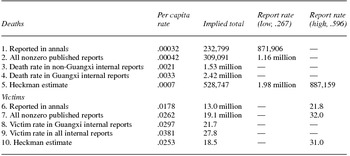
The range of estimates for deaths and victims are displayed in table 6. The top half of the table (rows 1 to 5) summarizes the various estimates for deaths. Line 1 contains low-end estimates that take the raw numbers of reported deaths and simply adjusts them based on the estimated low rate of reporting. Line 2 treats all reports of zero as missing cases, and applies the death rates reported in all nonzero cases to the national population, yielding an estimate of 1.16 million deaths, assuming the same reporting rate of .267. Line 3 applies the death rates of the non-Guangxi internal data to the entire nation and yields an estimate of 1.53 million; line 4 is an extreme upper estimate that applies the Guangxi death rates to the entire nation, resulting in a figure of 2.42 million. Line 5 represents our best effort to adjust statistically for the annals that are most likely to have underreported seriously or to not report at all, yielding a somewhat higher baseline number of 528,000 reported deaths before correction for likely underreporting even among the best annals. This represents an estimate of how many deaths would likely have been reported if the annals were all of relatively high quality. Because even the most thorough annals reported around 60 percent of actual deaths (a number heavily based on the Guangxi annals), the figure of 887,000 is likely an underestimate, while the figure of 1.98 million, based on an assumed report rate of .267, probably overcorrects for likely underreporting after statistical adjustment of the reporting rates. Given these estimates and assumptions, the number of deaths probably falls between a range of 1.1 and 1.6 million, figures that bracket a low estimate of 1.16 million in row 2, column 3, and a high estimate of 1.53 million in row 3, column 2. I suspect that the actual number is closer to the high end of this range, but the data at hand do not permit a high degree of confidence.
Summary of estimates, deaths, and victims

Rows 6 to 10 of table 6 report estimates for national totals of victims, based on similar methods. These estimates are subject to less uncertainty because the annals report numbers of victims much more freely (and indeed a number of provinces reported per capita numbers of victims that were much higher even than Guangxi's internal reports). In correcting for underreporting in published accounts, we use only the higher assumed reporting rate (.596). Given the range of estimates in rows 6 to 10, the number of victims probably falls between a low of 22 million and a high of 30 million.
The relationship between the number of deaths and the number of victims deserves some comment. A little more than 5 percent of the estimated victims of the Cultural Revolution died as a result of their treatment. For each person who died, another 19 suffered directly from some form of political persecution. Roughly 3 to 4 percent of the population—or 6 to 8 percent of the adult population—were direct targets at some point, and most suffered as a result for many years thereafter. The rate of victimization surely varied widely across occupational groups, and probably reached its highest rates among educated professionals and party officials. If we assume that each individual targeted had four to six family members—spouses, parents, children—who were directly affected by their ordeals, well more than 100 million people were affected by this campaign in a traumatic way. The psychological impact of this toll on those who observed the persecution of others on vague and unsubstantiated charges, and who therefore had strong reasons to fear that such a fate might befall them or their family members as well, can be readily inferred.
Comparative Perspectives
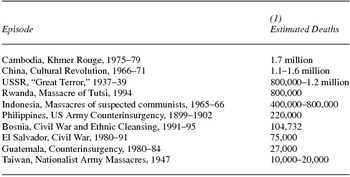
By any standard, 1.1 to 1.6 million deaths and 22 to 30 million victims represent an extraordinary toll of human suffering. Table 7 ranks the magnitude of selected episodes of politically induced mortality in the modern era (excluding interstate war). The list is designed to situate China's experience from 1966 to 1971 in relation to other documented cases. It includes cases of insurgency and counterinsurgency, organized state repression, and massacres of targeted populations. Our high estimate for the total deaths in China during this period is less than the generally accepted number for Cambodia under the Khmer Rouge, while the low estimate is somewhat higher than the high estimate for the Soviet “Great Terror” of 1937–38. It is well above the total numbers for the Rwanda massacres of 1994 and for the Indonesian Coup and massacres of suspected communists in 1965–66. The other comparison cases are all a small fraction of China's totals, and would ordinarily not come to mind in drawing comparisons with China's massive upheaval.
Ranking of comparison cases by magnitude

Sources: Bosnia (Zwierzchowski and Tabeau Reference Zwierzchowski and Tabeau2010); Cambodia (Cambodian Genocide Program 2013); El Salvador (Center for Justice and Accountability 2013); Guatemala (Ball et al. Reference Ball, Kobrak and Spirer1999: 119); Indonesia (Cribb Reference Cribb2002: 557–59); Philippines (US Department of State 2014), Taiwan (Kerr Reference Kerr1965: 310); Rwanda 1994 (UNICEF 2013); USSR (Getty and Naumov Reference Getty and Naumov1999: 588–91; Werth Reference Werth, Courtois, Werth, Panné, Paczkowski, Bartošek and Margolin1999: 206–7).
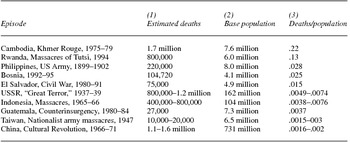
Aggregate numbers ignore the size of the populations at risk. Death rates are a measure of severity, different from magnitude, and indicate the likelihood that an individual would be killed. China's population was far larger than any of the comparison cases, and table 8, which ranks cases by their severity, radically changes our perspective. By this standard the Khmer Rouge purges of the late 1970s and the Rwandan massacres of 1994 are by far the worst episodes, resulting in the deaths of 22 and 13 percent of their base populations, respectively. Next in severity was the counterinsurgency campaign conducted in the Philippines by the United States Army from 1899 to 1902, which led to death by arms or famine of 2.8 percent of the population—a number comparable to the rate in Bosnia-Herzegovina from 1992 to 1995. The percentages drop rapidly in the remaining cases. The Soviet Union and Indonesia had roughly similar estimated death rates of roughly 4 to 7 per thousand, and the Guatemala counterinsurgency of the early 1980s had roughly 3.7 per thousand. Interestingly, the only case that had a comparable impact to the Cultural Revolution was the Nationalist Party's brutal response to a rebellion in Taiwan in 1947, as the regime sought to reassert Chinese control after the island's long period as a Japanese colony. The low estimate for the Taiwan massacres was roughly the same as our low estimate for the Cultural Revolution; the high estimate for Taiwan puts it on a par with Guangxi Province.

The final comparison is qualitative: the activities that generated these casualties vary widely across cases. The Cultural Revolution passed through three distinct stages: first, a growing insurgency that targeted politically stigmatized individuals linked to China's past as well as the leaders of local institutions and governments; second, violent clashes between armed factions that contested for power after the collapse of civilian government; and third, a series of harsh repression campaigns. We have also seen that the vast majority of casualties—an estimated three-fourths—were generated during the third phase by the actions of authorities. Of the remainder, the vast majority was generated by armed clashes between rebel factions in 1967 and 1968. The least deadly phase was the initial period of mass insurgency. However harrowing this experience was for the stigmatized households and officials who bore the brunt of these persecutions, the number of deaths due to this phase of the insurgency was relatively small.
There were no mass insurgencies or armed battles in Stalin's Soviet Union or Cambodia under the Khmer Rouge. The only comparable period in China was in 1968 and after, repressions carried out local civilian and military authorities rather than national security agencies. Even Guangxi, with a death rate of some 33 per thousand, did not come close to the death rate in Bosnia or the Philippines, which at 2.5 to 2.8 percent were nine times worse. China's initial insurgency and subsequent factional warfare were nowhere near as devastating as the conflict in El Salvador, which pitted armed forces against an extensive and well-armed popular insurgency. The level of repression through which political order was reimposed in China was only half as deadly as the brutal 1980s counterinsurgency campaign in Guatemala. The kind of mass killings with extensive participation by local civilians that was characteristic of Indonesia in 1965–66 and Rwanda in 1994 was evident in China primarily in Guangxi Province (Su Reference Su, Esh-erick, Pickowicz and Walder2006, Reference Su2011), though our figures for that province put its death rates much lower than Rwanda and somewhat lower than Indonesia. The closest parallel with China's “Cleansing the Class Ranks” was the Khmer Rouge purge in Cambodia. That effort to cleanse the Cambodian population of all polluting elements from the old society was reportedly inspired in part by Maoist doctrine of this period (Chandler Reference Chandler1999: 66–67; Kiernan Reference Kiernan2002: 330).
Conclusions
Our data set describes a political upheaval that was extensive, spread rapidly, and reached deeply into China's interior, affecting almost all localities. The conflicts moved through three distinct phases. In the first, a growing insurgency from mid-1966 to the end of that year saw escalating attacks on politically stigmatized groups, intellectual elites, and eventually party officials. The end of the first phase and the beginning of the second was marked by the rapid collapse of local governments, half of which fell to insurgent “power seizures” in January 1967, reaching more than 75 percent of all county and city governments by the end of March. The armed forces moved in after a lag of roughly one month, acting to support these power seizures in virtually every locality where they had occurred. The intervention of the army, however, did little to quell growing factional divisions among insurgents, whose armed clashes dominated most of 1967, reaching their highest levels in the summer of that year. The third phase began in early 1968, with a rise in actions by authorities to quell armed battles and restore local governments. As reports of factional combat disappeared from the record in mid-1968, a new phase began, in which organized persecution campaigns conducted by newly installed local authorities systematically attacked alleged counterrevolutionaries and class enemies on a massive scale.
Of the three phases, the first was the least violent and generated by far the fewest casualties. Retrospective accounts focus heavily on violent persecutions by student Red Guards of teachers, intellectuals, officials, and individuals from former exploiting classes. This phase of the campaign, however severely it terrorized those in targeted categories, generated relatively few deaths, injuries, and other victims—less than 10 percent of the total for the entire period, according to local annals. Far more deadly was the second phase, due primarily to armed combat among rebel factions, which accounted for half of all reported deaths during this period.
The first and second phases have attracted the most attention in descriptions of the Cultural Revolution, and have created the impression that its most destructive aspect was the chaotic insurgency that spun out of control, reaping a wide path of destruction for almost two years. Our evidence makes clear, however, that the “restoration of order” in the third phase was only the beginning of a qualitatively new phase that was by far the most deadly and destructive. Beginning with the “Cleansing the Class Ranks” and its local variants, a new wave of persecution and death escalated casualty rates far out of proportion to the insurgency for which it was an alleged remedy. More than three-fourths of all documented deaths in local annals are due to the actions of authorities in this third phase, and more than 90 percent of those persecuted for alleged political crimes. Our data make clear that this third phase was not simply a process of restoring order; it was a new campaign that resembled in many respects the Stalinist purges of hidden class enemies and alleged spies in the late 1930s known as the “Great Terror,” and helped to inspire much more deadly actions by the Khmer Rouge a few years later. If this period in China represents the “restoration of order,” it is clear that the cure was far worse than the disease. If it were not for this final phase of the Cultural Revolution, the death toll would probably have been only one-quarter of what it eventually became. Due to the actions of Maoist authorities after they quelled an insurgency that they had instigated and supported, the overall death toll due to their Cultural Revolution ranked among the most costly political episodes of the twentieth century. That the death toll was a comparatively modest percentage of China's massive population is little consolation.