Introduction
The race for high-data rates is driving the telecommunication industry into millimeter-wave (mmW) frequency bands exploration for 5 G network standardization. The frequency bands around 30 GHz are particularly attractive.
To cover several frequency bands, multi-band power amplifiers (PAs) are an interesting solution [Reference Hu, Wang and Wang1]. However, achieving high-performance levels over all frequency bands of interest is difficult. 5 G network will have to be adaptive as different use cases leading to different performances requirements are forecasted. To tackle this challenge, PAs with operating mode and/or frequency configurability are needed. Furthermore, efficiency/performance trade-off is still challenging for 5 G PAs. In the state-of-the-art, gain control is implemented in [Reference Shakib, Park, Dunworth, Aparin and Entesari2] but requires a dedicated stage while the saturated output power (Psat) remains limited. Psat enhancement is possible by using stacked-transistors topology but can lead to prohibitive power consumption levels [Reference Jayamon, Buckwalter and Asbeck3] while 5 G networks target limited power consumption and network nodes densification.
The need for configurability and digital intensive standards drives the need for large-scale SoC integration in advanced CMOS technologies. The 28 nm FD-SOI CMOS technology demonstrated promising performances for mmW PA design [Reference Larie, Kerhervé, Martineau, Vogt and Belot4].
To address these challenges, we propose a 31 GHz PA exhibiting a balanced topology and implemented in 28 nm FD-SOI technology from STMicroelectronics. Power gain very fine grain configuration, as well as temperature-induced performances compensation and AM-PM optimization regarding power back-off, are performed thanks to extensive usage of body-bias. This configurability achieved with relatively constant power efficiency performance; thanks to a novel output load determination strategy, enables an efficient system-level control in SoC implementation.
This article is an extended version of [Reference Torres, De Matos, Cathelin and Kerhervé5] and provides in-depth description and development about the design; from technology to design choices as well as extended measurements results.
The section “28 nm FD-SOI for mmW PA design” of this article highlights 28 nm FD-SOI flavors and the PA configurability possibilities it offers. The section “PA design” depicts the proposed PA design, topology choices as well as active and passive devices optimization. Extensive measurements and state-of-the-art comparison are available in the section “Measurements”. Finally, a conclusion highlighting the main features of this work is provided.
28 nm FD-SOI for mmW PA design
Active devices and technology back-end-of-line
SOI technology differs from classical bulk CMOS by featuring an ultra-thin silicon layer over a buried oxide. This buried oxide allows several improvements compared to bulk technology:
• Channel-to-substrate leakage limitation by isolating the channel from the substrate.
• Source-to-substrate and drain-to-substrate junction diode elimination as well as source-substrate and drain-substrate parasitic capacitance limitation.
• An additional control lever through substrate voltage, the body-bias, allowing threshold voltage (VT) variation.
Two transistors types are available in the technology. “Regular VT” (RVT), similar to bulk transistors, and “low VT” (LVT) transistors featuring a flipped-well structure with lower threshold voltages for both NMOS and PMOS transistors. A comparative cross-section scheme featuring regular CMOS bulk and 28 nm FD-SOI technology transistors is available in Fig. 1 [Reference Cathelin6].
Cross-section of regular Bulk CMOS technology VS 28 nm UTBB FD-SOI CMOS technology transistors.

Forward and reverse body-bias (Vbody) can be applied to those active devices. Vbody range is limited by parasitic diodes in the well. Indeed, if those diodes are not kept in a blocked state, harmful excessive currents (for FBB) and critical breakdown (for RBB) can occur. Table 1 lists those biasing modes and their limits. Figure 2(a) highlights the achievable VT range through body-bias node [Reference Cathelin6]. In the particular case of NLVT transistor, a very large variation of 250 mV is achieved through body-bias while on a classical bulk CMOS transistor only a few mV of VT variation can be reached, see Fig. 2(b).
(a) VT achievable range with NMOS and PMOS LVT and RVT transistors at minimum gate length in 28 nm FD-SOI. (b) Forward body biasing induced VT variation comparison between Bulk and 28 nm FD-SOI technologies (NMOS).

28 nm FD-SOI CMOS technology transistors body biasing mode, limits and nominal voltage

Another advantage of this technology for mmW circuit design is the high ft and fmax achieved values. Metal1-Pcell for a NLVT transistor with a gate length (Lg) of 30 nm, a number of fingers (Nf) of 20, and a finger width (Wf) of 800 nm achieves a ft and fmax of respectively, 295 GHz and 394 GHz. Measurements with an optimized BEOL reported a ft of 256 GHz and fmax of 346 GHz [Reference Guillaume, Rivet, Cathelin and Deval7].
In this work, we used the 28 nm FD-SOI CMOS technology with a back-end-of-line featuring 10 metal layers. This stack-up is composed of:
• Six thin copper metal layers of the same thickness named M1 to M6.
• Two intermediary copper metal layers with identical thickness named B1 and B2.
• Two thick copper metal layers named IA and IB.
• A thick AluCap named LB.
While the thin metal layers are particularly useful for digital routing, their high resistivity is too large for radio-frequency (RF) applications like RF path routing or passive devices implementation. The RF routing must be implemented on the thickest metal layers IA and IB while B1 and B2 are useful for crossing – particularly if they are stacked – where additional metal layers are needed. An illustration of the 10 metal layers 28 nm FD-SOI CMOS technology used in this work is available in Fig. 3.
10 metal layers 28 nm FD-SOI CMOS technology back-end-of-line illustration.

Body biasing and PA tuning capability
To illustrate the PA configurability achievable through body-bias, ID = f(VGS) curves of a NLVT transistor (Lg = 30 nm, Nf = 50, Wf = 1um) for a fixed VDS of 1 V are plotted in Fig. 4, featuring body-bias variations.
VGS and Vbody dynamic comparison for fixed ID level target for Class AB to Class A shifting.

To achieve a higher ID level, corresponding to switching operating class from Class AB to Class A, it is possible to either increase VGS by 275 mV or set the body-bias to 3 V. Therefore, a small variation of VGS leads to a large drain current variation while body-bias dynamic range is wider and allows very fine-tuning of operating class through VT variation. This tuning ability has been used in the proposed circuit and has also been used in [Reference Larie, Kerhervé, Martineau, Vogt and Belot4, Reference Moret, Knopik and Kerhervé8] for pseudo-Doherty implementation.
In the proposed circuit simulations, we estimated that a 100 mV increase of VGS implies 6.7 dB gain improvement. A Vbody increase of 100 mV leads to only 0.8 dB gain enhancement. Fine gain control is then enabled by the body-bias and does not require any dedicated stage nor adds complexity to the signal path.
PA design
Overall topology
In this work we identified and focused on several challenges related to 5 G PA design:
• The PA is the most power-consuming block in modern transceivers and a challenge of 5 G is to limit the network power consumption while densifying the number of cells. Therefore, PA with limited power consumption and high efficiency is needed.
• Complex modulation schemes used in 5 G with high PAPR leads to stringent linearity requirements.
• High-gain levels are needed. Gain configurability as well as performances and power consumption adaptability allow system-level control for SoC.
• In beamforming phased array, the environment of individual PA differs and can lead to impedance mismatch. This can produce harmful voltage overshoot at the output of individual PA.
To tackle these challenges, we implement a balanced topology. This type of topology offers robustness to input/output impedance mismatch that could occur in beamforming phased array. As it performs power combining, Psat and P 1 dB are improved by 3 dB. The balanced topology reduces IM 3 by 6 dB and offers ACPR improvements compared to an individual amplifier with the same topology.
Both amplification paths of the balanced PA are identical. As we target a high PAE and limited power consumption simultaneously with a high gain, we limit the number of amplification stages to two stages.
Differential topology is used for both amplification stages. It provides additional power combining and higher stability thanks to a dynamic virtual ground compared to a single-ended amplifier. Indeed, single-ended are highly sensitive to ground return path parasitic, possibly leading to oscillations. The dynamic virtual ground between two differential paths in a differential architecture make the circuit ground insensitive to the ground path parasitic and therefore provides better stability than single-ended PAs.
Baluns and transformers in a differential design offers enhanced reliability and robustness by providing electrical and galvanic isolation between stages. It also allows the use of center-tap to apply voltages and eliminates the need of DC blocking capacitance on RF path and choke inductors with large area footprint.
To achieve satisfying linearity in multi-stage PAs, each stage must be linear enough to not degrade the linearity of the next stage. It means that the OCP1 of each stage must be higher than the ICP1 of the following one. The body-bias used to improve the gain has a negative impact on the OCP1. Therefore, to keep the best overall linearity performances we implement the body-bias on the last amplification stage on Vb_CS node.
All the layout optimizations discussed in the following sections strictly respect the DRC and ERC rules. Electromigration conditions fulfilment is also checked carefully. For the most extreme encountered measured conditions – corresponding to a maximum body-bias value at saturated output power from the measurements in the section “Measurements” – electromigration rules are fulfilled for 10 years of operation at 100°C. By applying the lifetime derating indicated in the design rules manual, 2 years of continuous operation under those extreme conditions are achievable with electromigration reliability fulfilled at 125°C.
The overall PA topology is available in Fig. 5(a).
(a) Proposed PA overall topology. (b) Amplification stages.

Transistor design
In deep sub-micron technology mmW circuit implementation, transistor sizing and design optimization are crucial. The transistor total width of both amplification stages is chosen for a current density of 220 μA/um to maximize fmax. For this current density, a gate length of 60 nm shows quasi the same fmax than the minimal gate length of 30 nm (Fig. 6(a)).
(a) fmax comparison between gate length of 60 nm and 30 nm. (b) ft and fmax versus gate length for a fixed 400 μm transistor.

Finger width parameter has an influence on both ft and fmax, linked to intrinsic gate resistances and capacitances. To find the optimum Wf we simulate ft and fmax of a Metal1-Pcell transistor with a fixed 400 μm total width (Wtot). Results are available in Fig. 6(b). The optimum finger width in this technology is then 1 μm, as it is a trade-off between ft and fmax.
Thanks to the technology margins offered by the technology, this design around 30 GHz can be carried out with a non-minimal 60 nm gate length transistors, ensuring comfortable transconductance. The use of non-minimum gate length transistors offers several advantages over performances and robust integration. An increased Lg reduces the current per gate finger at high power and thus limits the stress related to electromigration. Local process variability risk, leading to performance dispersion between chips, is also reduced. Higher Lg also limits gate resistance (RG) and CGD/CGS ratio. CDS parasitic capacitance is also limited and eases output matching.
A specific layout optimization strategy has been adopted to maximize ft and fmax and reduce parasitic interconnects. A double gate access has been designed to reduce RG, enhancing fmax. It also provides higher robustness regarding high power induced stress compared to a single access. A staggered structure is implemented for drain and source connections. It consists of an iterative reduction of the metallic finger length from lower to higher metal layers. This limits drain and source parasitic resistances thanks to metal stacking as well as CDS as less surface is in regard between drain and source interdigitated fingers. Fringe capacitance to ground is also limited for ft and fmax enhancement. Simulated effective ft for the Metal1-Pcell is 220 GHz while with the fully optimized back-end-of-line 190 GHz is achieved. A 3D view of the transistor layout is available in Fig. 7.
3D view of the elementary transistor cell with optimal layout.

To optimize the overall layout, each transistor of both amplification stages is subdivided into 32 μm Wtot elementary transistor cells. Under all operating conditions, all the active devices remain in their safe operating area. This specific transistor optimal design has been carefully implemented to fulfil all DRC rules.
Amplification stages design
Two distinct amplification stages have been designed. Their topology is exhibited in Fig. 5(b).
The first amplification stage (S1) consists of a differential LVTNMOS common-source. It is operated in linear Class A and delivers a fixed gain to respect the overall linearity specification. It is fed by a 0.7 V power supply to improve efficiency. Capacitive neutrodyne neutralization using 16fF MOM capacitors is performed to compensate CGD [Reference Asada, Matsushita, Bunsen, Okada and Matsuzawa9] and improves both gain and reverse isolation. Wtot of the transistor used in this stage is 64 μm, subdivided in 2 × 32 μm elementary transistors.
The second amplification stage (S2) exhibits a differential cascode architecture to enhance the bandwidth, reverse isolation, and output power. It is supplied by a 1.98 V power supply. 32fF capacitive neutrodyne neutralization is realized for the same reason than in S1. CG and CS transistors of the cascode architecture both have a Wtot of 128 μm, subdivided in 4 × 32 μm elementary transistors. Interconnections have been optimized to limit parasitics.
Forward body-bias is applied on Vb_CS node to achieve a very fine grain wide gain range control. For Vb_CS varying from 0 V to 1.65 V, VT decreases linearly from 326 mV to 184 mV. This enables S2 continuous operating class shifting from Class AB to Class A.
A novel approach for S2 output matching is proposed in this work.
Traditionally, load-pull simulations under nominal operating conditions are used to determine the output load, maximizing both PAE and output power. Load-pull simulations results for both Class AB and Class A modes are available in Fig. 8. An optimal output load impedance of Zload_Class−AB = 41 + j67 Ω is defined for Class AB operation while in Class A the optimal output impedance is Zload_Class−A = 54 + j45 Ω. Therefore, choosing between one of those two different optimal impedances privilege one mode among the other. Generally, this choice is made to privilege the linear operation mode.
Load pull simulation results for Class AB and Class A modes of operation and associated optimum output impedances.

In this work, we focus on optimal matching for all modes of operation. Therefore, the choice of output load is made as a compromise between Psat and PAEmax Smith charts contours for all modes enabled by body-bias variation. Therefore, instead of advantaging one mode among the other, the load is optimum for all modes, from Class AB to Class A. This is illustrated in Fig. 9. This choice ensures a quasi-constant PAEmax under all operating modes and the optimal output impedance for all modes is Zload_Optimized = 60 + j62 Ω.
Optimum output load determination strategy illustration.

Passive design and optimization
90° Hybrid coupler
The balanced topology implementation requires the use of 90° hybrid couplers. Several distributed 90° hybrid couplers topologies are reported in the literature, like branch-lines or coupled-lines couplers [Reference Bree10] and have been used extensively for MMIC. However, regular 90° hybrid couplers on-chip integration in deep sub-micron CMOS technology is challenging for 5 G mmW frequency bands as they are based on the use of λ/4 transmission lines. Indeed, those lines suffer from a large area footprint around 30 GHz and the induced losses on RF path can degrade the overall system efficiency.
Recently, a compact distributed quadrature hybrid coupler featuring a twisted design has been introduced in [Reference Knopik, Moret and Kerhervé11], its size and design flexibility allowing a pragmatic design. This design has been validated in 28 nm FD-SOI CMOS technology in [Reference Moret, Knopik and Kerhervé8] and demonstrated robustness to 3:1 VSWR conditions. In this work we implemented this promising topology.
This section details the design procedure developed in [Reference Moret, Knopik and Kerhervé8, Reference Knopik, Moret and Kerhervé11].
The distributed quadrature hybrid coupler can be seen as a simple lumped elements model as shown in Fig. 10.
Quadrature hybrid coupler design and associated lumped elements model.

Lumped elements C and L values are defined by equations (1) and (2) with Z0 the characteristic impedance of the coupler, f0 its central frequency and k the coupling coefficient.


To synthetize these values, the starting point is a unitary cell as the one shown in Fig. 11. Inductances and capacitances are distributed along the two tracks. The unitary inductance Lu, capacitance Cu and resistance Ru can be extracted with electromagnetic (EM) tools. The hybrid coupler can then be designed by cascading N unitary cells; and the total inductance, capacitance, and resistance values are defined as in equations (3)–(5).
Unitary cell for quadrature hybrid coupler design.

Couplers are implemented in the two thickest copper metal layers offered by the technology, IA and IB, to limit losses and the unitary cell dimensioning is made to respect DRC rules while providing enough inductance and capacitance values as well as a limited resistance on each track. The use of quadratic hybrid coupler improves the robustness to impedance mismatch, matching, isolation and stability in the overall PA topology.


Output, inter-stage and input impedance matching network
Table 2 sums up the optimal input and output impedances for both amplification stages S1 and S2. From these values, the impedance transformations are made by using baluns and transformers. The output load matching to 50 Ω is synthesized with a flipped balun in a stacked configuration, performing also the differential-to-single-ended conversion. The primary winding is featuring two turns and is implemented on IB metal layer with a 6 μm width. The crossing between the two turns is made on IA metal layer to keep the advantage of the low resistivity of those thick metal layers and avoid additional loss. The secondary winding is positioned over the second turn of the primary to maximize the coupling and is implemented on LB AluCap, with a 6 μm width. S2 supply voltage is applied through the primary winding center tap. A 105fF capacitance is inserted between the two secondary winding terminations to refine the balun central frequency and broadens the bandwidth. A 28 GHz bandwidth – from 22 GHz to 50 GHz – is achieved while insertion losses are lower than 1 dB from 14 GHz. A 3D view of the output balun and post-layout simulations performances are available in Fig. 12.
Output balun 3D view, dimensions and post-layout simulations results.

S1 and S2 stages optimum input/output impedance values

As both amplification stages, S1 and S2 have a differential topology, the inter-stage matching network is realized with a transformer. Both primary and secondary windings use a single-turn configuration. The primary and secondary winding are implemented on IB and LB metal layers respectively, with a 6 μm width. The primary winding center tap is used to apply S1 supply voltage while the secondary winding is used to apply the gate bias for the common-source stage of the cascode topology in S2. Insertion loss under 1 dB is achieved from 17 GHz while a 6 GHz bandwidth centered at 34 GHz is obtained. A 3D view of the inter-stage transformer, as well as post-layout simulations results, are available in Fig. 13.
Inter-stage transformer 3D view, dimensions and post-layout simulations results.

Finally, the input matching network performs both single-ended-to-differential conversion and impedance transformation from 50 Ω to Zin_opt_S1. For this purpose, it is implemented with a stacked flipped balun. The secondary winding has a 3-turns topology implemented on IB. The crossings between turns and parts of the 2nd and 3rd turns are implemented on IA due to DRM constraints and to avoid additional loss due to the lower resistivity of thinner metal layers. The single-turn primary winding is stacked over the second turn of the secondary winding to maximize coupling. The center tap of the secondary winding is used to apply S1 gate bias. Insertion loss under 1 dB is achieved from 30 GHz and a bandwidth of 7 GHz, centered at 34 GHz, is obtained. Figure 14 presents a 3D view and the post-layout performances for this input balun.
Input balun 3D view, dimensions and post-layout simulations results.

Measurements
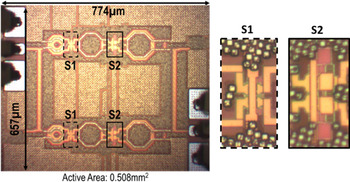
The overall PA layout has been optimized in respect with electromigration requirements up to 125°C and density rules targeting industrial requirements. The proposed PA has been manufactured in 28 nm UTBB FD-SOI CMOS featuring 10 metal layers. A photomicrograph of the manufactured chip is available in Fig. 15.
Manufactured power amplifier photomicrograph.

In this section, small-signal, large-signal, and AM-PM measurements are presented. A robustness and reliability evaluation is also reported and provides a statistical study as well as measurements under different temperature of operation up to 125°C.
Small-signal measurements
Small-signal measurements have been performed on 20–40 GHz frequency range. The body-bias voltage is varied from 0 V to 1.65 V. S-parameters measurement results are plotted in Fig. 16.
Measured S-Parameters with body biasing continuous tuning.

The small-signal gain is improved with the Vb_CS increase. It goes incrementally from a maximum of 21.9 dB for Vb_CS = 0 V to reach 32.6 dB when Vb_CS = 1.65 V at 31 GHz. A maximum 3 dB bandwidth (BW3 dB) of 6 GHz is measured. It covers the targeted 5 G frequency band from 31.8 GHz to 33.4 GHz under all Vb_CS conditions. This behavior illustrates the dynamic gain control with a range of over 10 dB enabled by the body-bias over the targeted frequency band.
S11 and S22 curves show good 50 Ω matching and stable conditions met overall Vb_CS range. S12 plot highlights a 35 dB reverse isolation overall body-bias conditions. This good isolation is achieved thanks to the topology choices depicted in the previous section.
Large signal measurements
Power gain, PAE and power consumption measurements under continuous-wave for a large input sweep at 31 GHz are available in Fig. 17.
Large-signal measurements: Gain, PAE and power consumption with body biasing continuous tuning.

The power gain graph confirms the wide gain tuning behavior highlighted in the previous section and enabled by body-bias setting. The power gain range goes from 21.9 dB for Vb_CS = 0 V with incremental steps up to 32.6 dB when Vb_CS = 1.65 V. A P1 dB of 15.3 dBm is achieved for Vb_CS = 0 V with a 0.9 dB gain expansion confirming Class AB operation. With Vb_CS = 1.65 V, the gain curve is typical for Class A operation while P 1 dB reaches 11.6 dBm.
Therefore body-bias offers continuous class shifting and two extreme operating modes can be identified:
• High-linearity mode for Vb_CS = 0 V
• High-gain mode for Vb_CS = 1.65 V
The Psat reaches 17.3 and 17.9 dBm for the high-linearity and the high-gain modes, respectively.
PAEmax is 24.7% in high-linearity mode and reaches 25.5% in high-gain mode. As expected, PAEmax is quasi the same for all operating modes thanks to the output load optimization strategy.
Back-off efficiency is an important parameter to evaluate. In this work, PAE at 6 dB Psat back off is over 10% in all modes and is slightly affected by Vb_CS settings.
The presented PA has a PDC of 76.1 mW in high-linearity mode and reaches 140.2 mW in high-gain mode. It is then possible to operate the PA in the high-linearity mode most of the time and use the high-gain mode when an extreme gain is necessary. Therefore, it is possible to control and limit the average power consumption in the overall system.
These measurements clearly highlight the wide range of fine-grain tuning abilities offered by the body-bias in SOI technology. This type of adaptability is useful to compensate for any performance drift that could occur during the manufacturing process or environment of operation, allowing robust adaptive systems.
Large signal measurements have also been performed between 28 GHz and 35 GHz for both high-linearity and high-gain modes. Results are reported in Fig. 18.
Large-signal measurements: PAEmax/PAE−1 dB and Psat/P1 dB in extreme modes from 28 GHz to 35 GHz.

From 30 GHz to 33 GHz, a PAEmax over 20% is achieved under both operating modes while Psat remains over 6 dBm. The maximum PAE −1 dB measured is 21% at 31 GHz corresponding to 15.3 dBm P 1 dB in high-linearity mode.
These measurements confirm the PA performances suitability for applications on the 31.8 GHz to 33.4 GHz expected 5 G frequency band.
AM-PM measurements
AM-PM measurements have been performed at 31 GHz for both extreme operating modes and the results are available in Fig. 19.
AM-PM versus Pout measurements at 31 GHz with body biasing tuning from 0 V to 1.65 V and optimum Vb_CS AM-PM compensation curve.

The curve for Vb_CS = 0 V presents a typical Class AB behavior. A phase expansion with a maximum deviation of 12.7° from the normalized origin is reached and is linked to the gain expansion typical in Class AB. For Vb_CS = 1.65 V, AM-PM curves show typical Class A behavior. When the gain is flat and output power is low no phase deviation occurs. The phase then decreases sharply when the output power is close to the OCP1 (−21.6° at P 1 dB). High phase deviation is then reported during compression up to saturation. Intermediary values of Vb_CS lead to intermediary AM-PM curves.
It is noticeable that at high output power levels, Vb_CS = 0 V is leading to the lowest phase variation. In the output power range between 4.5 and 11.2 dBm, Vb_CS = 0.25 V achieves the lowest AM-PM variation among all other modes. Finally, under 4.5 dBm output power level, all operating conditions show very low phase deviation.
It is then possible to plot the optimized AM-PM curves enabled by body-bias where Vb_CS is set to its optimal value depending on output power back-off to compensate AM-PM variations.
Therefore, the dynamical class shifting enabled by body-bias allows dynamical AM-PM setting to achieve desired trade-off between gain, output power, linearity, and consumption performances.
Robustness and reliability evaluation
On-wafer variability statistical study
A statistical study has been performed to evaluate induced on-wafer variability. For this purpose, large-signal measurements on 13 on-wafer occurrences of the same circuit on one wafer have been realized using the same operating conditions. Performances in both extreme operating modes have been evaluated. The results and the corresponding average and standard deviation values are available in Fig. 20.
Statistical PAEmax, power gain and Psat measurements over 13 on-wafer occurrences at 31 GHz with identical bias and supply conditions.

A very low standard deviation has been measured for all modes with a maximum of 0.08 dB for Psat, 0.62 dB for power gain, and 0.35% for PAEmax.
This has been possible to achieve thanks to the design choices made at an early stage and the limited technology process spread.
Measurements under various temperature of operation between 25°C and 125°C
Robustness to temperature variations has been evaluated with large-signal measurements on 25–125°C temperature range with Vb_CS varying from 0 V to 1.65 V. Measurements results are available in Fig. 21.
Large-Signal measurements at 31 GHz from 25°C to 125°C with Vb_CS tuning from 0 V to 1.65 V.

The measured performances modifications induced by the temperature increase can be explained by its physical impact on the chip with the occurrence of two distinct effects.
When the temperature is increased, internal transistor parameters are modified. It affects the VT that decreases while temperature increases. This induced VT reduction leads to a higher drain current level for a fixed VDS, in the same way, that it can be done with body-biasing at ambient temperature. Therefore, it induces the observed higher power consumption. This VT variation affects both amplification stages and does not have the same impact over performances for all Vb_CS values. In fact, for Vb_CS = 0 V, the VT variation induces a higher gain as the operating class drifts from class AB to class A. For Vb_CS = 1.65 V, the PA is already in class A. Therefore, the VT shift operates a drift from class A to over class A, in a mode of operation where the power consumption is higher for reduced gain performances.
Concerning Psat variations, they are linked to the PA routing and thus the same behavior in function of temperature is observed for all Vb_CS values. Indeed, the copper resistivity is increased with the temperature. Thus, the drain access resistance (balun parasitic resistance) of the power stage is increased. This reduces the total VDS value of this stage for fixed current conditions. Therefore, the saturated output power is reduced.
For the complete measured temperature range, the temperature-induced degradation remains limited and body-bias variation still performs a large gain tuning range. Therefore, the proposed PA can be operated normally in this temperature range.
These results highlight the circuit and technology robustness to industrial temperature range.
It is also possible to take advantage of the body bias induced Psat variation to tackle the effects of temperature. As depicted previously, for all operating modes a Psat variation of around 1 dB is reported when the temperature varies from 25°C to 125°C. By adjusting the body-bias value depending on the temperature of operation, an optimal temperature compensation curve can be obtained as illustrated in Fig. 22. Therefore, Psat variation is reduced to 0.4 dB. It is then possible to use the body-bias as a supplementary lever to overcome thermal-induced performance spread.
Psat VS temperature at 31 GHz with optimum Vb_CS temperature compensation curve.

Small-signal analysis for several temperature conditions has also been carried out in order to determine the induced impact over S-parameters.
S-parameters curves in high-linearity mode and high-gain mode are exhibited in Figs 23 and 24, respectively. Each curve corresponds to a different temperature value from 25°C to 125°C.
Small-Signal measurements from 25°C to 125°C in high-linearity mode.

Small-Signal measurements from 25°C to 125°C in high-gain mode.

In all temperature conditions, input and output stay well matched over the frequency range of interest in all modes. Both S 11 and S 22 temperature behaviors can be compared to S 11 and S 22 variations caused by body-bias tuning. It confirms the temperature-induced VT variation behavior detailed previously in this section.
The S 21 curves also confirm this behavior. As expected, higher power gain level and slightly improved BW−3 dB are obtained with higher temperature levels for Vb_CS = 0 V while the inverse tendency occurs for Vb_CS = 1.65 V. S 12 curve illustrates that the isolation is not impacted by temperature variations and remains higher than 35 dB under all temperature conditions. This is conferred by the balanced topology that provides a robust high reverse isolation.
State-of-the-art comparison
Table 3 summarizes the PA results in high-linearity and high gain modes and compares the proposed PA with recent mmW PA state-of-the-art.
Comparison with mm-Wave silicon PA state-of-the-art

Supply: #1st stage (SI), †2nd stage (S2)
ITRS FOM [W.GHz2] = Psat (W).Gain (lin).Freq2 (GHz2).PAEmax.
a Estimated from figures.
b Pads included.
Highly efficient, low consumption, linear PAs are required to fulfil 5 G applications requirements. As multiple amplification path will be used in FD-MIMO base-stations, the output power will be distributed. High Psat for individual PAs is then not mandatory, while a high gain is expected. The performances achieved by the proposed PA meet these needs. A sufficient Psat around 17.5 dBm is achieved with a limited power consumption of a maximum 140 mW. High gain is achieved even in high-linearity mode, comparable with the highest gain reported in [Reference Shakib, Park, Dunworth, Aparin and Entesari2]. The high-gain mode shows the highest reported gain around 30 GHz, leading to the highest ITRS FOM in the frequency of interest. Good linearity regarding P 1 dB is achieved in high-linearity mode, with 2 dBm between 1 dB compression point and saturation. Compared to previous design in 28 nm FD-SOI [Reference Larie, Kerhervé, Martineau, Vogt and Belot4], efficiency levels are improved in all operating conditions with no degradation between modes. Balanced topology confers additional robustness to external conditions variations as in [Reference Moret, Knopik and Kerhervé8], also implemented in 28 nm FDSOI technology. Compared to [Reference Moret, Knopik and Kerhervé8], a higher power gain is achieved in our circuit and the power consumption is reduced. Efficiency levels at a peak, at 6 dB Psat back off and at P 1 dB are improved.
In the state of the art, PAs achieving high output power levels present a limited gain and suffer from high power consumption even if efficiency levels are good [Reference Jayamon, Buckwalter and Asbeck3]. High PAE PAs generally suffer from low Psat, linked with low power consumption [Reference Shakib, Park, Dunworth, Aparin and Entesari2]. A trade-off generally exists between reported performances for the different targeted applications. This trade-off is relaxed in the proposed PA as good efficiency and output power are reported, simultaneously with limited power consumption and a high gain.
Conclusion
In this article, a 5 G PA is presented, aiming for the 31.8–33.4 GHz frequency band. A very wide and fine grain gain dynamic over 10 dB is obtained thanks to body biasing flexibility. The specific output load optimization done as a compromise covering both Class A and Class AB enables quasi-constant PAEmax and Psat under all operating modes. Robustness to both process-induced spread and industrial temperature range has been demonstrated thanks to design choices and optimizations. Temperature-induced Psat degradation compensation, as well as AM-PM optimization regarding output power back-off, are enabled by extensive usage of body biasing. Compared to previous work in the same technology, PAE at 6 dB Psat back-off has been significantly improved. Finally, the extreme gain of 32.6 dB achieved with only two stages in high-gain mode demonstrates an ITRS FOM of 26 925, the best in class reported around the frequency band of interest, to our best knowledge.
 Florent Torres received a master's degree in Electrical Engineering from the University of Bordeaux, France in 2014. He then received the Ph.D. degree in Electronics from the University of Bordeaux, France in 2018 for which his research work has been realized within the joint laboratory between IMS Laboratory, Bordeaux, France and STMicroelectronics, Crolles, France. He joined Ericsson Research, Lund, Sweden in 2018 and is now researcher within the RF Frontend and PA team part of Integrated Radio System research group. His main research interests are the design of power amplifier and frontend at RF and millimeter-wave frequencies in advanced technology nodes.
 Eric Kerhervé received the Ph.D. degree in Electrical Engineering from University of Bordeaux in 1994. He is Professor in Microelectronics and Microwave applications in Polytechnic Institute of Bordeaux and IMS Laboratory. Since 2015, he is director of the STMicroelectronics/IMS joint Lab. His main research activities focus on the design of RF, microwave and millimeter-wave circuits in silicon, GaAs and GaN technologies. He has authored or co-authored more than 200 technical papers in this field and was awarded 24 patents. He has organized eight RFIC/MTT workshops on advanced silicon technologies for radiofrequency and millimeter-wave applications. He was the General Chair of IEEE ICECS’2006 in Nice, France, IEEE NEWCAS’2011 in Bordeaux, France, and EuMIC’2015 in Paris, France. He is member of the Executive Committee of SiRF and of the IEEE MTT-Microwave and Millimeter-Wave Solid State Devices Committee. He was 2-years associate editor of IEEE Transactions on Circuits and Systems II.
 Andreia Cathelin (M’04, SM’11) started electrical engineering at the Polytechnic Institute of Bucharest, Romania and graduated from ISEN Lille, France in 1994. In 1998 and 2013, respectively, she received Ph.D. and “habilitation à diriger des recherches” (French highest academic degree) from the Université de Lille 1, France. Since 1998, she has been with STMicroelectronics, Crolles, France, now Technology R&D Fellow. Her focus areas are in the design of advanced RF/mmW/THz and ultra-low-power circuits and systems. Andreia held numerous responsibilities inside IEEE for more than 15 years: at ISSCC, VLSI Symposium, and ESSCIRC for TPC and Executive/Steering Committees, respectively. Andreia is a co-recipient of the ISSCC 2012 Jan Van Vessem Award and of the ISSCC 2013 Jack Kilby Award and the winner of the 2012 STM Technology Council Innovation Prize, for having introduced on the company's roadmap the integrated CMOS THz technology for imaging applications.
 Magali De Matos received the M.S. degree in Microelectronics from the University of Bordeaux, France in 1999. Then she joined laboratory IMS, University of Bordeaux, as a design engineer being involved in the design of RF ICs. Since 2007, she is in charge of the NANOCOM characterization platform in IMS, providing support to Ph.D. students and researchers working in the domains of IC design and device compact modeling. She is currently involved in millimeter-wave and in sub-THz characterization of integrated circuits and devices with IC Design and Nanoelectronics research groups.