1. Introduction
Cultural heritage sites are geographic areas associated with a historic event or activity and may encompass an array of cultural attributes such as anthropological landmarks or archeological items. While protection and access measures for cultural heritage sites involve economic tradeoffs, these are often difficult to quantify. The present study addresses the economic value of a cultural heritage site dedicated specifically to the preservation of petroglyph images (rock art), namely, the Petroglyph National Monument in Albuquerque, New Mexico USA. The demand for this cultural heritage site is explained in terms of a household production problem, with individuals deriving recreational services and nonuse values from the site. The ‘household production’ framework is applied using benefit-transfer methods and supporting studies by Bergstrom and Cordell (Reference Bergstrom and Cordell1991), Boxall et al. (Reference Boxall, Englin and Adamowicz2003), and Rolfe and Windle (Reference Rolfe and Windle2003, Reference Rolfe, Windle, Rolfe and Bennett2006).
The literature on benefit-transfer has its origins in a collection of papers organized by Brookshire and Neil (Reference Brookshire and Neil1992). Navrud and Ready (Reference Navrud and Ready2002, Reference Navrud and Ready2007) reviewed the application of benefit transfer for the valuation of cultural heritage assets, such as historic buildings, monuments, and artifacts. The present study adds to the benefit-transfer literature by examining the willingness-to-pay (WTP) for recreational use and preservation of a cultural heritage site dedicated to rock art. The policy site is the first national monument in the US National Park System dedicated to the preservation of petroglyph images.Footnote 1 The site was established through grassroots efforts (private provision), followed by permanent provision through a combination of federal, state, and local governments.
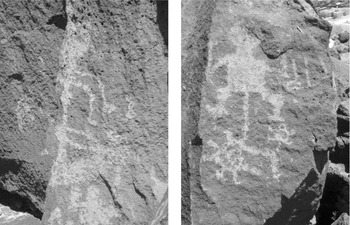
The monument site covers 7,244 acres of open space land, adjacent to and partially within the city of Albuquerque. The western boundary was created by several volcanic eruptions and lava flows some 190,000 years ago, leaving behind five volcanic cones along a 17-mile-long escarpment (Kudo, Reference Kudo1982). Some 25,000 prehistoric and historic petroglyph images are ‘pecked’ on boulder-size lava rocks in the Piedras Marcadas Canyon, the Boca Negra Canyon, the Rinconada Canyon, and the Mesa Prieta. The images include the following: abstract and geometric designs; figures of reptiles, birds, and large mammals; masked and horned serpents; four-pointed stars; flute players; and other anthropomorphic figures (figure 1). Many petroglyphs are dated between 1300 and 1600 AD. The more recent images correspond to the early Spanish colonization; others may be 3,000 years old. The study site also contains some 300 archeological sites, including the largest unexcavated pueblo in the middle Rio Grande valley, the Piedras Marcadas Pueblo ruins. The ruins are what remain of a two- to three-story pueblo inhabited for about 300 years (1300–1600 A.D.), containing as many as 1,000 rooms.Footnote 2 The Pueblo occupants are believed to have created many of the petroglyphs stretching along the escarpment down to the base of the Piedras Marcadas and Boca Negra canyons.
Petroglyph images.

The petroglyph monument site has become a popular site for visitation and attracted an estimated 115,000 regional visitors in 2008. The household production framework explains visitor demand for the site as depending foremost on the site characteristics that motivate visitation choices. For example, visitors of the Petroglyph National Monument consistently give top ranking to the unique opportunities to ‘learn about history and culture’ and engage in ‘outdoor recreation’.Footnote 3 The present study maintains that households derive their demand for these recreational services by treating rock art and open space land as public-good inputs in the production of recreational activities, such as leisure hiking and viewing petroglyph images or other archeological items.
In addition the monument site may also generate nonuse values common to other protected natural areas. The key nonuse benefits of interest are the existence and bequest values associated with preserving petroglyph images. Furthermore, nonuse benefits in the form of option and quasi-option values may arise from preserving in situ resources for future exploration or scientific discovery (Krutilla, Reference Krutilla1967). Consequently nonuse values are distinguished from recreational values in that they are derived from the existence of natural environments and the preservation of their unique attributes.
In this paper a household production framework is used to motivate the demand for a cultural heritage site based on recreational and nonuse values. Empirical estimates of the underlying recreational and nonuse values are obtained using benefit-transfer methods and source studies by Bergstrom and Cordell (Reference Bergstrom and Cordell1991), Boxall et al. (Reference Boxall, Englin and Adamowicz2003), and Rolfe and Windle (Reference Rolfe and Windle2003, Reference Rolfe, Windle, Rolfe and Bennett2006).Footnote 4 The study of Bergstrom and Cordell (Reference Bergstrom and Cordell1991) used the data from the 1989 Public Area Recreational Visitors Survey (PARVS) to estimate a zonal travel cost (TC) model. The authors obtained a measure of the WTP for a single destination trip of day hiking. The study of Boxall and colleagues (Reference Boxall, Englin and Adamowicz2003) estimated single-trip random utility models, using a combination of revealed preference (RP) and stated preference (SP) data.Footnote 5 Parameter estimates from this study measure the WTP by recreationists for viewing petroglyph images of varying quality. Finally, the studies of Rolfe and Windle (Reference Rolfe and Windle2003, Reference Rolfe, Windle, Rolfe and Bennett2006) used a choice model experiment to measure the WTP of various stakeholder groups to preserve petroglyph images situated on private- and common-property land. The present study relies on these source studies to estimate the net economic benefits for the petroglyph monument site.
The study proceeds as follows: Section 2 describes the household production framework and its empirical implementation in modeling demand for a cultural heritage site. The source studies and benefit-transfer methods used in the valuation problem are described in section 3. The benefit-transfer estimates obtained in the study are reviewed in section 4. Section 5 discusses policy implications for cost-benefit analysis at cultural heritage sites. Section 6 concludes.
2. Household production framework
Following Smith (Reference Smith1989) the demand for a recreational site can be derived through the following household production framework:


Household utility (1) is specified as a function of recreational services from visiting the site (Sr ) and non-recreational services from knowing the site exists (S 0). Equation (2) specifies the production function for recreational services, where Xr denotes market-purchased goods; vk denotes visits to multiple sites (k = 1, . . ., D); and tk l denotes on-site visitation times (l = 1, . . ., υ l ). Equation (3) specifies household expenditures on goods used to produce recreational and non-recreational services, depending on market prices p r ,pj . Equation (4) defines the household's wage and non-wage incomes.
The travel costs to any given site are assumed to include both vehicle-related costs cdk
(dollars per mile travelled times round-trip mileage to site k) and forgone income from travel and on-site visitation  , (valued at the market wage). Thus aggregate travel costs are specified by
 . As such the household's budget constraint is formulated assuming ‘full income’
 is allocated between market-purchased goods and aggregate travel costs:

Our empirical implementation of the household production framework model applies benefit-transfer valuation to estimate benefits from recreational and non-recreational services from a single site (k = 1), with visits of equal duration  . We assume the production of recreational services does not require market-purchased goods (Xr
= 0) and that travel and on-site visitation times are valued at the market wage (r = w). Under these simplifying assumptions we measure benefits derived from recreational and non-recreational services using benefit-transfer analysis.
3. Benefit-transfer source studies
Benefit-transfer valuations can be applied using estimated benefit functions from source studies or point-value estimates of selected WTP parameters. Depending on the method taken, various steps are involved in the application as described in Desvousges et al. (Reference Desvousges, Naughton and Parsons1992), Morrison (Reference Morrison, Bennett, Blaney and Louviere2002), and Rosenberger and Loomis (Reference Rosenberger, Loomis, Champ, Boyle and Brown2003). These steps include (i) defining the policy change under consideration at the target site and the related site characteristics, (ii) reviewing the literature for original research studies for relevance and suitable methodology, (iii) gathering data for the target site corresponding to the explanatory variables considered in the source studies, (iv) predicting benefit values for the target site using site-specific data and parameter estimates from the source studies, and (v) checking if the predicted values meet prescribed criteria.
With regard to (ii), Rosenberger and Loomis (Reference Rosenberger, Loomis, Champ, Boyle and Brown2003) surveyed the literature of outdoor recreational use values, while Navrud and Ready (Reference Navrud and Ready2002) surveyed studies specific to cultural and historical resources. The present study draws from this literature in estimating benefit values for the Petroglyph National Monument. Specifically, we use parameter estimates from Bergstrom and Cordell (Reference Bergstrom and Cordell1991) and Boxall et al. (Reference Boxall, Englin and Adamowicz2003) to measure recreational benefits from day hiking and viewing petroglyphs, and we use parameter estimates from Rolfe and Windle (Reference Rolfe and Windle2003, Reference Rolfe, Windle, Rolfe and Bennett2006) to measure nonuse benefits of preserving the cultural heritage site. The key elements of the source studies are summarized below.
3.1. Source study 1
Bergstrom and Cordell (Reference Bergstrom and Cordell1991) estimated the consumer's surplus (CS) of day hiking on public lands using a zonal travel cost analysis, wherein expenditures in traveling to a site influence the number of visits and thereby the value of on-site benefits.Footnote
6
The general procedure classifies visitors according to the distance travelled to the site (distance zones). Visitors from a given zone i are assigned demand functions of the form  , where ν
i
denotes visits from zone i; TCi
denotes travel cost from zone i to the site; and
 is a vector of explanatory variables measured at their mean values. The authors specified the zonal travel cost model as

The model predicts that the number of trips from zone i depends on the cost of trips (TC i ), population size (Pop i ), site qualities (Suit), the availability of substitute recreational opportunities (Subs), the percentage of the population aged 18–32 in zone i (Pct18 i ), and the percentage of the zone i population with annual income of at least 30,000 dollars (Inc i ). The authors used ordinary least squares to estimate the model across multiple US sites and counties using RP data collected from on-site interviews of recreationists, as reported in the PARVS.
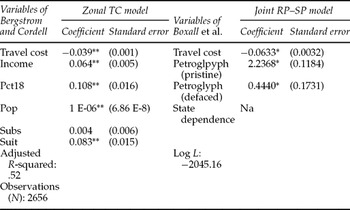
Table 1 reports the parameter estimates and regression statistics for the zonal travel cost model. All of the regression coefficients are statistically significant at the 1 per cent level (denoted by **). The travel cost coefficient has the appropriate negative sign, consistent with positive marginal utility of income. The marginal value of day hiking can thus be measured using a ‘part-worth’ formula, defined by the negative inverse of the travel cost coefficient:

The part-worth value of 25.64 dollars represents a recreational visitor's WTP for additional hiking at a public site. We rely on this estimate in the benefit-transfer analysis in section 4.1.
Parameter estimates from Bergstrom and Cordell (Reference Bergstrom and Cordell1991) and Boxall et al. (Reference Boxall, Englin and Adamowicz2003)

Sources: Boxall et al. (Reference Boxall, Englin and Adamowicz2003, table 2, p. 224), where * indicates significance at the 0.05 level or beyond, and Bergstrom and Cordell (Reference Bergstrom and Cordell1991, table 2, p. 77), where ** indicates significance at the 0.01 level.
3.2 Source study 2
Boxall and colleagues (Reference Boxall, Englin and Adamowicz2003) were the first in the literature to provide welfare metrics for pictographs (rock drawings) and petroglyphs (rock carvings) in a recreational setting. The authors examined the choice behavior of recreationists (canoeists) in viewing these Aboriginal images at the Nopiming Provincial Park in central Manitoba, Canada.Footnote 7 The state-of-the-art application combines RP and SP data for the same individuals.
The RP data identifies the choice of canoe routes (eight alternatives) without accounting for rock paintings (new attribute). The SP identifies the choice to view pictograph/petroglyph images by choosing among alternative canoe routes (Seagrim Lake or Manigotagan River routes). Canoeists were shown a picture of a pictograph in pristine condition and asked if they would change routes to view the rock art. If so, the respondents were shown a picture of a vandalized image and asked if they would still change routes. These responses yield data on the choice of viewing pristine and defaced images in a recreational context (data sets SP1 and SP2).
The authors noted that the key empirical issue in pooling the RP and SP data is accounting for the potential dependence between an individual's RP and SP responses. Various specifications of the pooled preference model are estimated to account for potential state dependence and correlation. For the purpose of transferring recreational use values to the study site we rely on the simplest joint model, which assumes no state dependence or correlation between an individual's RP and SP responses. Accordingly, the recreational choice parameters (β m , γ, α) are estimated in the following multinomial logit (MNL) models:


Table 1 reports the parameter estimates of Boxall and coworkers (Reference Boxall, Englin and Adamowicz2003) for the joint independent RP–SP model. The regression coefficients are statistically significant at the 5 per cent level or better (denoted by *). The travel cost coefficient has a negative sign, consistent with positive marginal utility of income. The coefficients for pristine pictograms have positive signs, and the difference in their magnitude indicates that the choice probability of a recreational trip increases more for higher quality images. The parameter estimates allow calculation of the marginal value of pictograms using ‘part-worth’ formulas, representing the marginal rate of substitution between income changes and the cultural site attribute. These welfare metrics are measured by the ratio of the pictograph/cost coefficients:

The part-worth values indicate that the cultural attribute raises the value of the recreational trip by 35.34 dollars for pristine images compared with 7.01 dollars for defaced images. We rely on these estimates in the benefit-transfer analysis in section 4.1.
3.3. Source study 3
Rolfe and Windle (Reference Rolfe and Windle2003, Reference Rolfe, Windle, Rolfe and Bennett2006) estimated WTP to protect Aboriginal cultural sites containing rock art in the Fitzroy Basin in central Queensland, Australia. The study is motivated by potential water resource development in some parts of the Fitzroy river basin, which extends over 142,000 km2 containing some 312 rock art places and many other cultural sites (L'Oste-Brown et al., Reference L'Oste-Brown2001). Approximately 15.5 per cent of the cultural sites are situated in national parks or state forests and timber reserves. The remaining sites are located on private property belonging to landholders and commercial developers.
The study collected SP information from three groups of stakeholders: Aboriginal people in Rockhampton (regional) and general populations in Rockhampton (regional) and Brisbane (urban). The cultural heritage and opportunity cost information identifies ‘the percentage of Aboriginal sites protected’ and the amount that households would pay in extra rates (or rent) each year to fund improvements’. The authors estimated MNL models in which the cultural attribute is measured by a single variable (linear continuous) and an alternative specification measuring the attribute using multiple variables (nonlinear discrete). The MNL models have the following general forms and are estimated (independently) for the various stakeholder groups:


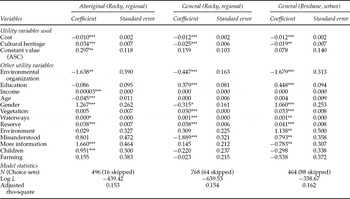
Table 2 reports the full set of parameter estimates for the sample populations using a single variable to measure the cultural attribute (site protection). All of the opportunity cost coefficients are statistically significant at the 1 per cent level and negatively signed (implying positive marginal utility of incomes). The site protection coefficients are significant at the 1 or 5 per cent levels, with a positive sign for the Aboriginal community and negative signs for the general populations. Consequently, the results show a stark difference in collective choice behavior: the Aboriginal community is willing to pay to protect cultural heritage sites, while the general populations require compensation.Footnote 8
Rolfe and Windle (Reference Rolfe and Windle2003, Reference Rolfe, Windle, Rolfe and Bennett2006) MNL parameter estimates

*Significant at the 10% level; **significant at the 5% level; ***significant at the 1% level.
Source: Rolfe and Windle (Reference Rolfe and Windle2003, table 4, results of MNL models, p. S92).
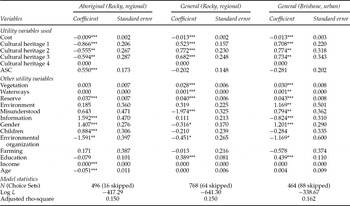
Table 3 reports parameter estimates for the sample populations using multiple variables to measure the cultural attribute. The alternative specification yields the testable implication that the marginal opportunity costs of site protection are nonlinear, with respondents preferring relatively higher levels of site protection.Footnote 9 This conjecture is supported for the Aboriginal community by the negative signs for the attribute coefficients, signaling their preference for maximum site protection relative to lower levels of protection. On the contrary, the attribute coefficients for the general populations have positive signs, implying that maximum protection is least preferred relative to the lower levels of protection.
Rolfe and Windle (Reference Rolfe and Windle2003, Reference Rolfe, Windle, Rolfe and Bennett2006) MNL parameter estimates

*Significant at the 10% level; **significant at the 5% level; ***significant at the 1% level.
Source: Rolfe and Wilde (Reference Rolfe and Windle2003, table 6, p. S94).
Table 4 calculates part-worth values using parameter estimates from the single-level and multilevel MNL specifications. The part-worth values for the single-level models indicate the Aboriginal community is willing to pay 3.30 dollars for each 1 per cent increase in site protection, while the general populations require compensation of 2.08 dollars (Rockhampton) and 1.58 dollars (Brisbane) for each 1 per cent increase in site protection. Meanwhile, the part-worth values for incremental changes in protection levels show the Aboriginal community is willing to pay 60 dollars to increase site protection to the maximum level, while the general populations require compensation of 52 dollars (Rockhampton) and 56 dollars (Brisbane) to accept the maximum protection level.
Part-worth values of cultural site protection (Rolfe and Windle, Reference Rolfe and Windle2003, Reference Rolfe, Windle, Rolfe and Bennett2006)

Source: Rolfe and Windle (Reference Rolfe and Windle2003).
The welfare metrics give contrasting estimates of benefit values for protecting cultural sites. One explanation for the difference in choice behavior concerns the perception of property rights. In a personal comment to the authors Rolfe noted that ‘the Aboriginal people have nothing to lose (from increased site protection), but increased protection may mean for the general population that their rights are diminished’.
4. Benefit-transfer valuation
Several steps are required in transferring benefit values from the source sites to the target site. Recreational use values at the target site are calculated using current recreational visitor data along with WTP estimates from Bergstrom and Cordell (Reference Bergstrom and Cordell1991) for day hiking on public lands and WTP estimates from Boxall et al. (Reference Boxall, Englin and Adamowicz2003) for recreational viewing of petroglyph images (pristine and defaced). Nonuse values at the target site are calculated using WTP values from Rolfe and Windle (Reference Rolfe and Windle2003, Reference Rolfe, Windle, Rolfe and Bennett2006) adjusted for differences in site-attribute protection levels and population characteristics.
Recreational value. The National Park Service (NPS) estimates some 115,000 actual recreational visits were made to the study site in 2008. Moreover, NPS projects that the regional-domestic market will encompass approximately 1,045,000 potential visitors in 2010, with an average drive time of 4.41 h (National Park Service, 1996: 490–491). These parameters correspond to a geographic area approximating the size of the state of New Mexico. The statewide area contains several substitute sites with similar characteristics as the Petroglyph monument site – the Bandelier National Monument, Chaco Historical Park, Wipathki National Monument, and Mesa Verde National Park in nearby Colorado.Footnote 10
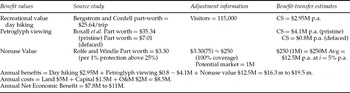
We calculate the net economic benefits from day hiking at the study site using estimated visitation levels for 2008 and per person CS estimates from Bergstrom and Cordell (Reference Bergstrom and Cordell1991), yielding a recreational use value of the order of 2.95M million dollars per year: 115,000 visitors per year × 25.64 dollars per visit. This estimate does not account for petroglyph images as a source of value. Based on the part-worth values from Boxall et al. (Reference Boxall, Englin and Adamowicz2003), the petroglyphs increase the value of the recreational trip by about 4 million dollars for pristine images and a little under 1 million dollars for defaced images: 115,000 visitors per year × 35.34 or 7.01 dollars. Consequently, the total recreational use value of the cultural heritage site is between 3.75 million and 7 million dollars per year, depending on individual perceptions of the quality of the petroglyph images.
Nonuse value. Since the target site is a designated national monument there is a strong presumption that it provides nonuse values by preserving common-property resources for the benefit of the present and future generations. Our estimate of the WTP to preserve the monument site is based on the parameter estimates from Rolfe and Windle (Reference Rolfe, Windle, Rolfe and Bennett2006) specific to the indigenous community. A problematic issue is the difference in protection levels at the target site compared to the source site. The target site is completely protected, while the source site assumes 25 per cent protection in the base case that increases to 55 per cent in the changed situation. Moreover, the survey instrument in the source study states that the cultural sites would be protected in 15 years’ time (Rolfe and Windle, Reference Rolfe, Windle, Rolfe and Bennett2006: 225). Consequently, individual respondents may discount the value of these benefits in stating their choice behavior given the protective measures take effect 15 years in the future. Given these conditions various assumptions and adjustments are applied in transferring the parameter estimates from the source study to the target site.
First, we assume petroglyph sites are homogeneous. Consequently, protecting a percentage of sites in the source study is equivalent to protecting the same percentage of the target site. Second, we assume the relationship between WTP and site protection is linear homogeneous. Consequently, the part-worth value is scaled up from 3.30 dollars per 1 per cent increase in site protection beyond 25 per cent to 247.50 dollars for complete preservation. Finally, to estimate the number of households in the potential statewide market, we rely on US census projections for 2010. These projections indicate a potential market of 1,045,684 households by 2010 (National Park Service, 1996: 281). Consequently, the benefit-transfer estimate of nonuse value is roughly 250 million dollars in 2008 (3.30 dollars × 75 × 1 million) or equivalent to 12.5 million dollars per year at a discount rate of 5 per cent (0.05 × 250 million dollars). At best this estimate should be regarded as a ballpark measure. For this reason, we ignore the issue of discounting, since this adjustment would suggest an unfounded degree of accuracy (Kneese, Reference Kneese1984).
5. Policy implications
In the United States cost-benefit analysis of cultural heritage sites may be prescribed through various presidential executive orders and federal laws.Footnote 11 For example, Executive Order 11,593(3) seeks ‘protection and enhancement of the cultural environment’. The order requires US federal agencies to manage their policies, plans, and programs so as to ‘preserve, restore and maintain federally owned sites, structures, and objects of historical or archeological significance’.Footnote 12 Cultural sites are also protected under federal laws. For instance the American Antiquities Preservation Act of 1906 seeks to ‘protect historic and prehistoric ruins, monuments, and antiquities, including paleontological resources, on federally controlled lands’.Footnote 13 Similarly, the Historic Sites Act of 1935 calls for preserving historic sites for the ‘inspiration and benefit of United States’ citizens’,Footnote 14 while the National Historic Preservation Act of 1966 provides for the nomination/placement of sites on the National Register of Historic Places (NPS, 1988).Footnote 15
A complete cost-benefit analysis at any of the above sites would consider all of the values at stake in weighing resource allocation decisions. A partial analysis may be more feasible, given the limitations or absence of cost-benefit information. Toward this end the present study suggests the use of benefit-transfer methods to assess nonmarket values. The method simplifies the assessment of benefits that can be reasonably valued at the target site using previous estimates obtained in similar situations. The partial analysis also requires identification of essential cost elements at the target site in weighing economic decisions. Below we summarize various costs that seem pertinent in the present case study. We focus on land acquisition costs and to a lesser extent on the capital costs of visitor facilities and the operation–maintenance costs of providing visitor services.Footnote 16
Land acquisition cost. The monument site encompasses some 7,240 acres. Nearly half of the acreage was purchased from private owners between 1991 and 2000. Real estate appraisal records of the city of Albuquerque and NPS indicate the majority of land acquisitions (some 3,500 acres) were made by the federal government in the 5,200-acre Atrisco unit. First in line to be purchased were those properties that had ‘really outstanding petroglyph and archeological values’. Additional land purchases were made by the state government (141 acres) in the 215-acre Boca Negra unit, of which 74 acres were previously owned by the city of Albuquerque (National Park Service, 1991).Footnote 17
In 1990 the acquisition process was expected to take between 6–10 years at a cost of 90 million dollars – approximately 25,000 dollars/acre (Albuquerque Journal, 1991). Actual appraisals used ‘fair market valuation’, giving a WTP measure of value. Some appraisals assigned per-acre values of 59,000 dollars or higher, particularly in later years. Closer inspection of the records show compensation to landowners varied according to the date of purchase, with the median acquisition cost of private land being about 35,000 dollars per acre (in 1992 dollars). Applying the median acquisition cost of private land (35,000 dollars per acre, in 1992 dollars) to the entire 7,240-acre site implies land costs of the order of 250 million dollars, equivalent to annual rents of 12.5 million dollars using a 5 per cent discount rate (0.05 × 250 million dollars). The actual land purchases costs are closer to 100 million dollars, equivalent to land rents of 5 million dollars per year (0.05 × 100 million dollars).
Capital and operating costs. The Monument site includes a visitor's center, user facilities, and a network of trails that must be maintained. Furthermore, administrative staff and personnel provide a variety of services to the visiting public. Budgetary records indicate the annualized costs of capital are approximately 1.5 million dollars, while annual operation and maintenance costs are of the order of 2 million dollars (National Park Service, 1996: 97). Currently there are no entrance fees to the study site that would offset these costs.
6. Concluding remarks
Table 5 provides a summary of the more accessible cost-benefit values for the Petroglyph National Monument. The study site illustrates some of the unique benefits and costs attending the preservation of cultural resource sites. The estimated annual benefits from combining recreational and nonuse values amount to between 16.3 million dollars and 19.5 million dollars per year. This estimate is based on well-established methods used in assigning benefit values to nonmarket goods having potential positive social impacts to both the present and future generations. Meanwhile, the estimated annual costs of the monument site are approximately 8.5 million dollars, including land rents. These expenditures represent a significant public investment in preserving/promoting a cultural heritage asset, one that seems efficient, in the sense of yielding net economic benefits of 7.8–11 million dollars per year. However the potential errors in benefit-transfer applications are a concern in drawing such a conclusion.
Summary of benefit-cost results

Transfer errors reflect the differences between the transferred value estimates from the source sites and the true (unknown) value estimates at the policy site (Rosenberger and Phipps, Reference Rosenberger and Phipps2001). Because the transfer involves different sites and goods, population groups, and time, the resulting margin for error is nontrivial. Efforts to reduce measurement errors may include extending the limited number of source studies and focusing on source studies in which the environmental amenity exhibits a greater degree of homogeneity between the source and target sites. Nonetheless, transfer errors of 40–50 per cent are not uncommon (Navrud and Ready, Reference Navrud and Ready2007). In the present study a 50 per cent margin of error would suggest annual recreational and nonuse benefits of the order of 8.2–9.8 million dollars per annum compared to annual costs of 8.5 million dollars per annum.
A more complete cost-benefit analysis would include other elements affecting stakeholders, such as the effects of public investments on land values near the target site and the collection of associated property taxes. In the present study public investment in land (open space) occurred in areas that now incorporate relatively high-income neighborhoods, and casual observation suggests urban property nearest to the site increased in value both during and after the land purchase period. These observations suggest that stakeholders who benefit from such external impacts may motivate cultural land-use alternatives at other sites, depending on the approach taken in compensating current landowners and the reassignment of property rights in securing the needed open space for cultural monument sites. Furthermore, the costs of preserving some sites may even be self-financed through incremental property-tax revenues. These issues seem worthy of further attention in the cost-benefit analysis of cultural heritage sites.Footnote 18