



1 Introduction
Our current understanding of fluid turbulence is based fundamentally on the work of Richardson (Reference Richardson1922) and Kolmogorov (Reference Kolmogorov1941). They laid the foundations for the modelling of physical processes, with the
 $k^{-5/3}$
power-law scaling of the energy spectrum being the most important prediction.
Richardson’s idea of an energy cascade is such that energy is transferred from the large scales through a multi-stage process to the smallest scales, where it is eventually dissipated by viscous processes. But this is not strictly true as energy may also travel from the small to the large scales. Kraichnan (Reference Kraichnan1967) showed that there is an inverse cascade in two-dimensional turbulence, and Piomelli et al. (Reference Piomelli, Cabot, Moin and Lee1991) observed backward transfer even in isotropic three-dimensional turbulence.
Kolmogorov’s theory is based on the hypothesis that the small scales are statistically isotropic and independent of the large-scale forcing. Deviations from Kolmogorov’s hypotheses were found in numerical simulations (Yeung & Brasseur Reference Yeung and Brasseur1991; Ishihara, Yoshida & Kaneda Reference Ishihara, Yoshida and Kaneda2002; Elsinga & Marusic Reference Elsinga and Marusic2016) and experiments (Shen & Warhaft Reference Shen and Warhaft2000; Voth et al. Reference Voth, La Porta, Crawford, Alexander and Bodenschatz2002). The Kolmogorov postulate of local isotropy may be violated and is believed not to apply even at high Reynolds numbers (Shen & Warhaft Reference Shen and Warhaft2000). Yeung & Brasseur (Reference Yeung and Brasseur1991) conclude that small-scale anisotropy is generated by direct interaction of low and high-wavenumber modes due to non-local triad interactions.
We investigate the coupling of different scales of motion by generating a defined anisotropy at the smallest (molecular) scales and probing the resulting velocity statistics at the larger scales. Anisotropy is generated using a paramagnetic colloid whose viscosity depends both on the direction and magnitude of an external magnetic field. Our approach is thus fundamentally different from other experiments studying anisotropic turbulence where anisotropy is produced for example by rotation (Lamriben, Cortet & Moisy Reference Lamriben, Cortet and Moisy2011), mean velocity gradients (Shen & Warhaft Reference Shen and Warhaft2000) or by modulation of many mixers inside a flow chamber (Chang, Bewley & Bodenschatz Reference Chang, Bewley and Bodenschatz2012). Uniform magnetic field forcing has so far been used primarily in studies on the global evolution of laminar and transitional flows (Altmeyer et al. Reference Altmeyer, Hoffmann, Leschhorn and Lücke2010; Reindl & Odenbach Reference Reindl and Odenbach2011).
Another investigative route being followed is the study of the energy transfer in flows with long chained polymers. An influence on the smallest scales can be observed while the spatial isotropy does not appear to be modified in such flows (Ouellette, Xu & Bodenschatz Reference Ouellette, Xu and Bodenschatz2009).
Sketch of the experimental set-up. The magnetic field is applied in the transverse direction along
 $x_{1}$
.

2 Experimental set-up
The design of the experiment was driven by several considerations and constraints. First, a flow was sought that exhibits strong and preferably isotropic turbulence with statistically stationary behaviour. Next, the shape of the flow cell had to be sufficiently compact so as to limit the size of the magnetic field-generating coils. Furthermore, a recirculating arrangement was preferred because it could reduce the amount of magnetic fluid required. Finally, the magnetic fluid had to have a sufficiently strong field response (i.e. saturation magnetisation), a low bulk viscosity and the ability to form particle chains as the primary source of induced anisotropy on the molecular scale.
The following sections present a brief overview of the experimental set-up with further technical details provided in the appendices.
2.1 Flow cell and magnetic field
We create a highly turbulent flow in a cylindrical container driven by two counter-rotating discs. The container has an inner radius of
 $R=5~\text{cm}$
and is mounted vertically. The discs are spaced 10 cm apart and are fitted with 8 straight blades (figure 1). This flow topology, known as von Kármán flow, is widely used in experiments on turbulent flows (Douady, Couder & Brachet Reference Douady, Couder and Brachet1991; Maurer, Tabeling & Zocchi Reference Maurer, Tabeling and Zocchi1994; Voth et al.
Reference Voth, La Porta, Crawford, Alexander and Bodenschatz2002; Ravelet et al.
Reference Ravelet, Marié, Chiffaudel and Daviaud2004). The flow is globally non-isotropic, and homogeneity applies only in the centre of the flow cell. Due to topological symmetry there is isotropy in the transverse directions, the plane in which we apply the uniform magnetic field. The coordinate system in the flow cell is defined such that the
 $x_{1}$
–
 $x_{2}$
plane is in the transverse direction and
 $x_{3}$
defines the axial direction.
The magnetic field is applied in the direction of
 $x_{1}$
. It is very homogeneous over the volume of the flow cell (figure 2). We modelled the field using the formulas of Conway (Reference Conway2006) and compared it with the measured values. As the results compare well with the measured magnetic field, the model can be used to estimate the field homogeneity over the whole flow cell, and the field is found to be uniform to within
 ${\rm\Delta}B/B_{centre}=1500~\text{ppm}$
.
Axial magnetic field component generated by three coils, (a) along the axis, (b) transverse at mid-height. The solid line shows the modelled magnetic field. Vertical dashed lines indicate the boundaries of the test cell.

Properties of ferrofluid composed of spherical magnetic silica particles.

2.2 Magnetic fluid
The experiments were conducted with an aqueous ferrofluid whose properties are summarised in table 1.
Under zero magnetic field, the fluid behaves as purely Newtonian with density
 ${\it\rho}_{f}=1.0144~\text{g}~\text{cm}^{-3}$
and viscosity
 ${\it\eta}_{0}=3~\text{mPa}~\text{s}$
, values that are similar to those of water. Under the influence of an external magnetic field, the particles in the fluid form short linear chains which are preferentially aligned in the field direction. The resulting anisotropic response to shearing motions and its impact on the flow can be conceptualised by a direction dependent viscosity (Ericksen Reference Ericksen1960; Leslie Reference Leslie1966; Ilg & Kröger Reference Ilg and Kröger2002).
We measured the viscosity using a parallel-plate rheometer with the magnetic field perpendicular to the shearing motion. The fluid viscosity is a function of shear rate (figure 3
a) and magnetic field (figure 3
b). The increase in viscosity with magnetic field has been investigated thoroughly (Odenbach Reference Odenbach2004). In figure 3(b) we show this increase for a shear rate of
 $100~\text{s}^{-1}$
, which is considerably lower than in the actual experiments. According to simulations (Sreekumari & Ilg Reference Sreekumari and Ilg2015) and experiments (Linke & Odenbach Reference Linke and Odenbach2015) of similar chain-forming fluids this viscosity effect is truly anisotropic. The viscosity decrease with increasing shear rate, known as shear thinning, is caused by shear forces that limit the chain length.
(a) Dynamic viscosity of the ferrofluid as a function of shear rate at different external magnetic field magnitudes and (b) as a function of external magnetic field magnitude for a shear rate
 $\dot{{\it\gamma}}=100~\text{s}^{-1}$
.

The observed shear thinning has an influence on the achievable viscosity anisotropy. Since the time scales of the turbulent flow are much shorter than the relaxation time scale of chain formation (Borin et al. Reference Borin, Zubarev, Chirikov, Müller and Odenbach2011), the chain length is ultimately determined by the maximum shear rate in the flow cell which is reached near the rotating discs rather than the local shear rate values.
As the fluid is non-conducting there is no magnetic induction and hence no additional bulk force acting on the fluid. A similar rheological anisotropy can be created in some types of liquid crystals, whose flow behaviour is well understood. However, for viscosity-induced effects in liquid crystals, much higher magnetic fields are required as compared to ferrofluids and the higher viscosity makes the creation of a turbulent flow more difficult.
2.3 Flow velocimetry
Since ferrofluids are opaque at optical wavelengths, the flow velocities were measured using ultrasound velocimetry techniques.
As we are primarily interested in the influence of anisotropic small scales on the turbulence cascade, we have to use a measurement technique capable of fully resolving all scales of turbulent motion. Standard ultrasound Doppler velocity profiling (UVP) based on a pulse-echo technique is not suitable because of the highly transient nature of the turbulent flow that has to be sampled with sufficient temporal resolution. The flow fluctuates on time scales down to the Kolmogorov time
 ${\it\tau}_{{\it\eta}}=4.2~\text{ms}$
.
In addition to UVP we thus use a technique based on continuous ultrasound recording, similar to the one developed by Mordant et al. (Reference Mordant, Metz, Pinton and Michel2005). This is a time resolved measurement technique that tracks the continuous Doppler-shifted scattering signals of tracers moving in the observation volume. Since single tracer particles are being followed in the flow, the technique belongs to the class of Lagrangian particle tracking methods.
The fluid is seeded with a small number of spherical polystyrene particles with a diameter of
 $d=250~{\rm\mu}\text{m}$
and a density of
 ${\it\rho}_{p}=1.04~\text{g}~\text{cm}^{-3}$
. As the particle size is not much larger than the Kolmogorov microscale (
 $d/{\it\eta}=2.2$
), tracer-like behaviour can be expected (Brown, Warhaft & Voth Reference Brown, Warhaft and Voth2009). Magnetophoretic forces on the tracer particles are negligible due to the very small magnetic field gradients in the flow cell.
Even though not universally applicable for resolved turbulence measurements, UVP can still provide valuable information about the flow in the test cell. Profiles of the velocity component along different observation directions were recorded with such a system, providing data on the ‘slow’ spatial modes developing in the flow cell and changing under the action of the magnetic field.
3 Flow characterisation in the field-free case
As both the measurement technique and the fluid are not used in a standard fashion, we first investigate the flow properties without magnetic field and a disc rotation rate of
 $f=3~\text{Hz}$
to show that the fluid behaves in a Newtonian manner and that the flow exhibits proper statistical features. The integral Reynolds number, defined as
 $Re=2{\rm\pi}f\,R^{2}/{\it\nu}\simeq 1.6\times 10^{4}$
, is well above the transitional Reynolds number, and the flow is in the fully turbulent state (Ravelet, Chiffaudel & Daviaud Reference Ravelet, Chiffaudel and Daviaud2008). Table 2 summarises the basic parameters of our flow. These parameters are further discussed in the following sections.
Basic parameters of the turbulent flow for a disc rotation rate of 3 Hz:
 $R_{{\it\lambda}}$
is the Taylor microscale Reynolds number,
 $u_{rms}=\sqrt{\langle u_{i}u_{i}\rangle /3}$
is the r.m.s. velocity,
 ${\it\varepsilon}\approx -\langle u_{i}a_{i}\rangle$
is an estimate of the energy dissipation rate,
 ${\it\eta}$
and
 ${\it\tau}_{{\it\eta}}$
are the Kolmogorov length and time scales,
 $T_{L}$
is the Lagrangian integral time scale as given by the autocorrelation function,
 $T_{K}\equiv (1/2)\langle u_{i}u_{i}\rangle /{\it\varepsilon}$
is the turbulence time scale, and
 ${\rm\Delta}t$
is the effective time resolution of the frequency tracking algorithm.

3.1 Velocity probability distribution
Figure 4 shows the probability density function of the 3 Lagrangian velocity components in the field-free case. The transverse components exhibit similar statistics as expected from symmetry. The transverse components show a larger standard deviation than the axial component. The probability density functions are close to Gaussian with a kurtosis of 2.7 for the transverse components and 3.7 for the axial component. The kurtosis of the transverse components is in agreement with Voth et al. (Reference Voth, La Porta, Crawford, Alexander and Bodenschatz2002), while for the axial component the kurtosis is slightly larger.
The velocity PDF at zero field.
 $u_{1}$
and
 $u_{2}$
are two orthogonal transverse velocity components and
 $u_{3}$
is the axial velocity component.

3.2 Second-order structure function
The Lagrangian second-order structure function is defined as the variance of the Lagrangian velocity increments:
 $$\begin{eqnarray}D_{2}({\it\tau})\equiv \langle [u_{i}(t+{\it\tau})-u_{i}(t)]^{2}\rangle ,\end{eqnarray}$$
where
 $u_{i}(t)$
is one Lagrangian velocity component. The structure function of a transverse velocity component for the field-free case is shown in figure 5(a). It varies with
 ${\it\tau}^{2}$
in the dissipation range and approaches a constant value for long time lags. When scaled by
 ${\it\varepsilon}{\it\tau}$
, this should show a plateau in the inertial subrange. Very high Reynolds numbers are required to see this plateau so we can only see a peak. Nevertheless we can take the maximum value
 $C_{0}^{\ast }=\max \{D_{2}({\it\tau})/{\it\tau}{\it\varepsilon}\}$
and compare it with published values for comparable Reynolds numbers. Our value is
 $C_{0}^{\ast }=3.5\pm 0.3$
, which is somewhat smaller than reported values from numerical simulations with
 $C_{0}^{\ast }=4.4$
at
 $R_{{\it\lambda}}=140$
(Yeung, Pope & Sawford Reference Yeung, Pope and Sawford2006).
(a) Compensated Lagrangian second-order structure function as a function of normalised time and (b) Scaling of relative scaling exponents
 ${\it\zeta}_{p}^{L}/{\it\zeta}_{2}^{L}$
of the structure functions with structure function order
 $p$
. For comparison we show the data of Mordant, Lévêque & Pinton (Reference Mordant, Lévêque and Pinton2004b
) at
 $R_{{\it\lambda}}=810$
. The solid line shows the Kolmogorov (Reference Kolmogorov1941) prediction.

Higher-order moments of Lagrangian velocity increments are studied within the scope of Lagrangian intermittency. As the scaling range in Lagrangian structure functions is not established, the scaling of these structure functions is usually investigated by plotting them against the second-order structure function (extended self-similarity (Benzi et al.
Reference Benzi, Ciliberto, Tripiccione, Baudet, Massaioli and Succi1993)). To measure relative scaling exponents we fit power laws to the structure functions in the range where the second-order structure function shows a developing inertial range, in our case between
 $3{\it\tau}_{{\it\eta}}$
and
 $6{\it\tau}_{{\it\eta}}$
. Our structure functions show scaling similar to the findings of Mordant et al. (Reference Mordant, Lévêque and Pinton2004b
) (figure 5
b).
For a statistically stationary process the velocity autocorrelation function
 $R({\it\tau})$
is given through the second-order structure function
 $D_{2}({\it\tau})$
by
 $$\begin{eqnarray}\displaystyle R({\it\tau}) & \equiv & \displaystyle \langle u(t+{\it\tau})u(t)\rangle /\langle u^{2}\rangle\end{eqnarray}$$
 $$\begin{eqnarray}\displaystyle & = & \displaystyle 1-\frac{D_{2}({\it\tau})}{2\langle u^{2}\rangle }.\end{eqnarray}$$
The Lagrangian velocity autocorrelation function exhibits an exponential decay with a finite curvature at the origin. This function can be modelled with a second-order model (Sawford Reference Sawford1991) where
 $T_{L}$
is the Lagrangian integral time scale and
 $T_{2}$
is a time scale related to dissipation:
 $$\begin{eqnarray}R({\it\tau})=\frac{T_{L}\exp (-{\it\tau}/T_{L})-T_{2}\exp (-{\it\tau}/T_{2})}{T_{L}-T_{2}}.\end{eqnarray}$$
We fit this model between 0 and
 ${\it\tau}=10{\it\tau}_{{\it\eta}}$
and obtain the estimates for
 $T_{L}$
and
 $T_{2}$
given in table 2. The velocity autocorrelation function is biased for large times as a consequence of the finite measurement volume.
3.3 Accelerations
Accelerations are computed by convolving the velocity trajectories with a differentiated and truncated Gaussian kernel (Mordant, Crawford & Bodenschatz Reference Mordant, Crawford and Bodenschatz2004a
). The kernel width, which corresponds to the standard deviation of the Gaussian, is chosen as
 ${\it\tau}_{w}=0.25{\it\tau}_{{\it\eta}}$
. This is a compromise between achievable noise reduction and preserved signal bandwidth.
Lagrangian velocity autocorrelation function against normalised time. The marks show every 10th data point and the solid line is a fit of Sawford’s second-order model.

(a) The PDF of one transverse acceleration component normalised by its standard deviation. Accelerations are computed by convolving the velocity with a differentiated Gaussian with standard deviation
 $0.25{\it\tau}_{{\it\eta}}$
. For comparison the PDF of pressure gradients measured in a DNS at
 $R_{{\it\lambda}}=140$
(Vedula & Yeung Reference Vedula and Yeung1999) is shown. (b) The autocorrelation function of one acceleration component at zero field. The time lag is normalised by the Kolmogorov time
 ${\it\tau}_{{\it\eta}}$
and the correlation drops below zero around
 $2.2{\it\tau}_{{\it\eta}}$
.

Figure 7(a) shows the probability density function of one transverse acceleration component. It displays the well-known long tails. For comparison we show the pressure gradient PDF measured in a DNS of Vedula & Yeung (Reference Vedula and Yeung1999) for a similar Reynolds number. Our data follows their results very well.
The Heisenberg–Yaglom relation states
 $$\begin{eqnarray}\langle a^{2}\rangle =a_{0}{\it\varepsilon}^{3/2}{\it\nu}^{-1/2},\end{eqnarray}$$
with scaling constant
 $a_{0}$
. Using DNS and experimental data Sawford et al. (Reference Sawford, Yeung, Borgas, Vedula, La Porta, Crawford and Bodenschatz2003) parametrised the constant
 $a_{0}$
as
 $a_{0}=1.9R_{{\it\lambda}}^{0.135}/(1+85/R_{{\it\lambda}}^{1.135})$
. From our data we obtain
 $a_{0}=2.7\pm 0.2$
for one transverse acceleration component while the parametrisation gives a value of 2.64 for the given value of
 $R_{{\it\lambda}}$
.
Figure 7(b) shows the autocorrelation function of one transverse acceleration component. It has the typical shape with rapid decrease and negative values for long time lags. The zero-crossing time
 ${\it\tau}_{a}$
is
 $2.2{\it\tau}_{{\it\eta}}$
, consistent with Yeung & Pope (Reference Yeung and Pope1989).
Estimating energy dissipation is difficult using only single-particle statistics. Commonly one measures spatial second- or third-order velocity structure functions. These show a clear scaling in the inertial range from which
 ${\it\varepsilon}$
can be estimated. Relying on the acceleration of the trajectories we can instead use the trace of the acceleration–velocity covariance tensor of the fluid particle trajectories:
 $$\begin{eqnarray}{\it\varepsilon}=-\langle u_{i}a_{i}\rangle ,\end{eqnarray}$$
which is valid for decaying, homogeneous turbulence (Ott & Mann Reference Ott and Mann2005).
3.4 Spectra
The Lagrangian velocity spectrum
 $E^{L}({\it\omega})$
and acceleration spectrum
 $A^{L}({\it\omega})$
are given by the cosine transform of the respective autocovariance function (Sawford & Yeung Reference Sawford and Yeung2011).
 $$\begin{eqnarray}\displaystyle & \displaystyle E^{L}({\it\omega})=\frac{2}{{\rm\pi}}\int _{0}^{\infty }\langle u(t+{\it\tau})u(t)\rangle \cos ({\it\omega}{\it\tau})\,\text{d}{\it\tau} & \displaystyle\end{eqnarray}$$
 $$\begin{eqnarray}\displaystyle & \displaystyle A^{L}({\it\omega})=\frac{2}{{\rm\pi}}\int _{0}^{\infty }\langle a(t+{\it\tau})a(t)\rangle \cos ({\it\omega}{\it\tau})\,\text{d}{\it\tau}. & \displaystyle\end{eqnarray}$$
One may look at the frequency spectra to see if the scales are sufficiently separated (figure 8). As it is a log–linear plot, we multiply the spectra by
 ${\it\omega}$
to depict the energy at each scale. The acceleration spectrum peaks around the Lagrangian time microscale
 ${\it\tau}_{{\it\lambda}}$
while the most energetic eddies are found at the turbulence time scale
 $T_{K}$
. From the plot we conclude that there is a moderate overlap, representing neither a perfect separation of scales nor a significant coupling.
Lagrangian velocity and acceleration spectra normalised for unit area at
 $R_{{\it\lambda}}=120$
. The frequency is normalised by the Kolmogorov scale
 ${\it\omega}_{{\it\eta}}$
and
 ${\it\tau}_{{\it\lambda}}=\sqrt{2\langle u^{2}\rangle /\langle a^{2}\rangle }$
is the Lagrangian time microscale (Tennekes Reference Tennekes1975).

4 Flow modification with viscosity-induced anisotropy
The principal objective of this work is the study of viscosity-induced anisotropy of the flow. We present results again for a disc rotation rate of
 $f=3~\text{Hz}$
and external magnetic field magnitudes ranging from 0 to 90 mT. Table 3 summarises some flow parameters for each magnetic field magnitude. We sampled approximately
 $10^{4}$
trajectories per magnetic field setting. Both the r.m.s. velocity fluctuations and the energy dissipation remain approximately constant for all magnetic fieldmagnitudes.
We start our analysis with the Eulerian mean flow measurements as surveyed by the UVP and then proceed down to the smallest scales using the Lagrangian time series data.
Transverse profiles of mean velocity parallel to the field (a) and perpendicular (b) for magnetic field magnitudes from 0 to 50 mT.

Turbulence parameters for experiments with varying anisotropy.
 $\overline{u}$
is the mean velocity and
 $A=\langle u_{1}u_{1}\rangle ^{1/2}/\langle u_{2}u_{2}\rangle ^{1/2}$
is the ratio of the two transverse r.m.s. velocities.

4.1 Mean flow
Transverse mean velocity profiles in directions parallel and perpendicular to the field are shown in figure 9. At zero magnetic field, the profiles appear similar with only a small anisotropy. While the flow should be isotropic, this appears not to be unusual (Chang et al. Reference Chang, Bewley and Bodenschatz2012). The anisotropy arises most probably from small asymmetries in the flow cell.
The profiles show the typical inward directed radial flow due to the poloidal pumping mode of the large-scale motion in the cell. With increasing magnetic field, this inflow is enhanced in the field-parallel direction but leads to a flow reversal in the perpendicular direction.
More detailed insights can be gained from an analysis of the data based on the presumed existence of competing flow modes (Ravelet et al. Reference Ravelet, Marié, Chiffaudel and Daviaud2004; de la Torre & Burguete Reference de la Torre and Burguete2007). Using a k-means clustering approach, two distinct velocity patterns can be identified for both the field parallel and perpendicular transverse velocity profiles (figure 10 a,b). The mode shapes appear quite similar in both directions, but their occurrence is complementary. This is visualised in figure 10(c,d), where the probability of each mode occurring is plotted against the magnetic field magnitude. The probabilities were obtained by assigning each instantaneous profile to one of the two modes and counting the occurrences. For each magnetic field magnitude, two ensembles of 30 000 profiles were evaluated. In the field-free case these modes occur with near equal probabilities. The field-induced mode selection is quite apparent while the reason for the complementary behaviour requires a more detailed study. The effect may be a direct consequence of bulk turbulence modification by anisotropy, but other causes, e.g. changing wall boundary layers, cannot be excluded at present.
Mode selection in transverse velocity profiles. (a) Space–time diagram of velocity at zero field, (b) velocity modes, (c) mode probability parallel to magnetic field, and (d) mode probability perpendicular to magnetic field.

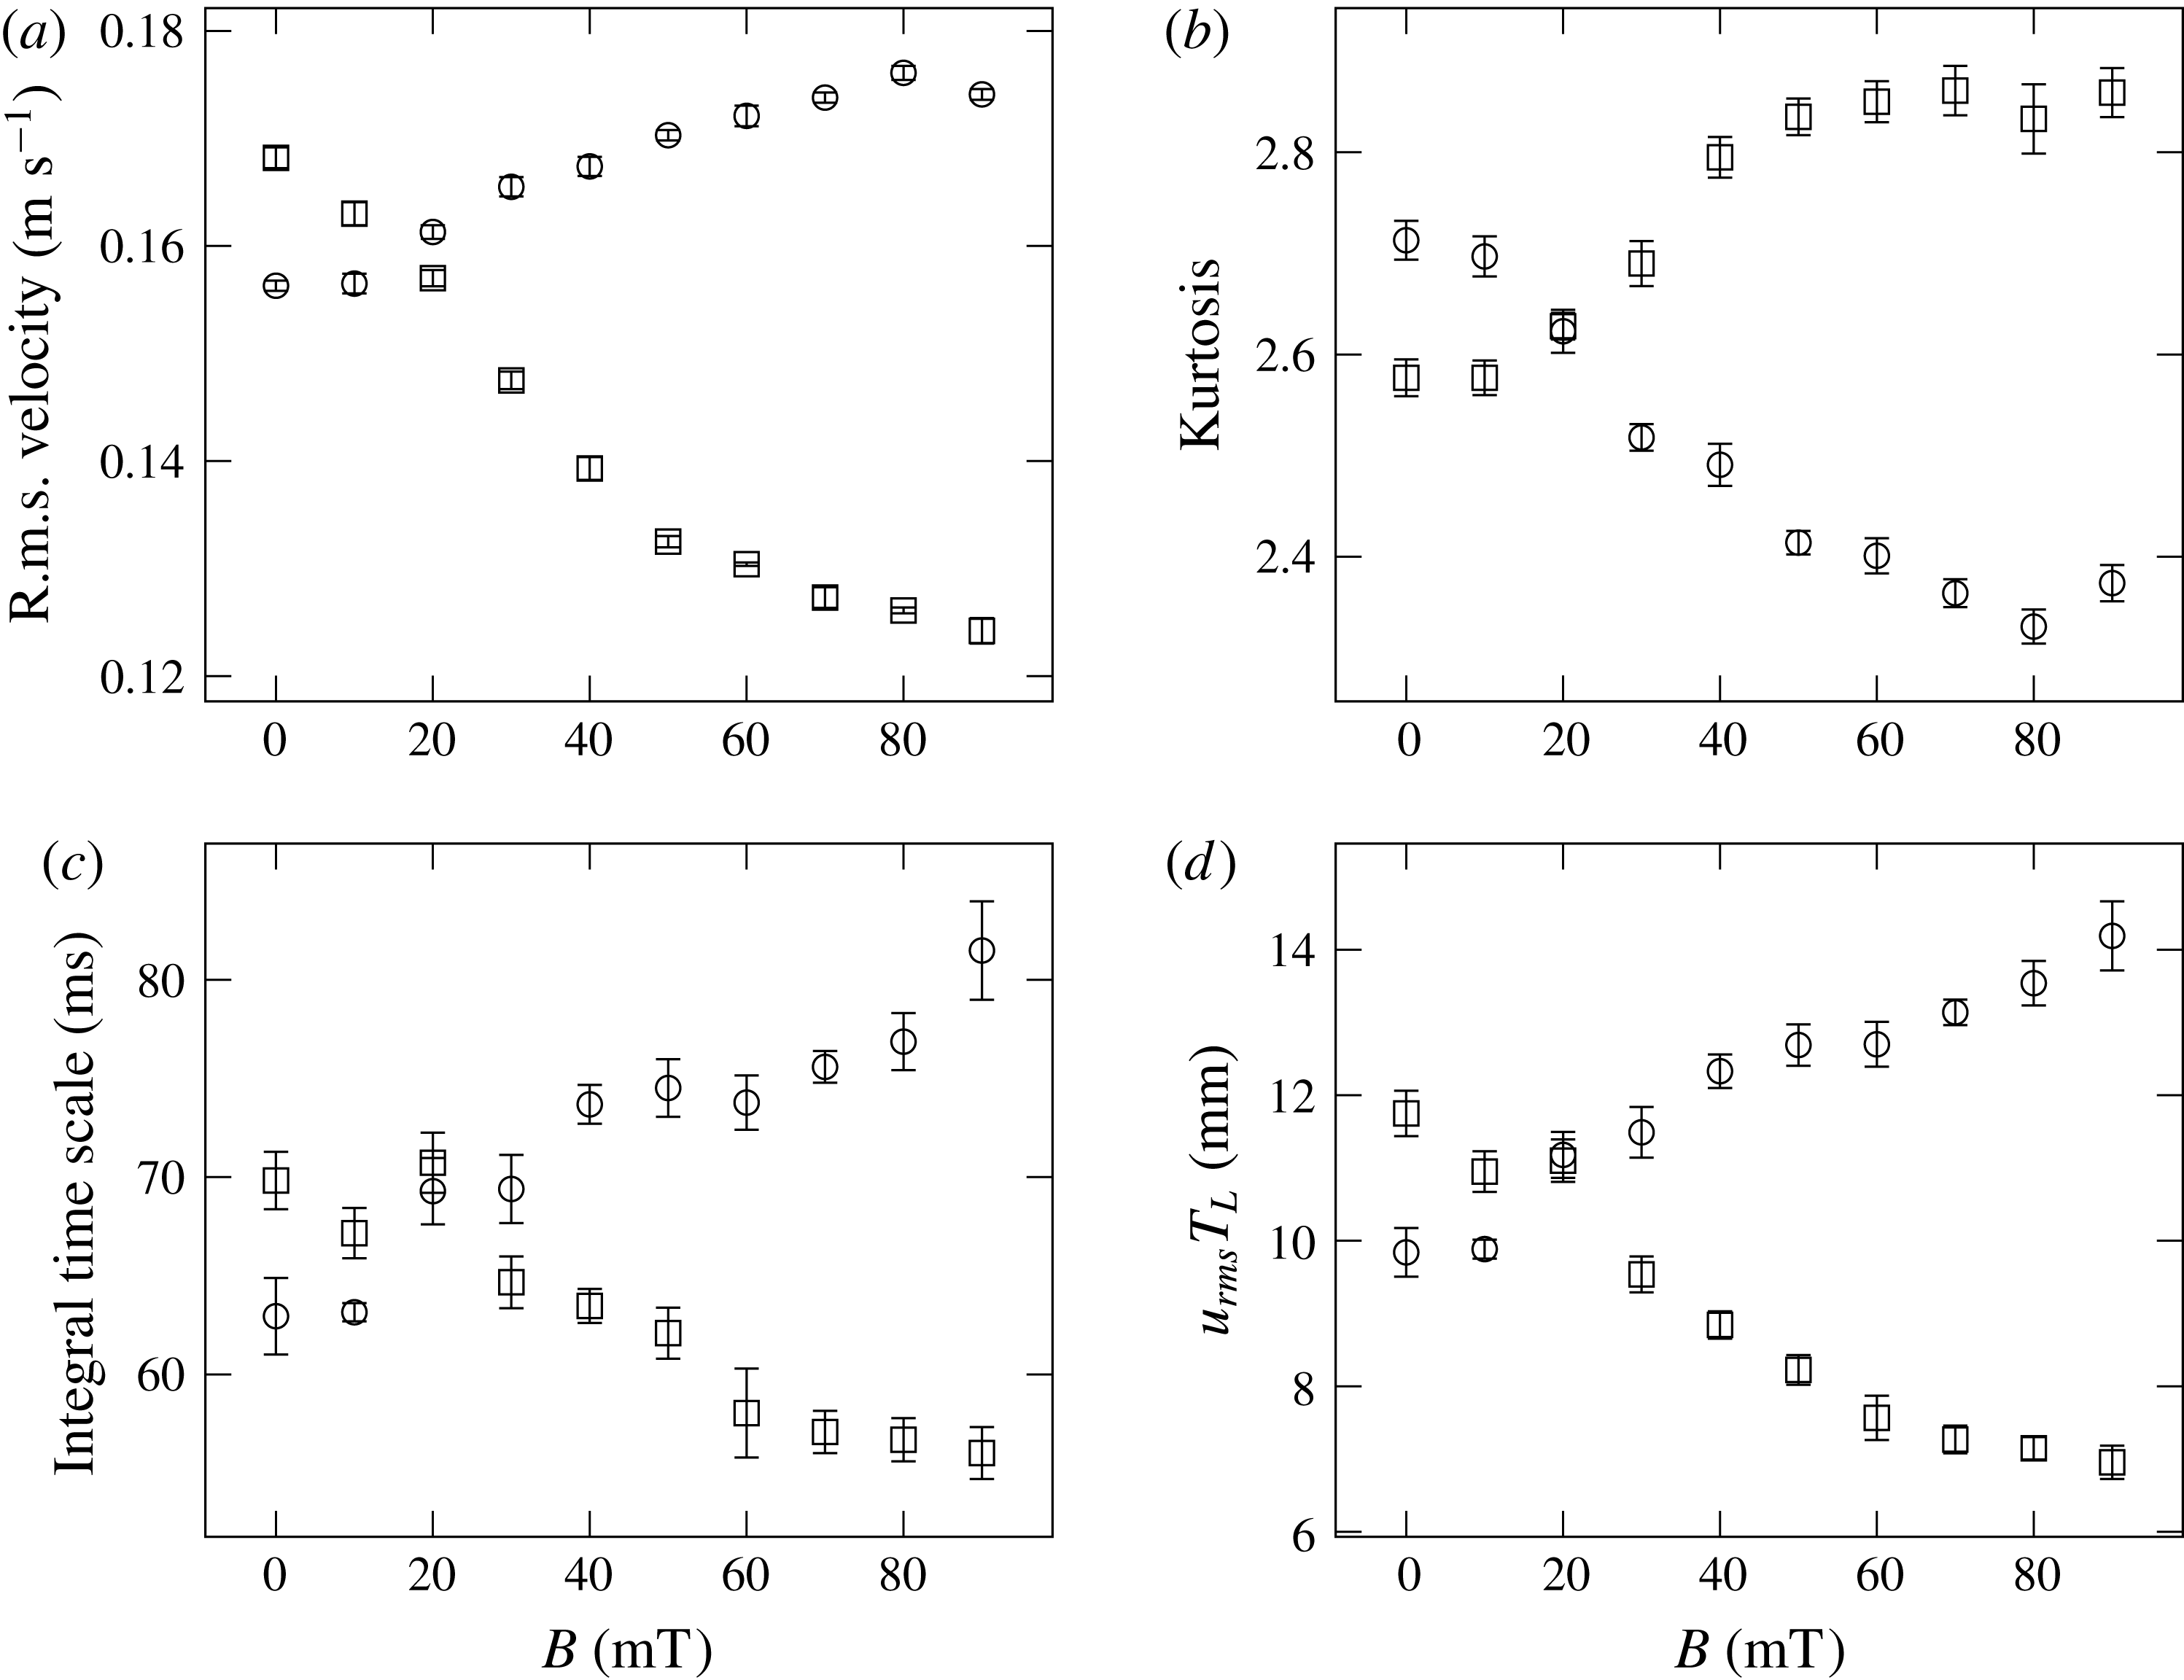
Statistics of transverse velocity components parallel (circles) and perpendicular (squares) to the magnetic field. (a) R.m.s. velocity, (b) velocity kurtosis, (c) integral time scale, and (d) product of r.m.s. velocity and integral time scale.
4.2 Large scales: velocity statistics
To begin the analysis of the Lagrangian time series data we look at the influence of the magnetic field on various large-scale quantities. Figure 11(a) shows the transverse velocity fluctuations in dependence on the magnetic field magnitude. Clearly there is an anisotropy in the r.m.s. velocities evolving with the magnetic field. The velocity kurtosis changes as well (figure 11 b) and confirms the change in the large-scale structure of the flow.
With increasing magnetic field, the flow in the field direction is much longer correlated than in the perpendicular to it (figure 11 c). Similar behaviour was reported by Shen & Yeung (Reference Shen and Yeung1997) in shear turbulence of fluid particles. The shape of the underlying autocorrelation remains similar – when normalised by the integral time scale all curves collapse for long time lags (not shown).
The product of r.m.s. velocity and integral time scale
 $u_{rms}T_{L}$
has the dimension of a length and can be considered as an integral length scale of the flow. For the isotropic case we found this length scale to be of order 10 mm independent of Reynolds number. With applied magnetic field it appears that eddies are compressed in the direction of the magnetic field (figure 11
d).
From the stochastic approach of Sawford (Reference Sawford1991) it follows that the Lagrangian time microscale
 ${\it\tau}_{{\it\lambda}}$
is given as
 $$\begin{eqnarray}{\it\tau}_{{\it\lambda}}\sim (T_{L}T_{2})^{1/2}.\end{eqnarray}$$
We test if this also holds for the anisotropic case. Figure 12 shows the ratio of
 ${\it\tau}_{{\it\lambda}}$
and
 $(T_{L}T_{2})^{1/2}$
as a function of the applied magnetic field. Taking into account the measurement uncertainty no clear trend is observable.
Taylor time scale
 ${\it\tau}_{{\it\lambda}}$
normalised by
 $(T_{L}T_{2})^{1/2}$
against magnetic field for directions parallel (circles) and perpendicular (squares).

4.3 Inertial range: velocity differences
We may also evaluate the second-order structure functions of velocity components in the direction of the magnetic field
 $D_{2}({\it\tau})^{\Vert }$
and perpendicular to it
 $D_{2}({\it\tau})^{\bot }$
. Figure 13 shows the ratio
 $D_{2}({\it\tau})^{\Vert }/D_{2}({\it\tau})^{\bot }$
as a measure for anisotropy with time lag
 ${\it\tau}$
for several magnetic field magnitudes. At zero field there is the already mentioned small residual anisotropy that reduces at smaller scales. From the plot we conclude that (i) the anisotropy is greater at larger scales, and (ii) more pronounced at higher magnetic fields.
Ratio of Lagrangian second-order structure functions against time lag.
 $T_{vis}$
is an estimate of the Kolmogorov microscale time scale for an external magnetic field magnitude of 70 mT.

Velocity–acceleration covariance against magnetic field magnitude, (a) diagonal components and (b) off-diagonal components.

4.4 Velocity–acceleration covariance
We conclude our analysis by looking at the diagonal components of the velocity–acceleration covariance tensor, whose sum we use as an estimate of the energy dissipation rate in the flow (figure 14). While the axial component remains independent of magnetic field, the transverse components diverge symmetrically with increasing anisotropy. The transverse component perpendicular to the field
 $\langle u_{2}a_{2}\rangle$
also approaches the value of the axial component. This behaviour reflects the change of the flow topology which was seen in the Eulerian mean flow measurements.
The off-diagonal components in axial direction vanish (figure 14 b) while the off-diagonal components in the central plane are non-zero. They peak at a field around 20–30 mT and then return to the zero magnetic field values.
5 Discussion
The von Kármán flow geometry is known to exhibit multiple bifurcation phenomena. Ravelet et al. (Reference Ravelet, Marié, Chiffaudel and Daviaud2004), Saint-Michel et al. (Reference Saint-Michel, Dubrulle, Marié, Ravelet and Daviaud2013) report hysteresis effects in the flow subject to asymmetric forcing conditions – discs rotating at different speeds or with different torques. Their flow responds with a significant change of its topology to small changes in the energy injection mechanism, but it remains unclear from where this sensitivity originates.
The present experiments show a similar behaviour, although with a few distinct differences. While Saint-Michel et al. (Reference Saint-Michel, Dubrulle, Marié, Ravelet and Daviaud2013) state that constant speed forcing – also implemented here with exact counter-rotation – does always produce steady state solutions, we observe such behaviour only for large values of the magnetic field. For the other cases, intermittent changes appear between two flow modes that create a superficially smooth change in the mean flow properties. At the same time, the only changing property is a continuous increase in the viscosity’s anisotropy.
The question then arises whether this microscopic alteration does act directly on the larger scales or whether there exists an indirect coupling to and from the increasingly anisotropic small-scale turbulence. In that case, one would have to distinguish furthermore between a possible overlap of the relevant length scales in the inertial range and an extended multi-scale transfer mechanism.
One scenario for the observed flow modification might thus a be viscosity increase due to the external magnetic field that also increases the Kolmogorov microscale. In this case the anisotropic viscosity would directly act on all scales. For eddies with length scale
 $l$
in the inertial range, the typical time scale of the turbulence can be estimated by
 $$\begin{eqnarray}T_{turb}(l)=\left(\frac{l^{2}}{{\it\varepsilon}}\right)^{1/3}\end{eqnarray}$$
and the typical time scale associated with the viscosity is given by
 $$\begin{eqnarray}T_{vis}(l)=\frac{l^{2}}{{\it\nu}(l)},\end{eqnarray}$$
where
 ${\it\nu}(l)$
is the kinematic viscosity which may depend on
 $l$
in the present case. The fluid viscosity can be modelled with a power-law relationship
 $$\begin{eqnarray}\frac{{\it\nu}(l)}{{\it\nu}_{0}}=\left(\frac{\dot{{\it\gamma}}}{\dot{{\it\gamma}}_{0}}\right)^{-k},\end{eqnarray}$$
where for the local shear rate
 $\dot{{\it\gamma}}=1/T_{turb}(l)$
is assumed. The exponent
 $k$
is considered independent from the magnetic field magnitude and is obtained from the data shown in figure 3(a) and
 $\dot{{\it\gamma}}_{0}$
and
 ${\it\nu}_{0}$
are taken as reference values for a magnetic field magnitude of 70 mT from figure 3(b). The turbulent advection dominates on scale
 $l$
when
 $T_{turb}(l)<T_{vis}(l)$
and the viscosity dominates on scale
 $l$
when
 $T_{vis}(l)<T_{turb}(l)$
. Equating both time scales,
 $T_{turb}(l_{vis})=T_{vis}(l_{vis})$
, we obtain a length scale
 $$\begin{eqnarray}l_{vis}=\sqrt[4-2k]{\frac{{\it\nu}_{0}^{3}}{\dot{{\it\gamma}}_{0}^{3}}\left(\frac{\dot{{\it\gamma}}_{0}^{3}}{{\it\varepsilon}}\right)^{k+1}}\end{eqnarray}$$
analogous to the Kolmogorov microscale
 ${\it\eta}$
. Using the experimental values from figure 3(a) the model gives the Kolmogorov scales as
 $$\begin{eqnarray}{\it\eta}=l_{vis}=0.63~\text{mm}\quad {\it\tau}_{{\it\eta}}=13.3~\text{ms}.\end{eqnarray}$$
This would indicate that the viscosity in the direction parallel to the field is changed by a factor of 10, increasing the Taylor microscale by a factor of 3. We display this estimate of the Kolmogorov microscale time scale for an external magnetic field magnitude of 70 mT in figure 13. Since the plot indicates significant anisotropy even at much larger times, it appears that the simple scenario of a direct effect of anisotropic viscosity is not consistent with the data.
However, as already mentioned in § 2.2, the viscosity change in the magnetic fluid depends on chain formation and will be effectively constant in the whole flow due to the slow structure formation process. One may thus conclude that the defining shear rate is determined by the highest value occurring in the flow cell and that the viscosity increase is actually smaller than estimated above, leading to a somewhat smaller value for the Kolmogorov scales.
An alternative argument can be based on the change of acceleration variance, which scales according to (3.5) with
 $\langle a^{2}\rangle \sim {\it\nu}^{-1/2}$
. The data in figure 15 shows not only the splitting of the acceleration variances in both transverse directions, but also a general decrease with factor
 $75/105\approx 0.7$
. This corresponds to a moderate viscosity increase by a factor of approximately 2.
Variance of acceleration components parallel (circles) and perpendicular (squares) to the magnetic field as a function of magnetic field magnitude.

These findings can be backed by looking at the spectra of the Lagrangian velocity and acceleration (figure 16). We show the spectra for directions parallel (a) and perpendicular (b) to the field and two magnetic field magnitudes. It is apparent that the viscosity increase only leads to a small reduction of the scale separation and a direct action of the anisotropic viscosity on all scales appears unlikely.
Lagrangian velocity (dashed) and acceleration (solid) spectra normalised for unit area at zero field (black) and at a field of 70 mT (red). The frequency is scaled by the zero field Kolmogorov scale
 ${\it\omega}_{{\it\eta},0}$
. Plots show component parallel to field (a) and component perpendicular to field (b).

6 Conclusion
The aim of the present study was to investigate a possible dependency of turbulent flow structure on the dissipation at the smallest scales. For this a magnetic fluid was exposed to a spatially uniform magnetic field, producing a flow with an anisotropic, i.e. direction dependent viscosity while avoiding the introduction of additional bulk forces.
The velocity statistics in the central region of the turbulent flow between two counter-rotating discs were evaluated using a Lagrangian ultrasound particle tracking technique with temporal resolution below the Kolmogorov time scale. Significant changes in the statistics could be observed, including a field-dependent change in the velocity fluctuations and the modification of turbulence length scales with a differentiation in the field parallel and perpendicular directions.
An additional measurement with a Doppler profiler revealed the existence of competing flow modes in the test cell. In the field-free case, these modes proved to be direction independent and occurred with near equal probabilities. With increasing field magnitude, a clear bifurcation behaviour could be observed, with one mode being favoured in the field-parallel direction whereas the second became dominant in the perpendicular direction. Both measurement campaigns thus revealed a field dependent, spatially anisotropic behaviour of the turbulent von Kármán flow established in the test cell. The primary and presumably only cause for these modifications is the anisotropic viscosity. The coexistence of effects both on the smaller turbulent flow scales and the global flow patterns suggests a viscosity-induced coupling across all scales.
At present, the detailed mechanism for this coupling remains ambiguous, with possible scenarios including an inverse, cascade-like coupling from small to large scales and forward coupling of the changing macroscopic flow onto the turbulence structure. In the latter case, the reason for the mode splitting – which again would be viscosity induced – requires further study.
Acknowledgement
We would like to thank P. Fischer (D-HEST, ETH Zürich) for conducting the rheological measurements on the magnetic fluid and J. Noir (D-ERDW, ETH Zürich) for making available the magnet system. Furthermore, we appreciate the suggestions by an anonymous reviewer that led to the elaborations of the scaling argument in § 5.
Appendix A. Magnetic fluid, flow cell and magnetic field
In the following, further details regarding the experimental set-up and some specific technical information are provided.
The ferrofluid is composed of spherical magnetic silica particles suspended in de-ionised water (sicastar-M 350, micromod Partikeltechnologie GmbH, Germany) and is used as delivered. The particles were produced by hydrolysis of orthosilicates in the presence of magnetite. Multiple magnetite cores with crystallite sizes of 5–15 nm are homogeneously distributed in a dense silica shell. Their mean diameter is 320.6 nm and the size distribution is monomodal with a polydispersity index of less than 0.2.
Since the continuous ultrasonic Doppler technique records not only the tracer backscatter signals but also internal reflections, care was taken to minimize the echoes from the side walls and the rotating discs. The inner wall of the container cell and the discs are coated with an anechoic absorbing material (Aptflex F36, Precision Acoustics, UK) of 1 cm thickness. The top and bottom plates have internal cooling loops that are connected to a temperature-controlled circulating water bath. The temperature is controlled at 20.0(5) °C using a wall mounted PT100 resistance thermometer located in the central measurement plane of the flow cell.
The magnetic field is generated by three water-cooled copper coils with one large central coil and a smaller coil on each side (Caylar SAS, France) which are fed with currents up to 400 A using bipolar power supplies of class
 $10~\text{ppm}~^{\circ }\text{C}^{-1}$
(MPU
 $\pm$
15 V 400A, Caylar SAS, France). The device is similar to a Maxwell coil but differs in the distance of the smaller coils to the plane of the central coil which is reduced in order to increase the achievable magnetic field magnitude. In this arrangement the highest field homogeneity was achieved by setting the current through each of the smaller coils to 0.75 of the central coil value. The flow apparatus was inserted so that the magnetic field was in the transverse direction. A Hall probe was used to measure the axial magnetic field component on the coil axis and transverse at mid-height.
We employed only non-magnetic materials for the construction of the flow apparatus. The rotating discs are connected by belt loops to brushless DC motors which are placed sufficiently far outside the magnetic field to eliminate interference.
Appendix B. Flow velocimetry
In the chosen velocimetry configuration an ultrasound transducer continuously insonifies the measurement volume (figure 17). Tracer particles crossing the sound beam scatter the sound with a frequency shift
 $f_{d}$
proportional to their velocity
 $\boldsymbol{v}$
:
 $$\begin{eqnarray}f_{d}=\frac{f_{0}}{c}(\boldsymbol{O}-\boldsymbol{I})\boldsymbol{\cdot }\boldsymbol{v}.\end{eqnarray}$$
This equation is valid for particle speeds much less than the speed of sound in the fluid. The frequency shift depends on the velocity of the tracer particle
 $\boldsymbol{v}$
, the speed of sound
 $c$
, the frequency
 $f_{0}$
, the direction
 $\boldsymbol{I}$
of incoming ultrasound and the direction
 $\boldsymbol{O}$
of the receiving transducer.
(a) Principle of the measurement technique and (b) sketch of the mid-plane.

The scattered sound is received by 3 transducers to measure all 3 velocity components of the tracer particle motion. Two receiving transducers are located 80° from the transmitter in a plane in the middle of the cell (figure 17 b) and a third transducer is slightly tilted to measure the velocity in the axial direction. We use immersion type ultrasound transducers (Imasonic SAS, France), made of a piezocomposite material for acoustic impedance matching, and driven with a sine wave of frequency 2.01 MHz. The active transducer area has a diameter of 6 mm and is spherically convex in order to increase the beam divergence. The measurement volume, defined by the intersection of transmitting and receiving beams, is approximately 2 cm in diameter, a value of order of the integral length scale of the flow.
The signals from the receiving transducers are amplified by charge amplifiers with a gain of
 $1\times 10^{13}~\text{V}~\text{C}^{-1}$
and bandpass filtered to allow only a small range of frequencies around the emitting frequency to be sampled. Since the frequency modulation is small compared to the carrier frequency the overall data rate is reduced by undersampling the signals directly on the analogue-to-digital converters. For sampling we use parallel Sigma-Delta 24 bit converters (ICS-1640, GE Intelligent Platforms, Canada) with a sampling frequency of 15.596 kHz which is sufficiently high to allow demodulation of the frequencies while retaining the rapid fluctuations of the flow. The tracer particles are thus continuously tracked along their path through the measurement volume.
From the acquisition we receive a frequency modulated signal wherein the velocity of the tracer particles is encoded in the instantaneous frequency of the signal. The carrier’s base frequency, which is the frequency of the emitted ultrasound, is shifted by undersampling to approximately
 $1/4$
of the sampling frequency, a value chosen to preserve the full bandwidth of expected frequency shifts. There are still echoes coming from the walls despite of the use of anechoic absorbing material. Since the walls are not moving these echoes produce no frequency shift and can easily be filtered out using a notch filter located at the carrier frequency.
Velocities up to
 $0.5~\text{m}~\text{s}^{-1}$
correspond to peak frequency deviations up to 1000 Hz which fluctuate on time scales as small as the Kolmogorov time scale, here
 ${\it\tau}_{{\it\eta}}=4.2~\text{ms}$
. According to the Gabor limit, it is not possible to resolve the frequency with, say, 10 % on these small time scales using a Fourier transform. However, we additionally have information about the structure of the signal: there are only echoes from a small number of scattering particles, so the signal is composed of a small number of complex exponentials in noise. There are a number of approaches which incorporate such information. We chose the MUSIC (Multiple Signal Classification) algorithm (Schmidt Reference Schmidt1986).
The measured time series is divided into subwindows with a length of 16 samples (corresponding to
 $0.24{\it\tau}_{{\it\eta}}$
) and 50 % overlap. It is assumed that the signal does not change over this short interval. The algorithm first identifies events by comparing the signal amplitude with a threshold. For each event, the MUSIC algorithm estimates the frequencies and stores them along with a time stamp. In case of several particles in the measurement volume, several frequencies are associated with that time segment. To assign these frequencies to a Lagrangian trajectory, they are tracked in the time–frequency domain with a Kalman filter (Kalman Reference Kalman1960). As the accuracy decreases with an increasing number of simultaneous events, the seeding density of tracer particles was limited so that there is most of the time only a single tracer particle in the measurement volume.
The effective time resolution
 ${\rm\Delta}t$
is given by the sampling frequency, the length of the time window and the overlap. The measured frequencies are converted to velocities using (B 1). The speed of sound in the ferrofluid was measured inside the flow with a time-of-flight method and was found to be
 $c=1478.5~\text{m}~\text{s}^{-1}$
, independent of magnetic field magnitude.
Appendix C. UVP
Table 4 gives an overview about the relevant parameters used with the UVP instrument (DOP3010, Signal Processing SA, Switzerland). UVP uses a single transducer for emitting the ultrasound and receiving the scattering signal. Hence it measures the velocity component in the direction of the ultrasound beam. The instrument was used with the same transducers as the Doppler tracking system, but their location was adjusted to measure directly the velocity components parallel and perpendicular to the magnetic field. It is apparent that especially the lateral size of the sampling volume is too large for resolved turbulence measurements.
UVP parameters used in the experiment. The pulse repetition frequency and number of bursts per profile were adjusted for channel 2.



