1. Introduction
We lack assurance in almost everywhere around us. In other words, we are unsure about happenings. Thus, nowadays uncertainty measures have earned great deal of attention. Both reliability and survival analysis are the specialized fields of statistics which deal with time-to-event random variables, such as death in biological organisms and failure in mechanical systems. There are several uncertainty measures that play a central role in understanding and describing reliability. An important measure of uncertainty is the notion of entropy. Though the concept originated from thermodynamics but Shannon [Reference Shannon25] was the first who introduced entropy into information theory. The term “information theory” includes information quantification, information handling, information repossession, information storage and useful decision. The classical measure of uncertainty is the Shannon entropy.
Let  $X$ be a non-negative absolutely continuous random variable denoting the time to failure or the life of a system. Now, if
 $f$ is its probability density function along with
 $F$ and
 $\bar {F}$ as the failure distribution and survival function, respectively, then the Shannon measure of uncertainty is given by
 \begin{equation} H(X)= E[-\log{f(X)}]={-} \int_{0}^{\infty} f(x)\log{f(x)}\,dx, \end{equation}
where  $\log {}$ denotes natural logarithm. Intuitively, it gives the expected uncertainty contained in
 $f(x)$ about the predictability of an outcome of
 $X$. As it is unrealistic to use (1.1) whenever the system has some used life, Ebrahimi and Pellerey [Reference Ebrahimi and Pellerey10] defined the concept of measuring uncertainty in residual lifetimes called residual entropy
 \begin{equation} H(X_{t}) ={-} \int_{t}^{+\infty} \frac{f(x)}{\bar{F}(t)}\log{\frac{f(x)}{\bar{F}(t)}}\,dx, \end{equation}
where  $X_{t}$ represents the residual life of a unit with age
 $t\gt0$, i.e.,
 $X_{t} = (X-t\,|\,X \geq t)$. Equation (1.2) measures the expected uncertainty contained in the remaining life of a system. It has been found to be useful in measuring wear and tear characteristics of the system, longevity and to characterize, classify and order distributions of lifetime. The better systems are known to have longevity and there is less uncertainty about its residual lifetime. In many pragmatic cases such as in the field of forensic science, right truncated lifetime distributions are the center of study and thus uncertainty relies on the past. In a similar fashion, Di Crescenzo and Longobardi [Reference Di Crescenzo and Longobardi7] introduced the notion of past entropy as
 \begin{equation} H(X_{(t)})={-}\int_{0}^{t}\frac{f(x)}{F(t)}\log{\frac{f(x)}{F(t)}}\,dx \end{equation}
which measures the uncertainty in the inactivity time  $X_{(t)}=(t-X\,|\,X\lt t)$. Given a system found to be out of order at time
 $t\gt0$, past entropy indicates the uncertainty about the failure instant of the system in
 $(0,t)$.
Various scrutiny and investigations have been escalated in the past to evaluate the information content of stochastic systems in the light of dynamic measures related to the residual lifetime, the past lifetime and their suitable generalizations. However, scarce attention has been directed toward the analysis of variance of information content. Nonetheless, the latter plays an imperative role in the assessment of the statistical significance of entropy. The differential entropy is symbolic of the expectation of the information content of an absolutely continuous random variable. The corresponding variance is termed as varentropy and acts as a catalyst in various applications of information theory, such as for the estimation of the performance of optimal black-coding schemes. Varentropy is the expectation of the squared deviation of the information content  $-\log {f(x)}$ from entropy. This is a measure that describes how the information content is dispersed around the entropy. In other words, it measures how much the entropy is meaningful to draw information. As studying the concentration of information content around entropy is of great importance, varentropy of
 $X$ is defined as the variance of the information content of
 $X$, that is,
 \begin{align} V(X)& = {\rm Var}(- \log{f(X)})= {\rm Var}(\log{f(X)})= E[(\log{f(X)})^{2}]-[H(X)]^{2}\nonumber\\ & = \int_{0}^{+\infty} f(x)(\log{f(x)})^{2}\,dx-\left [ \int_{0}^{+\infty} f(x)(\log{f(x)})\,dx \right]^{2}. \end{align}
The varentropy thus measures how much variability we may expect in the information content of  $X$. It is of paramount importance to judge and estimate the performance of optimal coding, to ascertain the dispersion of sources and channel capacity in computer sciences. The recent contributions on varentropy and the relevance of this measure has been pointed out in Bobkov and Madiman [Reference Bobkov and Madiman2], Arikan [Reference Arikan1], Fradelizi et al. [Reference Fradelizi, Madiman and Wang11], Rioul [Reference Rioul23], Di Crescenzo et al. [Reference Di Crescenzo, Paolillo and Suárez-Llorens9] and Maadani et al. [Reference Maadani, Borzadaran and Roknabadi16].
It will not be an understatement to point out that varentropy, despite its huge significance, has not garnered much attention in literature as most of it has been engrossed in entropy. One recent step toward this direction can be seen in Di Crescenzo and Paolillo [Reference Di Crescenzo and Paolillo8] where the definition of varentropy is extended to residual lifetimes and defining it as
 \begin{align*} V(X_{t}) & = {\rm Var}(-\log{f_{X_{t}}(X_{t})})= E[(\log{f_{X_{t}}(X_{t})})^{2}]-[H(X_{t})]^{2}\\ & = \int_{t}^{+\infty}\frac{f(x)}{\bar{F}(t)}\left [\log{\frac{f(x)}{\bar{F}(t)}}\right ]^{2} dx - \left [\int_{t}^{+\infty}\frac{f(x)}{\bar{F}(t)}\log{\frac{f(x)}{\bar{F}(t)}}\,dx\right ]^{2}\\ & = \frac{1}{\bar{F}(t)}\int_{t}^{+\infty}f(x)(\log f(x))^{2}\,dx - (\Lambda(t) + H(X_{t}))^{2}, \end{align*}
where  $\Lambda (t)= -\log {\bar {F}(t)}.$ Recently, Buono and Longobardi [Reference Buono and Longobardi3] introduced and studied its notion for a system found to be dead at time
 $t$. The varentropy of past lifetime being defined as
 \begin{align*} V(X_{(t)}) & = {\rm Var}(-\log{f_{X_{(t)}}(X_{(t)})})= E[(\log{f_{X_{(t)}}(X_{(t)})})^{2}]-[H(X_{(t)})]^{2} \\ & = \int_{0}^{t}\frac{f(x)}{F(t)}\left [\log{\frac{f(x)}{F(t)}}\right ]^{2} dx - \left [\int_{0}^{t}\frac{f(x)}{F(t)}\log{\frac{f(x)}{F(t)}}\,dx\right ]^{2}\\ & =\frac{1}{F(t)}\int_{0}^{t}f(x)(\log f(x))^{2}\,dx - (\Lambda^{*}(t) + H(X_{(t)}))^{2}, \end{align*}
where  $\Lambda ^{*} (t)= -\log {F(t)}$. For some more results on past varentropy, one may refer to Raqab et al. [Reference Raqab, Bayoud and Qiu22].
In the realm of survival studies, reliability theory, astronomy, forensic science, economy and other fields, studying doubly truncated data using mathematical tools and statistical concepts is gaining attention. Thus, to examine different uncertainty measures for doubly truncated random variable is of interest in recent years. Doubly truncated data occurs when the event time of an individual is observed in a particular time interval. In a life insurance scheme, an insured person has his life covered in the benefit period, that is, time between date of filing of policy and maturity date. In forensic sciences, there are varied instances of doubly truncated data. For example, if a body which was alive at 8 AM is found to be dead at 4 PM, the interest of the investigation team is to ascertain the approximate actual time of death. Thus, often availability of information about the lifetime is restricted between two time points. By way of explanation, the event time of individuals lying between a particular time interval are only observed. And, the information about the subjects beyond this interval is inaccessible to the analyzer. Considering the above facts, Sunoj et al. [Reference Sunoj, Sankaran and Maya27] proposed Shannon's entropy for doubly truncated random variable. Let the random variable  $X_{t_{1},t_{2}}=(X\,|\, t_{1}\lt X\lt t_{2})$ represents the lifetime of a unit which fails somewhere between
 $t_{1}$ and
 $t_{2}$ where
 \begin{equation} (t_{1},t_{2})\in D=\{(u,v)\in \mathbb{R}_{+}^{2}:F(u)\lt F(v)\}. \end{equation}
The Shannon interval entropy is given by
 \begin{equation} IH(X_{t_{1},t_{2}})={-} \int_{t_{1}}^{t_{2}} \frac{f(x)}{F(t_{2})-F(t_{1})}\log{ \frac{f(x)}{F(t_{2})-F(t_{1})}}\,dx. \end{equation}
Given a unit found to be dead at time  $t_{2}$ but survived upto time
 $t_{1}$, it measures the uncertainty about its failure time between
 $t_{1}$ and
 $t_{2}$ as complete lifetime of the unit is unknown. Precisely, (1.6) takes the form of residual entropy (1.2) when
 $t_{2}\rightarrow \infty$ and of past entropy (1.3) when
 $t_{1}\rightarrow 0$. After Sunoj et al. [Reference Sunoj, Sankaran and Maya27] various properties of (1.6) have been studied by Misagh and Yari [Reference Misagh and Yari17,Reference Misagh and Yari18], Khorashadizadeh [Reference Khorashadizadeh12] and Moharana and Kayal [Reference Moharana and Kayal19]. Some generalizations of (1.6) may be seen in Nourbakhsh and Yari [Reference Nourbakhsh and Yari21], Kundu and Nanda [Reference Kundu and Nanda13], Singh and Kundu [Reference Singh and Kundu26] and Kundu and Singh [Reference Kundu and Singh14].
Since interval entropy plays an active role in analyzing specific characteristics of reliability components which fall in some time interval, in order to examine its variance namely, varentropy is instrumental. Furthermore, two doubly truncated random variables may have the same interval entropy under certain conditions but the variation in information content might be quite different. Thus, entropy is not sufficient measure to reveal the shape of spread of information. Also, when the data are doubly truncated, we expect to achieve better estimation about the lifetime of the unit because of fixed values of  $t_{1}$ and
 $t_{2}$. This motivates to study varentropy for doubly truncated random variable which finds useful applications in reliability and life testing.
The objective of the next section, with the notion of residual/past varentropy studied earlier, is to initiate a new varentropy with regard to the interval defined as interval varentropy. It is the best homogenized case of both residual and past varentropy. The results to be proven further will enhance the existing results developed for one-sided truncated random variable. The concept is applied to some known distributions. The change in interval varentropy with respect to both the truncating variables is obtained in connection with the generalized failure rate and interval entropy. We also study the behavior of interval varentropy in terms of varied transformations. Hence, we conclude the section after obtaining its bounds. In Section 3, Monte-Carlo simulation is executed to corroborate our intuition of decreasing interval varentropy for shrinking interval. The same is implemented on two real data sets with varying truncation limits which substantiates the observation of the simulation study. We present some applications of interval varentropy in Section 4. Finally, in Section 5, we conclude the present study.
2. Interval varentropy
Now consider the case where a system is found to be working at time  $t_{1}$ and on observing it again at time
 $t_{2}$ it is found to be dead. The doubly truncated uncertainty is evaluated by (1.6), and thus, there is a need to study the concentration of information around it. This motivates us to define interval varentropy for an absolutely continuous random variable
 $X$, that is, varentropy concerning an interval
 $(t_1,t_2)$, as
 \begin{align*} V(X_{t_{1},t_{2}}) & = {\rm Var}(-\log{f_{X_{t_{1},t_{2}}}(X_{t_{1},t_{2}})}) \\ & =E[(\log{f_{X_{t_{1},t_{2}}}(X_{t_{1},t_{2}})})^{2}] - [ IH(X_{t_{1},t_{2}})]^{2} \\ & =\int_{t_{1}}^{t_{2}}\frac{f(x)}{F(t_{2})-F(t_{1})}\left [\log{\frac{f(x)}{F(t_{2})-F(t_{1})}}\right ]^{2}\,dx \\ & \quad - \left [\int_{t_{1}}^{t_{2}}\frac{f(x)}{F(t_{2})-F(t_{1})}\log{\frac{f(x)}{F(t_{2})-F(t_{1})}}\,dx \right]^{2}. \end{align*}
On further expanding,
 \begin{equation} V(X_{t_{1},t_{2}})=\frac{1}{F(t_{2})-F(t_{1})}\int_{t_{1}}^{t_{2}}f(x)(\log{f(x)})^{2}\,dx-(-\log{(F(t_{2})-F(t_{1}))} + IH(X_{t_{1},t_{2}}))^{2}. \end{equation}
Here, we assess our definition in the form of evaluating interval entropy and the interval varentropy for significant distributions used in reliability and survival analysis.
Example 2.1.
• Let
 $X$ be a random variable having uniform distribution over $(0,b)$, that is, $X \sim U(0,b)$, $b\gt0$. Hence, for $0\lt t_1 \lt t_2 \lt b$, we have
\begin{align*} IH(X_{t_{1},t_{2}}) & = \log{(t_{2}-t_{1})}, \\ V(X_{t_{1},t_{2}}) & = 0. \end{align*}
• Let
$X$ be a random variable following exponential distribution, that is, $X \sim {\rm Exp}(\lambda )$, $\lambda \gt0$. We have, for $0\lt t_1 \lt t_2$,
where\begin{align*} IH(X_{t_{1},t_{2}}) & = 1 + \log{(e^{-\lambda t_{1}}-e^{-\lambda t_{2}})} + \frac{n_1(t_2)-n_1(t_1)}{e^{-\lambda t_{1}}-e^{-\lambda t_{2}}}, \\ V(X_{t_{1},t_{2}}) & = 1 + \frac{n_2(t_1)-n_2(t_2)}{e^{-\lambda t_{1}}-e^{-\lambda t_{2}}} - \left [\frac{n_1(t_1)-n_1(t_2)}{e^{-\lambda t_{1}}-e^{-\lambda t_{2}}}\right ]^{2}, \end{align*}
$$n_r(t)= e^{-\lambda t}[\log{(\lambda e^{-\lambda t})}]^r, \quad r=1,2.$$
• Suppose a random variable
$X$ follows finite range distribution having $\bar {F}(x)=(1-ax)^{b}$, $0\lt x\lt1/a$; $a,b\gt0$. We have, for $0\lt t_1 \lt t_2\lt1/a$,
where\begin{align*} IH(X_{t_{1},t_{2}}) & = \left ( 1 - \frac{1}{b} \right ) + \log{((1-at_{1})^{b}-(1-at_{2})^{b})} +\frac{g_1(t_2)-g_1(t_1)}{(1-at_{1})^{b}-(1-at_{2})^{b}},\\ V(X_{t_{1},t_{2}}) & = \left ( 1 -\frac{1}{b} \right )^{2} + \frac{g_2(t_1)-g_2(t_2)}{(1-at_{1})^{b}-(1-at_{2})^{b}}- \left [\frac{g_1(t_1)-g_1(t_2)}{(1-at_{1})^{b}-(1-at_{2})^{b}}\right ]^{2}, \end{align*}
$$g_r(t)=(1-at)^{b}[\log{(ab(1-at)^{b-1})}]^r, \quad r=1,2.$$
• Let
$X$ be a random variable with generalized Pareto distribution (GPD). Then, the distribution function of $X$ is $F(x,k,\sigma )$ = $1-(1- {kx}/{\sigma })^{{1}/{k}}$; $k\neq 0$, $\sigma \gt0$, where $k$ and $\sigma$ are the shape and scale parameters, respectively, with support of $X$ being $x\gt0$ if $k\leq 0$, and $0\leq x\leq {\sigma }/{k}$ if $k\gt0$. Then, for $t_{1}\lt t_{2}$ in support set, we have
where\begin{align*} IH(X_{t_{1},t_{2}}) & = (k-1) + \log{\left (\left (1-\frac{kt_{1}}{\sigma}\right )^{{1}/{k}}-\left (1-\frac{kt_{2}}{\sigma}\right )^{{1}/{k}}\right )} + \frac{m_1(t_2)-m_1(t_1)}{(1-{kt_{1}}/{\sigma})^{{1}/{k}}- (1-{kt_{2}}/{\sigma})^{{1}/{k}}},\\ V(X_{t_{1},t_{2}}) & = (k\,{-}\,1)^{2}\,{+}\,\frac{m_2(t_1)\,{-}\,m_2(t_2)}{(1\,{-}\,{kt_{1}}/{\sigma} )^{{1}/{k}}\,{-}\,(1\,{-}\,{kt_{2}}/{\sigma})^{{1}/{k}}} +{-} \left [ \frac{m_1(t_1)\,{-}\,m_1(t_2)}{ (1\,{-}\,{kt_{1}}/{\sigma})^{{1}/{k}}\,{-}\,(1\,{-}\,{kt_{2}}/{\sigma})^{{1}/{k}}}\right ]^{2}, \end{align*}
$$m_r(t)= \left (1-\frac{kt}{\sigma}\right )^{{1}/{k}}\left [\log{\left (\frac{1}{\sigma}\left (1-\frac{kt}{\sigma}\right )^{{1}/{k}-1}\right )}\right ]^r, \quad r=1,2.$$
• For a Pareto-I distribution,
$\bar {F}(x)=({a}/{x})^{b}$; $0\lt a\lt x$, $b\gt0$. We have, for $a\lt t_1 \lt t_2$,
where\begin{align*} IH(X_{t_{1},t_{2}}) & = \left (1 + \frac{1}{b}\right ) + \log{\left (\left (\frac{a}{t_{1}}\right )^{b}-\left (\frac{a}{t_{2}}\right )^{b}\right )} + \frac{s_1(t_2)-s_1(t_1)}{({a}/{t_{1}})^{b}-({a}/{t_{2}})^{b}},\\ V(X_{t_{1},t_{2}}) & = \left (1 + \frac{1}{b}\right )^{2} + \frac{s_2(t_1)-s_2(t_2)}{( {a}/{t_{1}} )^{b}-( {a}/{t_{2}})^{b}} -\left [ \frac{s_1(t_1)-s_1(t_2)}{( {a}/{t_{1}})^{b}-( {a}/{t_{2}} )^{b}}\right ]^{2}, \end{align*}
$$s_r(t)= \left (\frac{a}{t}\right )^{b}\left [\log{\left (\frac{b}{a}\left (\frac{a}{t}\right )^{b+1}\right )}\right ]^r, \quad r=1,2.$$
• Let
$X$ follow power distribution having $F(x)=({x}/{a})^{b};\ 0\lt x\lt a,\ b\gt0$. Then, for $0\lt t_1\lt t_2\lt a$,
where\begin{align*} IH(X_{t_{1},t_{2}}) & = \left( 1- \frac{1}{b}\right ) + \log{\left (\left(\frac{t_{2}}{a}\right )^{b}-\left(\frac{t_{1}}{a}\right )^{b}\right )}+ \frac{j_1(t_1)-j_1(t_2)}{ ({t_{2}}/{a})^{b}-({t_{1}}/{a} )^{b}},\\ V(X_{t_{1},t_{2}}) & = \left( 1- \frac{1}{b}\right )^{2}+ \frac{j_2(t_2)-j_2(t_1)}{({t_{2}}/{a} )^{b}-({t_{1}}/{a} )^{b}} - \left [\frac{j_1(t_2)-j_1(t_1)}{ ({t_{2}}/{a})^{b}-({t_{1}}/{a})^{b}}\right ]^{2}, \end{align*}
$$j_r(t)= \left (\frac{t}{a}\right )^{b}\left [\log{\left (\frac{bt^{b-1}}{a^{b}}\right )}\right ]^r, \quad r=1,2.$$
• Let
$X$ be a random variable with $F(x)=x^{2}$, $x\in (0,1)$. Then, for $0\lt t_1 \lt t_2\lt1$,
\begin{align*} IH(X_{t_{1},t_{2}}) & = \frac{1}{2} + \log{(t_{2}^{2}-t_{1}^{2})}-\left (\frac{t_{2}^{2}\log{(2t_{2})}-t_{1}^{2}\log{(2t_{1})}}{t_{2}^{2}-t_{1}^{2}}\right ),\\ V(X_{t_{1},t_{2}}) & = \frac{1}{4} + \frac{t_{2}^{2}(\log{(2t_{2})})^{2}-t_{1}^{2}(\log{(2t_{1})})^{2}}{t_{2}^{2}-t_{1}^{2}} -\left (\frac{t_{2}^{2}\log{(2t_{2})}-t_{1}^{2}\log{(2t_{1})}}{t_{2}^{2}-t_{1}^{2}}\right )^{2}. \end{align*}


2.1. Some properties
It is well-known that the interval Shannon entropy, under certain condition increases as the interval grows larger. Is this intuitive monotonicity preserved for interval varentropy? To answer such questions in precise mathematical terms is quite impossible. Interestingly, it has been observed that  $V(X_{t_{1},t_{2}})$ is decreasing in
 $t_1$ and increasing in
 $t_2$ keeping the other fixed for most of the significant distributions. We give an example in support of the same.
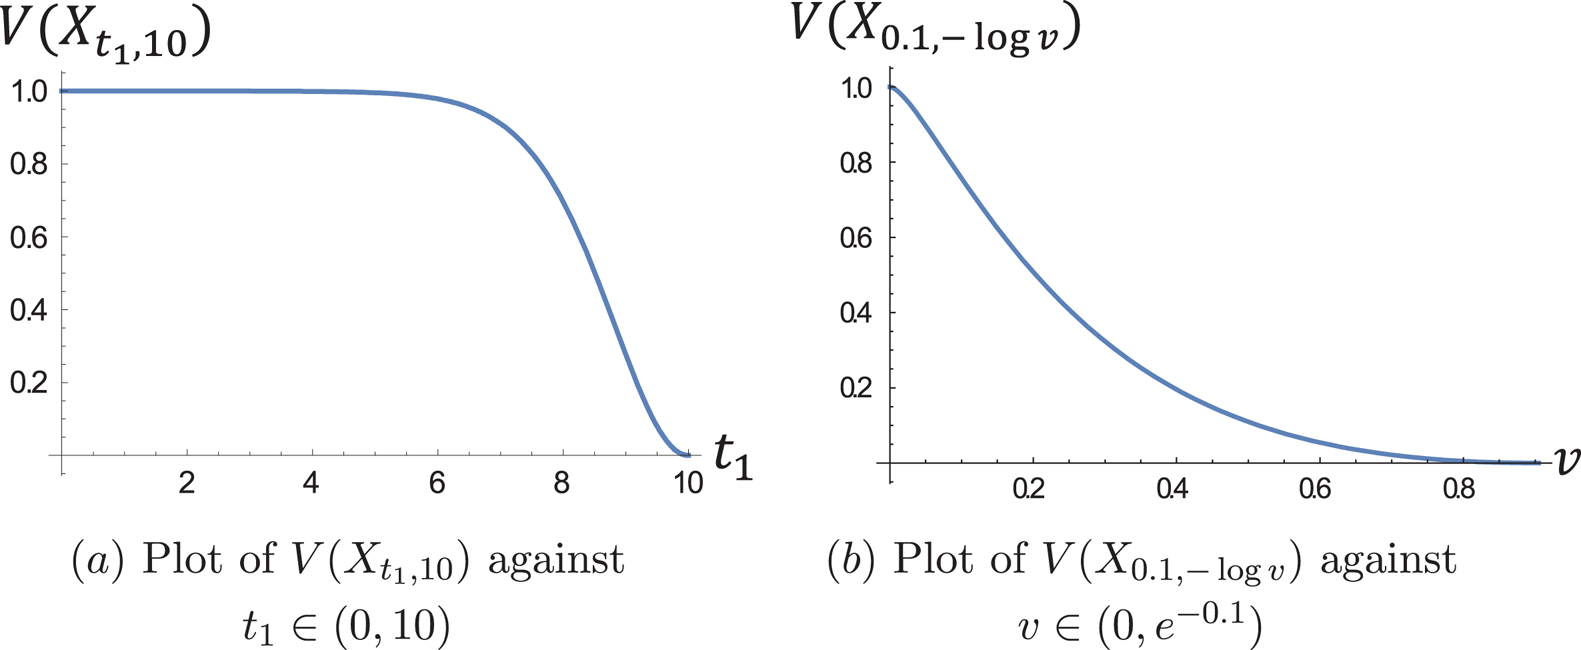
Example 2.2. Let  $X$ follow exponential distribution with mean
 $\frac {1}{2}$. Then, the varentropy of
 $X$ is decreasing in
 $t_{1}$ and increasing in
 $t_{2}$ as shown in Figure 1. Note that the substitution
 $t_{2}=-\log {v}$, where
 $v \in (0,e^{-0.1})$ has been used while plotting Figure 1(b).
Graphical representation of  $V(X_{t_{1},t_{2}})$ (Example 2.2).

The following counterexample shows that there exist distributions which are not monotone in terms of doubly truncated varentropy.
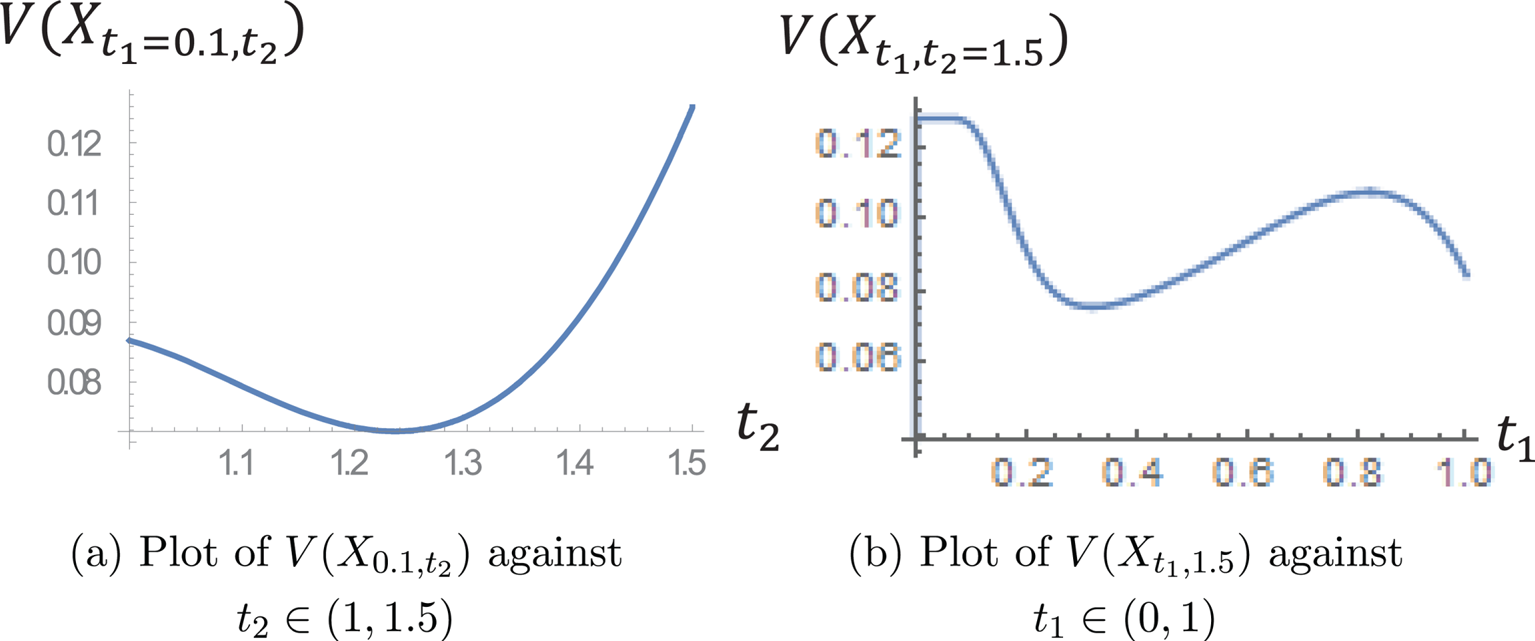
Counterexample 2.1. Consider a non-negative random variable with distribution function
 \begin{equation} F(x) = \left\{\begin{array}{ll} \exp{\left(-\dfrac{1}{2}-\dfrac{1}{x}\right)}, & \text{if}\ \ 0 \leq x \leq 1,\\ \exp{\left({-}2+\dfrac{x^{2}}{2}\right)}, & \text{if}\ \ 1 \leq x \leq 2. \end{array}\right. \end{equation}
Then, Figure 2 shows that the doubly truncated varentropy for this distribution is not monotone in  $t_{2}$ for some fixed
 $t_{1}$ and not monotone in
 $t_{1}$ for some fixed
 $t_{2}$.
Graphical representation of  $V(X_{t_{1},t_{2}})$ (Counterexample 2.1).

Next, we look for an expression for the derivative of the interval varentropy. Recall that the generalized failure rate (GFR) functions of a doubly truncated random variable  $(X\,|\,t_1 \lt X \lt t_2)$ are defined as (cf. [Reference Navarro and Ruiz20])
 $$h_{1}(t_{1},t_{2})=\frac{f(t_{1})}{F(t_{2})-F(t_{1})} \quad \text{and} \quad h_{2}(t_{1},t_{2})=\frac{f(t_{2})}{F(t_{2})-F(t_{1})}.$$
By differentiating (1.6) with respect to  $t_{1}$ and
 $t_{2}$, we obtain
 \begin{align} \frac{\partial IH(X_{t_{1},t_{2}})}{\partial t_{1}} & = h_{1}(t_{1},t_{2})\left [IH(X_{t_{1},t_{2}})-1 + \log{h_{1}(t_{1},t_{2})} \right], \end{align}
 \begin{align} \frac{\partial IH(X_{t_{1},t_{2}})}{\partial t_{2}} & ={-}h_{2}(t_{1},t_{2})\left [IH(X_{t_{1},t_{2}})-1 + \log{h_{2}(t_{1},t_{2})} \right]. \end{align}
Proposition 2.1. For all  $(t_{1},t_{2})\in D$, the derivatives of the interval varentropy are
 \begin{align*} \frac{\partial V(X_{t_{1},t_{2}})}{\partial t_{1}} & = h_{1}(t_{1},t_{2})[ V(X_{t_{1},t_{2}})- (IH(X_{t_{1},t_{2}}) + \log h_{1}(t_{1},t_{2}))^{2};\\ \frac{\partial V(X_{t_{1},t_{2}})}{\partial t_{2}} & ={-}h_{2}(t_{1},t_{2})[ V(X_{t_{1},t_{2}})- (IH(X_{t_{1},t_{2}}) + \log h_{2}(t_{1},t_{2})^{2}]. \end{align*}
Proof. Differentiating (2.1), we get
 \begin{align*} \frac{\partial V(X_{t_{1},t_{2}})}{\partial t_{1}} & = \frac{ h_{1}(t_{1},t_{2})}{F(t_{2})-F(t_{1})}\int_{t_{1}}^{t_{2}}f(x)(\log f(x))^{2}\,dx - h_{1}(t_{1},t_{2})(\log f(t_{1}))^{2} \\ & \quad -2( -\log (F(t_{2})-F(t_{1})) + IH(X_{t_{1},t_{2}}))\left ( h_{1}(t_{1},t_{2}) + \frac{\partial IH(X_{t_{1},t_{2}})}{\partial t_{1}}\right),\\ \frac{\partial V(X_{t_{1},t_{2}})}{\partial t_{2}} & = \frac{ - h_{2}(t_{1},t_{2})}{F(t_{2})-F(t_{1})}\int_{t_{1}}^{t_{2}}f(x)(\log f(x))^{2}\,dx + h_{2}(t_{1},t_{2})(\log f(t_{2}))^{2} \\ & \quad -2\left( -\log (F(t_{2})-F(t_{1})) + IH(X_{t_{1},t_{2}})\right)\left ({-}h_{2}(t_{1},t_{2}) + \frac{\partial IH(X_{t_{1},t_{2}})}{\partial t_{2}}\right ). \end{align*}
On substituting the values of  ${\partial IH(X_{t_{1},t_{2}})}/{\partial t_{1}}$,
 ${\partial IH(X_{t_{1},t_{2}})}/{\partial t_{2}}$ from (2.3) and (2.4), we have
 \begin{align*} \frac{\partial V(X_{t_{1},t_{2}})}{\partial t_{1}} & = h_{1}(t_{1},t_{2}) [ V(X_{t_{1},t_{2}})+ ( -\log (F(t_{2})-F(t_{1}))+ IH(X_{t_{1},t_{2}}))^{2}-(\log{f(t_{1})})^{2}\\ & \quad -2( -\log (F(t_{2})-F(t_{1}))+ IH(X_{t_{1},t_{2}}))(\log{ h_{1}(t_{1},t_{2})} + IH(X_{t_{1},t_{2}}))],\\ \frac{\partial V(X_{t_{1},t_{2}})}{\partial t_{2}} & ={-}h_{2}(t_{1},t_{2}) [ V(X_{t_{1},t_{2}})+ ( -\log (F(t_{2})-F(t_{1}))+ IH(X_{t_{1},t_{2}}))^{2}-(\log{f(t_{2})})^{2}\\ & \quad -2( -\log (F(t_{2})-F(t_{1}))+ IH(X_{t_{1},t_{2}}))(\log{ h_{2}(t_{1},t_{2})} + IH(X_{t_{1},t_{2}})) ]. \end{align*}
After some calculations and arrangements, we get the required result.
To look for some conditions under which interval varentropy can be constant, we have the following theorem.
Theorem 2.1.
(i) Let the varentropy
$V(X_{t_{1},t_{2}})$ be constant, that is, $V(X_{t_{1},t_{2}})=v\geq 0$ for all $(t_{1},t_{2})\in D$. Then,
\begin{align*} |IH(X_{t_{1},t_{2}}) + \log{ h_{1}(t_{1},t_{2})}| & = \sqrt{v} \\ {\rm and}\quad |IH(X_{t_{1},t_{2}}) + \log{ h_{2}(t_{1},t_{2})}| & = \sqrt{v}, \quad \forall \,\,(t_{1},t_{2}) \in D. \end{align*}
(ii) Let
$c\in \mathbb {R}$, if $\forall (t_1,t_2) \in D$ any of the following conditions holds
(2.5)\begin{align} IH(X_{t_{1},t_{2}}) + \log{ h_{1}(t_{1},t_{2})} & = c; \end{align}
(2.6)then\begin{align} IH(X_{t_{1},t_{2}}) + \log{ h_{2}(t_{1},t_{2})} & = c; \end{align}
(2.7)\begin{equation} \lvert V(X_{t_{1},t_{2}})- c^{2}\rvert = \frac{|V(X)-c^{2}|}{F(t_{2})-F(t_{1})}. \end{equation}


Proof. (i) The proof follows from Proposition 2.1, if interval varentropy is constant  $v$.
(ii) Under the assumption (2.5), we have from Proposition 2.1
 $$\frac{\partial V(X_{t_{1},t_{2}})}{\partial t_{1}} = h_{1}(t_{1},t_{2})[ V(X_{t_{1},t_{2}})- c^{2}].$$
On solving the above PDE, we obtain
 $$\log{\lvert V(X_{t_1,t_2})-c^2\rvert}=\log{\frac{c_1}{F(t_2)-F(t_1)}}.$$
With the boundary condition
 $$\lim_{t_{1}\to \underset{D}{\inf}\, u, t_{2}\to \underset{D}{\sup} \,v} V(X_{t_{1},t_{2}})=V(X),$$
where  $\underset {D}\inf \,u = a$ and
 $\underset {D}\sup \,v = b$, say such that
 $F(a)=0$ and
 $F(b)=1$, the integration constant
 $c_1$ is obtained as
 $$\log{\lvert V(X)-c^2\rvert}=\log{c_1}$$
or equivalently,
 $$c_1=\lvert V(X)-c^2\rvert$$
which on substitution in the solution yields (2.7). On proceeding as above with the assumption (2.6), one may obtain the same result.
In line with the generalized reversed hazard rate (cf. [Reference Buono, Longobardi and Szymkowiak4]), we propose a parametric form of GFR functions as follows:
 $$h_{1,c}(t_{1},t_{2})=\frac{f(t_{1})}{[F(t_{2})-F(t_{1})]^{1-c}} \quad {\text{and}}\quad h_{2,c}(t_{1},t_{2})=\frac{f(t_{2})}{[F(t_{2})-F(t_{1})]^{1-c}},$$
where  $c\in \mathbb {R}$ and
 $(t_1,t_2) \in D$. Note that for
 $c=0$, we get the GFR functions.
Theorem 2.2. Let  $(X|t_1 \lt X \lt t_2)$ be doubly truncated random variable with
 $(t_1,t_2)$ as given in (1.5) and let
 $c\in \mathbb {R}$. Then, the parametric GFR functions of
 $X$ with parameter
 $1 - c$ are constant, that is,
 \begin{align*} h_{1,1-c}(t_{1},t_{2})= e^{c-H(X)} \quad \text{and}\quad h_{2,1-c}(t_{1},t_{2})= e^{c-H(X)}, \quad \forall \,(t_{1},t_{2}) \in D \end{align*}
if (2.5) and (2.6) hold, respectively. Also, the relation between interval varentropy and parametric generalized failure rate functions can be expressed as
 $$\lvert V(X_{t_{1},t_{2}})-(H(X)+\log{h_{1,1-c}(t_{1},t_{2})})^{2} \rvert=\frac{\lvert V(X)-(H(X)+\log{h_{1,1-c}(t_{1},t_{2})})^{2}\rvert}{F(t_{2})-F(t_{1})}$$
and,
 $$\lvert V(X_{t_{1},t_{2}})-(H(X)+\log{h_{2,1-c}(t_{1},t_{2})})^{2} \rvert=\frac{\lvert V(X)-(H(X)+\log{h_{2,1-c}(t_{1},t_{2})})^{2}\rvert}{F(t_{2})-F(t_{1})}.$$
Proof. Let (2.5) hold. Then,
 $$\frac{\partial IH(X_{t_{1},t_{2}})}{\partial t_{1}} = h_{1}(t_{1},t_{2})[c-1].$$
By partially integrating both sides of the above equations, we get
 $$IH(X_{t_{1},t_{2}})=\log{(F(t_{2})-F(t_{1}))^{1-c}} + H(X)$$
which again on using (2.5) yields
 $$c=H(X) + \log{\frac{f(t_{1})}{(F(t_{2})-F(t_{1}))^{c}}}.$$
Thus, the result follows. Substituting the values of  $c^{2}$ in (2.7), we get the final expression. On proceeding as above with the assumption (2.6), one may obtain the same result.
Remark 2.1. In Theorem 2.1, if (2.5) and (2.6) hold simultaneously, then  $h_{1}(t_1,t_2)=h_{2}(t_1,t_2)$ which yields
 $f(t_1)=f(t_2),\ \forall (t_1,t_2) \in D$. Thus,
 $X$ must be a uniformly distributed random variable for which varentropy is constant.
It is worthwhile to mention that achieving the expression of varentropy in compact form is not easy or requires more effort. However, using certain transformation, one can evaluate varentropy for such distributions in terms of varentropy of known distributions. In other words, if one has a specific transformation that results to the desired distribution from the known distribution, then the varentropy can be readily evaluated. Moreover, studying varentropy under transformation may be useful in analyzing relation and properties that are inherited. In the next proposition, we look for interval varentropy under affine transformation. We recall that if
 $$Y= aX + b, \quad a \gt 0,\ b\geq 0$$
then the interval entropies of  $X$ and
 $Y$ are related by (cf. [Reference Misagh and Yari18])
 \begin{equation} IH(Y_{t_{1},t_{2}})= IH\left (X_{{(t_{1}-b)}/{a},{(t_{2}-b)}/{a}}\right ) + \log{a}. \end{equation}
Proposition 2.2. Let  $Y = aX + b$, with
 $a\gt0$ and
 $b\geq 0$. Then, their varentropies are related by
 \begin{equation} V(Y_{t_{1},t_{2}}) = V\left (X_{{(t_{1}-b)}/{a},{(t_{2}-b)}/{a}}\right ), \quad 0 \leq b \lt t_{1} \lt t_{2}. \end{equation}
Proof. The proof is similar as that of Proposition  $3.2$ of Di Crescenzo and Paolillo [Reference Di Crescenzo and Paolillo8].
The following example gives an application of the above proposition.
Example 2.3. Let  $X$ follow Pareto-I distribution
 $F(x)=1-({a}/{x})^{b}$ with
 $a=1$,
 $b=2$ and
 $x\gt a$. If
 $Y=\phi (X)=X-a$, then
 $Y$ follows Pareto-II (Lomax) distribution. In light of Proposition 2.2, we have
 \begin{align*} V(Y_{t_{1},t_{2}})& = V(X_{t_{1}+a,t_{2}+a}) = \frac{({1}/{t_{1}})^{2} (\log{(2({1}/{t_{1}})^{3})} )^{2}-( {1}/{t_{2}} )^{2}(\log{ (2({1}/{t_{2}})^{3} )} )^{2}}{( {1}/{t_{1}})^{2}-({1}/{t_{2}})^{2}}\\ & \quad + \left (1 + \frac{1}{2}\right )^{2} -\left [ \frac{({1}/{t_{1}} )^{2}\log{(2({1}/{t_{1}})^{3})} -( {1}/{t_{2}} )^{2}\log{(2({1}/{t_{2}} )^{3})}}{( {1}/{t_{1}} )^{2}-( {1}/{t_{2}})^{2}}\right ]^{2}, \end{align*}
which is difficult to obtain otherwise.
In the next result, the effect of monotonic transformations on interval varentropy is studied. Before that recall if  $\phi$ is any differentiable and strictly monotonic function and
 $Y =\phi (X)$, then past entropies of
 $X$ and
 $Y$ are related by
 $$H(Y_{(t)})=\begin{cases} H(X_{(\phi^{{-}1}(t))}) + E[\log{\phi^{\prime}(X)}|X \lt \phi^{{-}1}(t) ], & \text{for } \phi \text{ increasing},\\ H(X_{\phi^{{-}1}(t)}) + E[\log{\{-\phi^{\prime}(X)\}}|X \gt \phi^{{-}1}(t) ], & \text{for } \phi \text{ decreasing} \end{cases}$$
the residual entropies of  $X$ and
 $Y$ by
 $$H(Y_{t})=\begin{cases} H(X_{\phi^{{-}1}(t)}) + E[\log{\phi^{\prime}(X)}|X \gt \phi^{{-}1}(t) ], & \text{for } \phi \text{ increasing},\\ H(X_{(\phi^{{-}1}(t))}) + E[\log{\{-\phi^{\prime}(X)\}}|X \lt \phi^{{-}1}(t) ], & \text{for } \phi \text{ decreasing} \end{cases}$$
and, the interval entropies of  $X$ and
 $Y$ by
 \begin{equation} IH(Y_{t_{1},t_{2}})= \left\{\begin{array}{ll} IH(X_{\phi^{{-}1}(t_{1}),\phi^{{-}1}(t_{2})}) & \\ \quad + E[\log{\phi^{\prime}(X)}| \phi^{{-}1}(t_{1}) \lt X \lt \phi^{{-}1}(t_{2}) ], & \text{for } \phi \text{ increasing},\\ IH(X_{\phi^{{-}1}(t_{2}),\phi^{{-}1}(t_{1})}) & \\ \quad + E[\log{\{-\phi^{\prime}(X)\}}| \phi^{{-}1}(t_{2}) \lt X \lt \phi^{{-}1}(t_{1}) ], & \text{for } \phi \text{ decreasing}. \end{array}\right. \end{equation}
Proposition 2.3. Let  $Y=\phi (X)$, where
 $\phi$ is a differentiable and strictly monotonic function.
(i) If
$\phi$ is strictly increasing, then
(2.11)\begin{align} V(Y_{t_{1},t_{2}})& = V(X_{\phi^{{-}1}(t_{1}),\phi^{{-}1}(t_{2})}) + {\rm Var}[\log{\phi^{\prime}(X)}| \phi^{{-}1}(t_{1}) \lt X \lt \phi^{{-}1}(t_{2})]\nonumber\\ & \quad - 2E\left [\log{\frac{f_{X}(X)}{F_{X}(\phi^{{-}1}(t_{2}))-F_{X}(\phi^{{-}1}(t_{1}))}}\log{\phi^{\prime}(X)}| \phi^{{-}1}(t_{1}) \lt X \lt \phi^{{-}1}(t_{2})\right ]\nonumber\\ & \quad -2 IH(X_{\phi^{{-}1}(t_{1}),\phi^{{-}1}(t_{2})})E[\log{\phi^{\prime}(X)}|\phi^{{-}1}(t_{1}) \lt X \lt \phi^{{-}1}(t_{2}) ]. \end{align}
(ii) If
$\phi$ is strictly decreasing, then
(2.12)\begin{align} & V(Y_{t_{1},t_{2}})= V(X_{\phi^{{-}1}(t_{2}),\phi^{{-}1}(t_{1})}) + {\rm Var}[\log{\{-\phi^{\prime}(X)\}}| \phi^{{-}1}(t_{2}) \lt X \lt \phi^{{-}1}(t_{1})]\nonumber\\ & \quad - 2E\left [\log{\frac{f_{X}(X)}{F_{X}(\phi^{{-}1}(t_{1}))-F_{X}(\phi^{{-}1}(t_{2}))}}\log{\{-\phi^{\prime}(X)\}}| \phi^{{-}1}(t_{2}) \lt X \lt \phi^{{-}1}(t_{1})\right ]\nonumber\\ & \quad -2 IH(X_{\phi^{{-}1}(t_{2}),\phi^{{-}1}(t_{1})})E[\log{\{-\phi^{\prime}(X)\}}|\phi^{{-}1}(t_{2}) \lt X \lt \phi^{{-}1}(t_{1}) ]. \end{align}


Proof. (i) On assuming  $\phi$ to be strictly increasing we have
 $F_{Y}(x)=F_{X}(\phi ^{-1}(x))$ and
 $f_{Y}(x)={f_{X}(\phi ^{-1}(x))}/{\phi ^{\prime }(\phi ^{-1}(x))}$. Hence using the definition of interval varentropy and (2.10), we have
 \begin{align} V(Y_{t_{1},t_{2}}) & = \int_{\phi^{{-}1}(t_{1})}^{\phi^{{-}1}(t_{2})}\frac{f_{X}(x)}{F_{X}(\phi^{{-}1}(t_{2}))-F_{X}(\phi^{{-}1}(t_{1}))} \left [\log{\frac{({1}/{\phi^{\prime}(x)})f_{X}(x)}{F_{X}(\phi^{{-}1}(t_{2}))-F_{X}(\phi^{{-}1}(t_{1}))}}\right ]^{2}dx \nonumber\\ & \quad - [ IH(X_{\phi^{{-}1}(t_{1}),\phi^{{-}1}(t_{2})})+ E[\log{\phi^{\prime}(X)}\,|\, \phi^{{-}1}(t_{1}) \lt X \lt \phi^{{-}1}(t_{2})]]^{2}. \end{align}
Expanding
 $$\log{\frac{({1}/{\phi^{\prime}(x)})f_{X}(x)}{F_{X}(\phi^{{-}1}(t_{2}))-F_{X}(\phi^{{-}1}(t_{1}))}} = \log{\frac{f_{X}(x)}{F_{X}(\phi^{{-}1}(t_{2}))-F_{X}(\phi^{{-}1}(t_{1}))}}-\log{\phi^{\prime}(x)}$$
on streching the squares in (2.13), observing
 \begin{align*} & \int_{\phi^{{-}1}(t_{1})}^{\phi^{{-}1}(t_{2})}\frac{f_{X}(x)}{F_{X}(\phi^{{-}1}(t_{2}))-F_{X}(\phi^{{-}1}(t_{1}))} \left [\log{\phi^{\prime}(X)}\right ]^{2}\,dx - \left ( E[\log{\phi^{\prime}(X)}| \phi^{{-}1}(t_{1}) \lt X \lt \phi^{{-}1}(t_{2}) ]\right )^{2}\\ & \quad ={\rm Var}[\log{\phi^{\prime}(X)}| \phi^{{-}1}(t_{1}) \lt X \lt \phi^{{-}1}(t_{2})] \end{align*}
and after some arrangements we obtain the result.
(ii) When  $\phi$ is strictly decreasing, we have
 $F_{Y}(x) = \bar {F}_{X}(\phi ^{-1}(x))$ and
 $f_{Y}(x) = -{f_{X}(\phi ^{-1}(x))}/{\phi ^{\prime }(\phi ^{-1}(x))}$. On proceeding as in part (i)
 \begin{align} V(Y_{t_{1},t_{2}}) & = \int_{\phi^{{-}1}(t_{1})}^{\phi^{{-}1}(t_{2})}\frac{-f_{X}(x)}{\bar{F}_{X}(\phi^{{-}1}(t_{2}))-\bar{F}_{X}(\phi^{{-}1}(t_{1}))} \left [\log{\frac{({-1}/{\phi^{\prime}(x)})f_{X}(x)}{\bar{F}_{X}(\phi^{{-}1}(t_{2}))-\bar{F}_{X}(\phi^{{-}1}(t_{1}))}}\right ]^{2}dx \nonumber\\ & \quad - \left [ IH(X_{\phi^{{-}1}(t_{2}),\phi^{{-}1}(t_{1})}) + E[\log{\{-\phi^{\prime}(X)\}}| \phi^{{-}1}(t_{2}) \lt X \lt \phi^{{-}1}(t_{1}) ]\right ]^{2} \end{align}
on streching the squares in (2.14) and after some arrangements we have the result.
Consider the following example to illustrate the effectiveness of the result.
Example 2.4. Let  $X$ follow exponential distribution with density function
 $f(x)=\lambda \exp (-\lambda x)$, where
 $x\gt0$ and
 $\lambda \gt0$. Consider the transformation
 $Y=\phi {(X)}=X^{2}$, which is differentiable, strictly increasing and convex function. Subsequently,
 $\phi {(X)}$ follows Weibull distribution with distribution function
 $G(x)= 1-\exp (-\lambda \sqrt {x})$,
 $x\gt0$. Therefore, Proposition 2.3 yields
 \begin{align*} & V(Y_{t_{1},t_{2}}) = 1 + \frac{e^{-\lambda \sqrt{t_{1}}}(\log{(\lambda e^{-\lambda \sqrt{t_{1}}})})^{2}-e^{-\lambda \sqrt{t_{2}}}(\log{(\lambda e^{-\lambda \sqrt{t_{2}}})})^{2}}{e^{-\lambda \sqrt{t_{1}}}-e^{-\lambda \sqrt{t_{2}}}} \\ & \quad - \left [\frac{e^{-\lambda \sqrt{t_{1}}}\log{(\lambda e^{-\lambda \sqrt{t_{1}}})} - e^{-\lambda \sqrt{t_{2}}}\log{(\lambda e^{-\lambda \sqrt{t_{2}}}})}{e^{-\lambda \sqrt{t_{1}}}-e^{-\lambda \sqrt{t_{2}}}}\right ]^{2} + {\rm Var}[\log{(2X)}| \sqrt{t_{1}} \lt X \lt \sqrt{t_{2}}] \\ & \quad - 2E\left [\log{\frac{\lambda e^{-\lambda X}}{e^{-\lambda\sqrt{t_{1}}}-e^{-\lambda\sqrt{t_{2}}}}}\log{(2X)}| \sqrt{t_{1}} \lt X \lt \sqrt{t_{2}}\right ] -2 E[\log{(2X)} | \sqrt{t_{1}} \lt X \lt \sqrt{t_{2}} ]\\ & \quad \times \left [ 1 + \log{(e^{-\lambda \sqrt{t_{1}}}-e^{-\lambda \sqrt{t_{2}}})} + \frac{e^{-\lambda \sqrt{t_{2}}}\log{(\lambda e^{-\lambda \sqrt{t_{2}}})} - e^{-\lambda \sqrt{t_{1}}}\log{(\lambda e^{-\lambda \sqrt{t_{1}}}})}{e^{-\lambda \sqrt{t_{1}}}-e^{-\lambda \sqrt{t_{2}}}}\right ]. \end{align*}
2.2. Bounds
Here, we give some bounds for the interval varentropy as it may not always be possible to get an analytical expression for it. Firstly, we look for a suitable lower bound of  $V(X_{t_{1},t_{2}})$ expressed as variance of
 $X$ in the interval
 $(t_1,t_2)$ which is defined as
 $$\sigma^{2}(t_{1},t_{2})= {\rm Var}(X\,|\,t_1 \lt X \lt t_2) = \int_{t_{1}}^{t_{2}} x^{2} \frac{f(x)}{F(t_{2})-F(t_{1})}\,dx - (m(t_1,t_2))^{2},$$
where  $m(t_1,t_2)= E(X\,|\,t_1 \lt X \lt t_2)$ is the doubly truncated mean.
Theorem 2.3. Let  $m(t_{1},t_{2})$ and
 $\sigma ^{2}(t_{1},t_{2})$ be the mean and variance of
 $X_{t_{1},t_{2}}$ both assumed to be defined on
 $\mathbb {R}$. Then, for all
 $(t_{1},t_{2})\in D$,
 $$V(X_{t_{1},t_{2}}) \geq \sigma^{2}(t_{1},t_{2}) (E[\omega^{\prime}_{t_{1},t_{2}}(X_{t_{1},t_{2}})])^{2} ,$$
where  $\omega ^{\prime }_{t_{1},t_{2}}(x)$ is the derivative of the function
 $\omega _{t_{1},t_{2}}(x)$ which is defined by
 \begin{equation} \sigma^{2}(t_{1},t_{2})\omega_{t_{1},t_{2}}(x)f_{X_{t_{1},t_{2}}}(x) = \int_{0}^{x} [m(t_{1},t_{2}) - z]f_{X_{t_{1},t_{2}}}(z)\,dz, \quad x \gt 0. \end{equation}
Proof. Recall from Cacoullos and Papathanasiou [Reference Cacoullos and Papathanasiou5] that for an absolutely continuous random variable  $X$ with mean
 $\mu$ and variance
 $\sigma ^2$
 \begin{equation} {\rm Var}[g(X)] \geq \sigma^{2}(E[\omega(X)g^{\prime}(X)])^{2}, \end{equation}
where  $\omega (x)$ is defined by
 $$\sigma^{2}\omega(x)f(x)=\int_{0}^{x}(\mu-z)f(z)\,dz.$$
Hence on considering  $X_{t_{1},t_{2}}$ as the random variable in (2.16) and
 $g(x) = - \log {f_{X_{t_{1},t_{2}}}(x)}$, we get
 $${\rm Var}(-\log{f_{X_{t_{1},t_{2}}}(X_{t_{1},t_{2}})})= V(X_{t_{1},t_{2}}) \geq \sigma^{2}(t_{1},t_{2})\left [ E\left (\omega_{t_{1},t_{2}}(X_{t_1,t_2})\frac{f^{\prime}_{X_{t_{1},t_{2}}}(X_{t_{1},t_{2}})}{f_{X_{t_{1},t_{2}}}(X_{t_{1},t_{2}})}\right )\right ]^{2}.$$
On differentiating both sides of (2.15), we get
 $$\omega_{t_{1},t_{2}}(x)\frac{f^{\prime}_{X_{t_{1},t_{2}}}(x)}{f_{X_{t_{1},t_{2}}}(x)} = \frac{m(t_{1},t_{2})-x}{ \sigma^{2}(t_{1},t_{2})}- \omega^{\prime}_{t_{1},t_{2}}(x).$$
Thus,
 \begin{align*} V(X_{t_{1},t_{2}}) & \geq \sigma^{2}(t_{1},t_{2})\left [ E\left ( \frac{m(t_{1},t_{2})-X_{t_1,t_2}}{ \sigma^{2}(t_{1},t_{2})}- \omega^{\prime}_{t_{1},t_{2}}(X_{t_1,t_2}) \right )\right ]^{2} \\ & = \sigma^{2}(t_{1},t_{2}) (E[\omega^{\prime}_{t_{1},t_{2}}(X_{t_{1},t_{2}})])^{2}. \end{align*}
The following theorem gives an upper bound of  $V(X_{t_{1},t_{2}})$. The proof being similar to that of Theorem
 $3.4$ of Di Crescenzo and Paolillo [Reference Di Crescenzo and Paolillo8] is omitted.
Theorem 2.4. If  $f$ is the log-concave density function of a random variable
 $X$. Then,
 $$V(X_{t_{1},t_{2}}) \leq 1 , \quad \text{for } 0\lt t_{1}\lt t_{2}.$$
We conclude the section by providing an upper bound for varentropy of a doubly truncated random variable if its density function is not log-concave.
Theorem 2.5. If  $X$ is a random lifetime such that its density function satisfies
 \begin{equation} e^{-\alpha x-\beta}\leq f(x)\leq 1,\quad \forall x \geq 0, \end{equation}
where  $\alpha \gt0$ and
 $\beta \geq 0$. Then, for all
 $(t_{1},t_{2})\in D$
 \begin{align*} V(X_{t_{1},t_{2}}) & \leq \alpha [IH^{\omega}(X_{t_1,t_2})-m(t_1,t_2)\log{(F(t_2)-F(t_1))}] +\beta[IH(X_{t_1,t_2})-\log{(F(t_2)-F(t_1))}]\\ & \quad -[IH(X_{t_1,t_2})-\log{(F(t_2)-F(t_1))}]^2, \end{align*}
where  $IH^{\omega }(X_{t_1,t_2})$ is the weighted interval entropy (cf. [Reference Misagh and Yari17]).
Proof. From Equation (2.1) using (2.17), we have
 \begin{align} V(X_{t_{1},t_{2}})& \leq{-}\frac{1}{F(t_{2})-F(t_{1})}\int_{t_{1}}^{t_{2}}(\alpha x + \beta)f(x)\log{f(x)}\,dx\nonumber\\ & \quad -(-\log{(F(t_{2})-F(t_{1}))} + IH(X_{t_{1},t_{2}}))^{2}. \end{align}
We note (cf. Eq. (8) of [Reference Misagh and Yari17])
 \begin{equation} \int_{t_1}^{t_2}x f(x)\log{f(x)}\,dx = (F(t_{2})-F(t_{1}))[\log{F(t_2)-F(t_1)}m(t_1,t_2)-IH^{\omega}(X_{t_1,t_2})]. \end{equation}
Moreover, from (1.6), we have
 \begin{equation} \int_{t_1}^{t_2} f(x)\log{f(x)}\,dx = (F(t_{2})-F(t_{1}))[\log{F(t_2)-F(t_1)}-IH(X_{t_1,t_2})]. \end{equation}
Finally, on substituting (2.19) and (2.20) in (2.18), we obtain the result.
3. Simulation study and data analysis
In this section, we analyze the effect of  $t_1$ and
 $t_2$ on varentropy by proposing a simple parametric estimator for it. We study its monotonicity based on simulated data and investigate our observations on real-life data sets.
3.1. Simulation study
Here, we carry out a simulation study to illustrate our intuitive idea of decreasing varentropy in shrinking interval. Let  $X$ follow
 ${\rm Exp}(\lambda )$, then
 \begin{align} V(X_{t_{1},t_{2}})& = \int_{t_{1}}^{t_{2}}\frac{\lambda e^{-\lambda x}}{e^{-\lambda t_{1}}-e^{-\lambda t_{2}}}\left [\log{\frac{\lambda e^{-\lambda x}}{e^{-\lambda t_{1}}-e^{-\lambda t_{2}}}}\right ]^{2}\,dx\nonumber\\ & \quad - \left [ \int_{t_{1}}^{t_{2}}\frac{\lambda e^{-\lambda x}}{e^{-\lambda t_{1}}-e^{-\lambda t_{2}}}\log{\frac{\lambda e^{-\lambda x}}{e^{-\lambda t_{1}}-e^{-\lambda t_{2}}}}\,dx \right ]^{2}. \end{align}
Now, to estimate  $V(X_{t_{1},t_{2}})$, we use the method of maximum likelihood. For this, we first estimate the unknown parameter
 $\lambda$ denoted by
 $\hat {\lambda }$ using the maximum likelihood estimation method and then use it in (3.1) to get the maximum likelihood estimator (MLE) of
 $V(X_{t_{1},t_{2}})$. Thus, for calculating
 $\hat {\lambda }$, let us consider
 $x_{i}$,
 $i=1,2,\ldots,n$ that are independent and identically distributed random samples from doubly truncated exponential distribution with parameter
 $\lambda$ such that
 $t_{1}\lt x_{i}\lt t_{2}$. The log-likelihood function for the data
 $x_{i}$ is written as:
 \begin{equation} L(\lambda\,|\,x_{1},x_{2},\ldots,x_{n})= n\log{\lambda}-\lambda\sum_{i=1}^{n}x_{i}- n\log{(\exp{(-\lambda t_{1})}-\exp{(-\lambda t_{2})})}. \end{equation}
We use nonlinear minimization (nlm) technique in R-software to maximize the log-likelihood function (3.2) and get  $\hat {\lambda }$. On obtaining
 $\hat {\lambda }$, the MLE of
 $V(X_{t_{1},t_{2}})$ can be computed using the formula
 \begin{align} \hat{V}(X_{t_{1},t_{2}}) & = \int_{t_{1}}^{t_{2}}\frac{\hat{\lambda} e^{-\hat{\lambda} x}}{e^{-\hat{\lambda} t_{1}}-e^{-\hat{\lambda} t_{2}}}\left [\log{\frac{\hat{\lambda} e^{-\hat{\lambda} x}}{e^{-\hat{\lambda} t_{1}}-e^{-\hat{\lambda} t_{2}}}}\right ]^{2}\,dx \nonumber\\ & \quad - \left [ \int_{t_{1}}^{t_{2}}\frac{\hat{\lambda} e^{-\hat{\lambda} x}}{e^{-\hat{\lambda} t_{1}}-e^{-\hat{\lambda} t_{2}}}\log{\frac{\hat{\lambda} e^{-\hat{\lambda} x}}{e^{-\hat{\lambda} t_{1}}-e^{-\hat{\lambda} t_{2}}}}\,dx \right ]^{2}. \end{align}
For different values of  $t_{1}$ and
 $t_{2}$, the estimated values of
 $V(X_{t_{1},t_{2}})$ can be calculated from (3.3).
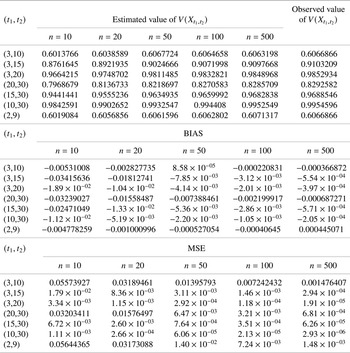
In order to verify our intuition, we carry out a Monte-Carlo simulation study. The estimated values are computed based on 1000 simulation each of size  $n$ (
 $n = 10, 20, 50, 100, 500$) from exponential distribution with parameter
 $\lambda = 0.5$ for different truncation limits. Averages are calculated from these 1,000 values of
 $\hat {\lambda }$ and
 $\hat {V}(X_{t_{1},t_{2}})$ which are then considered as their final values. Bias and mean squared error (MSE) are also calculated. In Table 1, we list the estimates along with observed values, bias and MSE. It is observed that
 $\hat {V}(X_{t_{1},t_{2}})$ increases as
 $t_{2}$ increases or
 $t_{1}$ decreases (keeping the other fixed). This shows that varentropy decreases when the object's outcome is confined into a shrinking interval. The results of simulation study shows that as the sample size increases, absolute values of bias and MSE decreases. The estimates are nearly unbiased when large sample size is considered.
 $\hat {V}(X_{t_{1},t_{2}})$, Bias and MSE (
 $n=10, 20, 50, 100, 500$).

3.2. Analysis of real data sets
In this subsection, we analyze two real data sets. First, we consider the data set representing number of deaths due to COVID-19 from 10 March to 19 May 2021 in India obtained from the electronic source https://www.worldometers.info/coronavirus/country/india/. The COVID-19 pandemic is considered as one of the most crucial and unprecedented global health calamities of the century. The corona virus disease is an infectious respiratory disease, the outbreak of which has embarked a health crisis across the globe. Due to the extremely contagious nature of the virus, it has rapidly spread around the world, posing enormous health, economic, environmental and social challenges to the entire human population. “Flattening the curve” has been a struggle to slow down the transmission by testing and treating patients, quarantining suspected persons through contact tracing, restricting large gatherings and so on. In this part, we modestly contribute to the subject by evaluating interval varentropy for the data taking different truncation limits showing the efficiency of our intuition in this regard. It could be relevant to provide a precise estimation for some measures of interest related to COVID-19 cases, to propose an efficient strategy for estimating and fitting data on COVID-19 death cases in other countries, or in a more challenging way, model the distribution of the number of cases for any pandemic with similar features and under a similar environment. The number of deaths per day are given below:
Data Set: 135, 113, 158, 160, 121, 131, 188, 172, 156, 190, 197, 214, 198, 278, 250, 258, 293, 312, 296, 267, 356, 459, 472, 718, 518, 481, 450, 636, 690, 810, 780, 847, 914, 890, 1043, 1059, 1208, 1355, 1530, 1655, 1798, 2070, 2155, 2313, 2677, 2835, 2873, 2830, 3367, 3731, 3587, 3602, 4318, 3739, 3884, 4358, 4423, 4244, 4567, 4476, 4069, 4381, 4837, 4706, 4530, 4870, 4859, 4378, 4714, 4967, 4177.
It has been observed using R-software, that the exponential distribution with parameter  $\lambda =0.00051$ can be fitted to this data set. The same has been verified through goodness-of-fit test. The Kolmogorov–Smirnov (K-S) distance between the empirical distribution and the fitted distribution functions and the associated
 $p$-value were obtained as 0.14918 and 0.07631, respectively. Next, we obtain
 $\hat {V}(X_{t_{1},t_{2}})$ by estimating
 $\lambda$ using the method of maximum likelihood for different truncation limit. It is clear from Table 2, that
 $\hat {V}(X_{t_{1},t_{2}})$ increases with respect to
 $t_{2}$ and decreases with respect to
 $t_{1}$ (keeping the other fixed).
Estimated values of  $V(X_{t_{1},t_{2}})$ of COVID-19 data for different truncation limits.

The second data set represents remission times (in months) of a random sample of 128 bladder cancer patients reported in Lee and Wang [Reference Lee and Wang15]:
Data Set: 0.08, 2.09, 3.48, 4.87, 6.94, 8.66, 13.11, 23.63, 0.20, 2.23, 3.52, 4.98, 6.97, 9.02, 13.29, 0.40, 2.26, 3.57, 5.06, 7.09, 9.22, 13.80, 25.74, 0.50, 2.46, 3.64, 5.09, 7.26, 9.47, 14.24, 25.82, 0.51, 2.54, 3.70, 5.17, 7.28, 9.74, 14.76, 6.31, 0.81, 2.62, 3.82, 5.32, 7.32, 10.06, 14.77, 32.15, 2.64, 3.88, 5.32, 7.39, 10.34, 14.83, 34.26, 0.90, 2.69, 4.18, 5.34, 7.59, 10.66, 15.96, 36.66, 1.05, 2.69, 4.23, 5.41, 7.62, 10.75, 16.62, 43.01, 1.19, 2.75, 4.26, 5.41, 7.63, 17.12, 46.12, 1.26, 2.83, 4.33, 5.49, 7.66, 11.25, 17.14, 79.05, 1.35, 2.87, 5.62, 7.87, 11.64, 17.36, 1.40, 3.02, 4.34, 5.71, 7.93, 11.79, 18.10, 1.46, 4.40, 5.85, 8.26, 11.98, 19.13, 1.76, 3.25, 4.50, 6.25, 8.37, 12.02, 2.02, 3.31, 4.51, 6.54, 8.53, 12.03, 20.28, 2.02, 3.36, 6.76, 12.07, 21.73, 2.07, 3.36, 6.93, 8.65, 12.63, 22.69.
As observed by Shanker et al. [Reference Shanker, Hagos and Sujatha24], exponential distribution with parameter  $\lambda = 0.106773$ can be fitted to this data set. The same has been verified through a goodness-of-fit test using R-software. It is seen from Table 3, that
 $\hat {V}(X_{t_{1},t_{2}})$ is a partially increasing function of the interval
 $(t_{1},t_{2})$.
Estimated values of  $V(X_{t_{1},t_{2}})$ for cancer data for different truncation limits.

Therefore, the monotonic behavior of the estimates as observed for simulated data are validated by the COVID-19 death data and remission time of cancer patients data.
4. Some applications
Motivated by the applications of residual varentropy concerning proportional hazard rate model and first-passage time problem of an Ornstein–Uhlenbeck jump-diffusion process with catastrophes as illustrated by Di Crescenzo and Paolillo [Reference Di Crescenzo and Paolillo8], in this section we investigate some applications of varentropy of a doubly truncated random variable. We begin with the usefulness of our proposed concept for the choice of most acceptable system. Another application is followed by the effectiveness of evaluating the scatterness between two time points in the first-passage time jump-diffusion process. Further progress toward applications of varentropy will intend to other stochastic models of interest such as order statistics, spacings, record values, inaccuracy measures based on the relevation transform and its reversed version (cf. [Reference Di Crescenzo and Paolillo8]). Also, to establish empirical version of doubly truncated varentropy for its suitable nonparametric estimates.
4.1. Most acceptable system
A system is said to be better in a specific time interval if it lives longer and there is less uncertainty about its survival time. This notion find its effectiveness in reliability engineering in choosing the most acceptable system. Recently, Moharana and Kayal [Reference Moharana and Kayal19] have shown that a parallel system is mostly acceptable than a single component system in some stochastic sense. A question may occur at this point: Is a parallel system, independent of number of components  $n$, most acceptable? This question seeks interest and elucidate the usefulness of doubly truncated varentropy. For example, consider a parallel system of
 $n$ components with lifetime
 $Y_{i},\ i=1,2,\ldots,n$. Let
 $Y_i'$s be independent and identically distributed with common distribution function
 $F(x)$ as given in Counterexample 2.1. Then,
 $X= \max \{Y_1,Y_2,\ldots,Y_n\}$ represents the system lifetime. The distribution function of
 $X$ is
 $G(x)=[F(x)]^n$. Now, choosing the specified time interval as
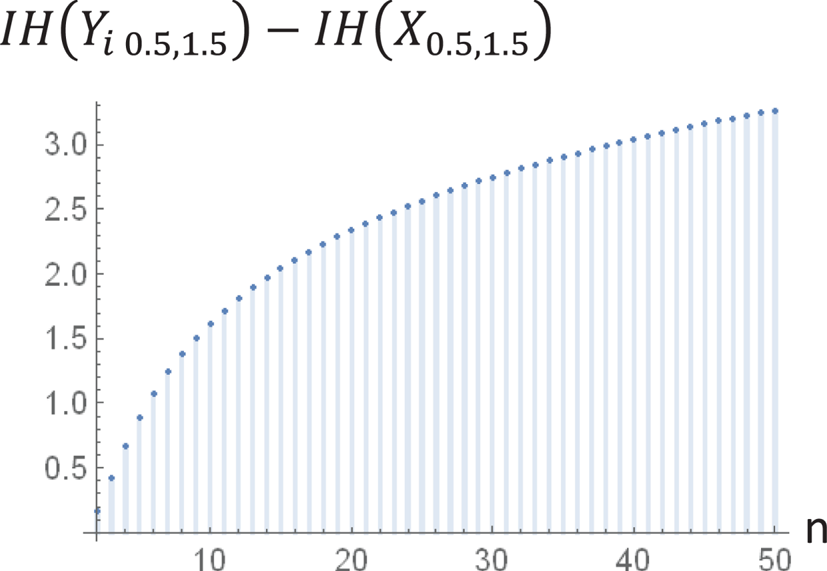
 $(0.5,1.5)$, Figure 3 shows the difference
 $IH(Y_{i~0.5,1.5})-IH(X_{0.5,1.5})$ is positive. Apparently, for any
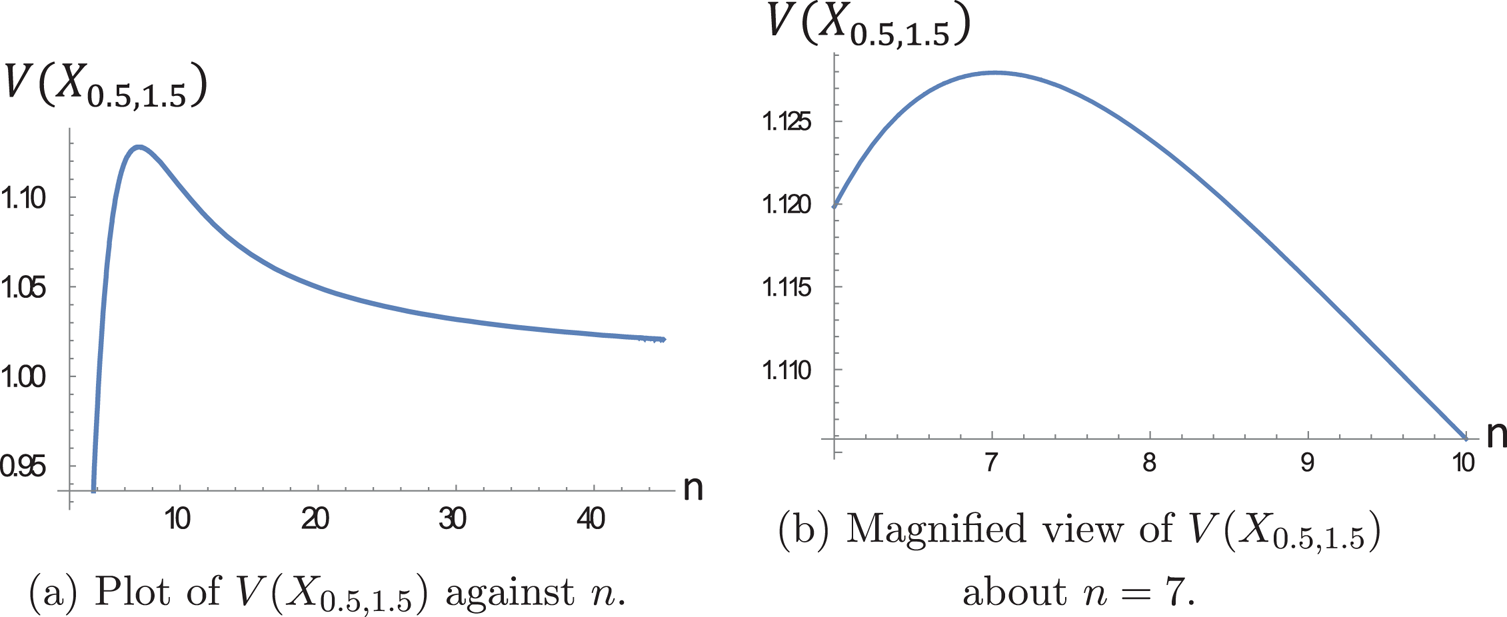
 $n$, the parallel system is most acceptable. However, Figure 4(a) shows that a parallel system with
 $n=7$ has the maximum varentropy. A magnified view of Figure 4(a) is given in Figure 4(b) depicting the peak for
 $n=7$. Obviously, this is not desirable. Thus, a parallel system having seven components fails to be the most acceptable system when scatterness of the information is of utmost importance. Therefore, in choosing better system based on doubly truncated entropy, doubly truncated varentropy should also be taken care of. In conclusion, we state “A system having less uncertainty about its survival time along with less varentropy should be considered as most acceptable system.”
Plot of  $IH(Y_{i\ 0.5,1.5})-IH(X_{0.5,1.5})$ for
 $n\in \{2,\ldots,50\}$.

Graphical representation of the interval varentropy of parallel system.

4.2. First-passage times of an Ornstein–Uhlenbeck jump-diffusion process
The Ehrenfest model traces a simple diffusion process as a Markov chain, where gas molecules in a container separated into two equal parts by a permeable membrane diffuse in a random manner. Such models and its generalizations are of interest in many fields. In recent times, Dharmaraja et al. [Reference Dharmaraja, Di Crescenzo, Giorno and Nobile6] suggested an advanced stochastic model with catastrophes, that is, stochastic resets or in simple terms the effect of such being the instantaneous transition to the state zero at a steady rate  $\xi \gt0$. The system process subject to catastrophes is considered as a jump-diffusion approximation by choosing a suitable scaling approach, where the catastrophe rate remains unaffected. The resulting stochastic process, say
 $\{X(t),t \geq 0 \}$, of jump diffusion is a mean-reverting time-homogeneous Ornstein–Uhlenbeck process with jumps occurring at a rate
 $\xi$ and each jump making
 $X(t)$ instantly attain zero state, having state space
 $\mathbb {R}$, linear drift and infinitesimal variance given by
 $$A_1(x)={-}\alpha x,\quad A_2(x)=\alpha\nu, \quad (\alpha, \nu \gt0).$$
If  $g(t)$ is the first-passage time (FPT) density of FPT random variable
 $T_y$ of
 $X(t)$ through
 $0$, with
 $X(0)=y\neq 0$, we have (cf. Eq. (49) of [Reference Dharmaraja, Di Crescenzo, Giorno and Nobile6])
 \begin{equation} g(t)= e^{-\xi t}{\tilde{g}}(t)+ \xi e^{-\xi t}\,{\rm Erf}(|y|e^{-\alpha t}[\nu(1-e^{{-}2\alpha t})]^{{-}1/2}),\quad t\gt0, \end{equation}
with  $g(0)=\xi$, where
 ${\rm Erf}(\cdot )$ being the error function, and where
 $$\tilde{g}(t)= \frac{2\alpha |y|e^{-\alpha t}}{\sqrt{\pi\nu}(1-e^{{-}2\alpha t})^{3/2}}\exp{\left\{-\frac{y^2 e^{{-}2\alpha t}}{\nu(1-e^{{-}2\alpha t})}\right\}},\quad t\gt0,$$
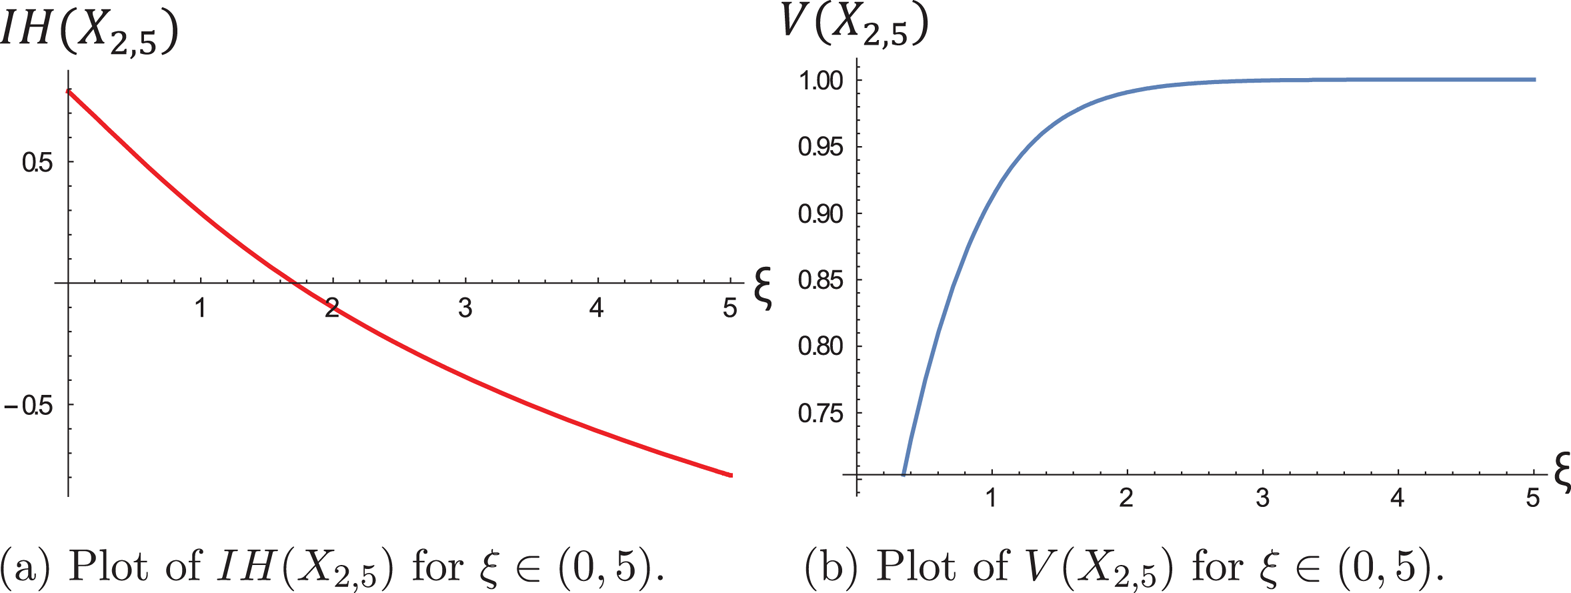
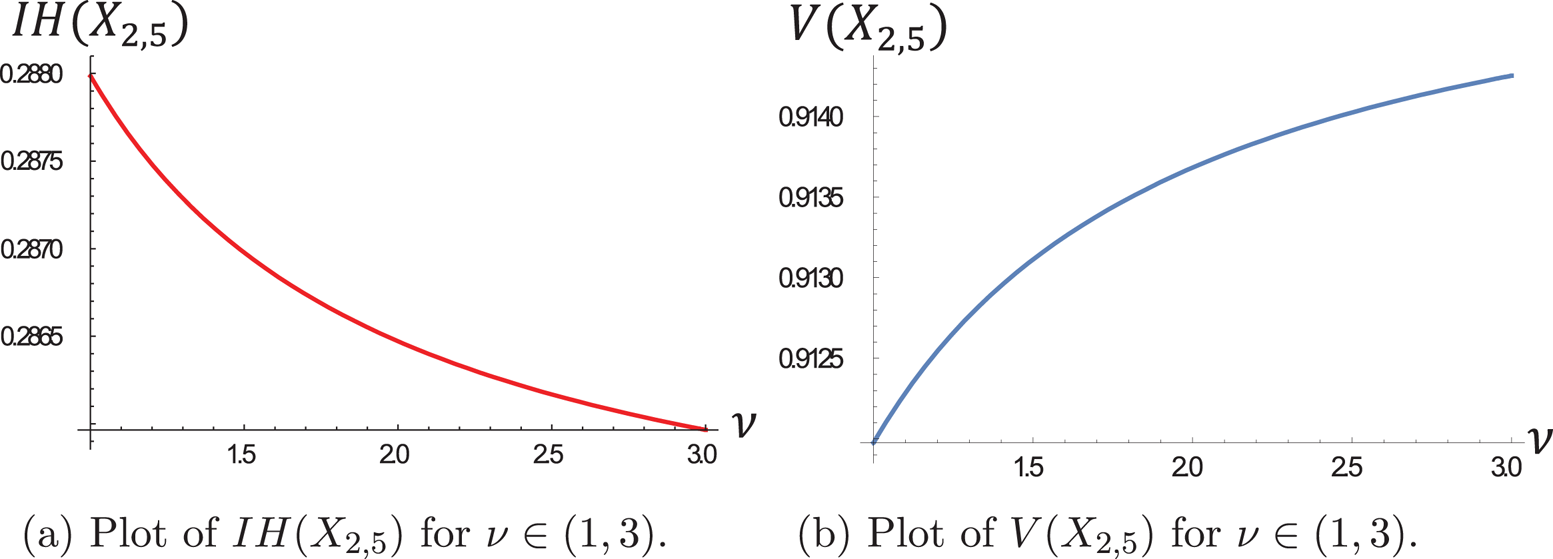
(cf. Eq. (38) of [Reference Dharmaraja, Di Crescenzo, Giorno and Nobile6]) with  $\tilde {g}(0)=0$, is the FPT density of the corresponding diffusion process in absence of catastrophes. We draw attention that the FPT density of the jump-diffusion process marks its interest in financial mathematics in modeling pricing options with stock prices and time between jumps to describe return in stock index prices under the effect of large jumps or jump rate. To foresee cases observing equal or nearly equal average information content will attract more attention in decision making and thus would require the measure of scatterness. Therefore, analyzing the average information content along with its scatterness between two time points of first-passage time and studying its changes in terms of jump rate and state space may be useful for the market analyst to make improved decision. Figures 5 and 6 show some instances of changes in doubly truncated entropy and varentropy with respect to values of
 $\xi$ and
 $\nu$, respectively. It is shown that increasing jump rate
 $\xi$, decreases entropy while increases varentropy and a similar behavior is seen in terms of
 $\nu$ as well, where increasing
 $\nu$ indicates increasing
 $N$ in the state space.
Graphical representation of (a)  $IH(X_{2,5})$ and (b)
 $V(X_{2,5})$ for
 $\xi \in (0,5)$.

Graphical representation of (a)  $IH(X_{2,5})$ and (b)
 $V(X_{2,5})$ for
 $\nu \in (1,3)$.

5. Conclusion
Most of the survival studies to model statistical data have information of lifetime between two time points. Considering the fact, measure of uncertainty for doubly truncated random variable is given by Sunoj et al. [Reference Sunoj, Sankaran and Maya27]. In this paper, we introduced and studied the doubly truncated varentropy. Its objective in connection with the doubly truncated entropy is to measure the scatterness in it. Precisely, it provides variability of information given by doubly truncated entropy. We presented several properties covering monotonicity, behavior under transformation, result for its constancy. In addition, after exploring bounds, some applications of doubly truncated varentropy have been discussed in details illustrating its advantages.
Acknowledgments
We would like to take this opportunity to express our sincere gratitude to the editorial board member and the referees for their time to provide deep attention and valuable insights which have helped in making this manuscript much more nuanced.
Conflict of interest statement
On behalf of all authors, the corresponding author states that there is no conflict of interest.