




Introduction
Since the advent of agriculture ∼13,000 years ago, crop breeders have developed numerous techniques to manipulate the phenotypes of cultivated crops, such that crop species display desirable and favourable characteristics associated with food production and consumption (Bradshaw, Reference Bradshaw2017; Gentile and La Malfa, Reference Gentile, La Malfa, Farooq and Pisante2019). With the rising global population, it has become important for breeders to produce varieties with high productivity and performance in their target production systems (Acquaah, Reference Acquaah2012). However, crop breeding programs largely address trait improvement in industrial models of food production. While such systems have produced food calories at unprecedented rates, they are also commonly responsible for among the largest alterations to Earth systems and functions, including greenhouse gas emissions (Valenzuela, Reference Valenzuela2016; Fuentes-Ponce et al., Reference Fuentes-Ponce, Gutiérrez-Díaz, Flores-Macías, González-Ortega, Mendoza, Sánchez, Novotny and Espíndola2022), freshwater and soil pollution and depletion (Horrigan et al., Reference Horrigan, Lawrence and Walker2002; Ingrao et al., Reference Ingrao, Strippoli, Lagioia and Huisingh2023) and changes to global biogeochemical cycles (Zaman et al., Reference Zaman, Ayaz and Puppe2025). In relation to our research here, industrial farming systems are also heavily reliant on the cultivation of high-yielding crop varieties that are explicitly bred or developed in order to optimize production in monocultures. Many breeding programs that include trait improvement focus on monoculture systems and are among the most important factors amplifying the genetic erosion and homogenization of crop varieties and a general loss of diversity in our food systems (Horrigan et al., Reference Horrigan, Lawrence and Walker2002; Rauf et al., Reference Rauf, Silva, Khan and Naveed2010; Valenzuela, Reference Valenzuela2016; Louwaars, Reference Louwaars2018).
In contrast, breeding in organic (and other low-input) agriculture systems remains largely under explored (Isaac et al., Reference Isaac, Nimmo, Gaudin, Leptin, Schmidt, Kallenbach, Martin, Entz, Carkner, Rajcan, Boyle and Lu2021). Organic agriculture is one of many alternative systems that aim to balance crop productivity with ecological sustainability (defined broadly). By substituting synthetic agrochemicals in favour of organic amendments and prioritizing crop diversity, organic systems offer greater resilience and local adaptation towards environmental change and climate (Zhang, Reference Zhang2024). However, despite the apparent benefits of organic systems towards agricultural resource conservation and environmental protection (Sanders et al., Reference Sanders, Brinkmann, Chmelikova, Ebertseder, Freibauer, Gottwald, Haub, Hauschild, Hoppe, Hülsbergen, Jung, Kusche, Levin, March, Schmidtke, Stein-Bachinger, Treu, Weckenbrock, Wiesinger and Heß2025), organic systems are often under scrutiny for lower crop yields when compared to conventional agriculture (Gamage et al., Reference Gamage, Gangahagedara, Gamage, Jayasinghe, Kodikara, Suraweera and Merah2023; Zhang, Reference Zhang2024). One hypothesis is that yield differences between organic and industrial farming are due to crop breeding programs, which often prioritize crop development for production in conventional agricultural systems, defined by high levels of resource availability. Indeed, most cultivars used in organic farming were originally bred for the high-input, chemically intensive system of conventional agriculture (Murphy et al., Reference Murphy, Campbell, Lyon and Jones2007; Lammerts van Bueren et al., Reference Lammerts van Bueren, Jones, Tamm, Murphy, Myers, Leifert and Messmer2011). However, breeding for organic systems requires crops with a unique set of traits that are optimized for the variable, low-input conditions of these systems (Murphy et al., Reference Murphy, Campbell, Lyon and Jones2007; Maddox, Reference Maddox2015; Rolhauser et al., Reference Rolhauser, Windfeld, Hanson, Wittman, Thoreau, Lyon and Isaac2022). As such, their production potential does not reflect the reality or principles governing organic agriculture, which may close the yield gap often shown between organic and industrial agriculture (Seufert et al., Reference Seufert, Ramankutty and Foley2012). Thus, increased research on the impacts of organic breeding on crop trait expression holds an important position to bridge demands for higher productivity with more resilient and sustainable agroecosystems.
Regardless of production system, breeding intensity can influence the amount of genetic diversity present in the germplasm of cultivated crop varieties over time (Rauf et al., Reference Rauf, Silva, Khan and Naveed2010). Systematic breeding practices produce breeding classes that act as population sources for variety improvement. These classes reflect differing degrees of human intervention and correspond to genetic changes or losses accumulated over a variety’s breeding history. After wild and landrace varieties, open-pollinated (OP) varieties have the greatest genetic base, followed by breeding lines (BL) (inbred pure-line varieties) and F1 hybrids (Rauf et al., Reference Rauf, Silva, Khan and Naveed2010; Acquaah, Reference Acquaah, Al-Khayri, Jain and Johnson2015). At the same time, within each breeding class, genetic diversity also narrows as successive generations are released from parent lines (Acquaah, Reference Acquaah, Al-Khayri, Jain and Johnson2015). Here, variety-specific improvements can alter crop trait expression by persistent farmer selection for desirable qualities from parents (Ellison, Reference Ellison, Simon, Iorizzo, Grzebelus and Baranski2019).
The presence or lack of genetic variability can, in certain cases, alter crop traits related to performance in different conditions. For example, landrace varieties have been used as sources of alleles to improve crop adaptation to stressful biotic and abiotic conditions (Sanchez et al., Reference Sanchez, Ben Sadoun, Mary-Huard, Bauland, Palaffre, Lagardère, Madur, Combes, Melkior, Bettinger, Murigneux, Moreau and Charcosset2025). Another study on the interactions between genotype and environment in hybrid maize cultivars found that breeding for adaptation in temperate environments removed genes that enable plasticity in other environments (Gage et al., Reference Gage, Jarquin, Romay, Lorenz, Buckler, Kaeppler, Alkhalifah, Bohn, Campbell, Edwards, Ertl, Flint-Garcia, Gardiner, Good, Hirsch, Holland, Hooker, Knoll, Kolkman and de Leon2017). As such, breeding history, either via breeding classes or through variety-level improvements, influences crop trait expression by altering the genetic base necessary to adapt to variability across different agricultural systems. Thus, it is important to understand and assess the effect of breeding on crop traits and the trait relationships that affect crop fitness, physiology and performance across and within different production environments, especially given the heterogeneous nature of organic systems.
Our understanding of the effects of breeding on the traits and relationships of crop vegetative structures has increased considerably in recent years. Specifically, more research now exists that characterizes how breeding has altered crop functional trait expression, which includes morphological, physiological, phenological and biochemical characteristics of a plant which can help predict or understand its role in an agroecosystem (Martin and Isaac, Reference Martin and Isaac2015). However, there remains less knowledge surrounding how breeding influences seed traits and trait relationships in either conventional or organic agroecosystems. This is despite breeding and domestication syndromes being organ-specific (Smýkal et al., Reference Smýkal, Nelson, Berger and Von Wettberg2018) and plant fitness and performance across environmental/climatic gradients being correlated with reproductive traits (Baroux and Grossniklaus, Reference Baroux, Grossniklaus and Grossniklaus2019; Fernández-Pascual et al., Reference Fernández-Pascual, Mattana and Pritchard2019). A number of studies have explored how artificial selection, in the form of breeding and domestication, influences seed trait relationships, notably those between seed size and seed number (Sadras, Reference Sadras2007; Golan et al., Reference Golan, Ayalon, Perry, Zimran, Ade-Ajayi, Mosquna, Distelfeld and Peleg2019; Castillo-Bravo et al., Reference Castillo-Bravo, Fort, Cashell, Brychkova, McKeown and Spillane2022). Others have focused on its effects on seed morphology traits such as seed size and shattering (Meyer et al., Reference Meyer, DuVal and Jensen2012). However, the influence of breeding on other morphological seed traits and relationships is less well explored. This is despite evidence of an interlinked and interdependent network of seed traits which directly and indirectly influence critical fitness-related functions of persistence, dispersal, germination timing and establishment (Saatkamp et al., Reference Saatkamp, Cochrane, Commander, Guja, Jimenez-Alfaro, Larson, Nicotra, Poschlod, Silveira, Cross, Dalziell, Dickie, Erickson, Fidelis, Fuchs, Golos, Hope, Lewandrowski, Merritt and Walck2019). Thus, this study aims to bridge this research gap by assessing how seed morphological traits and relationships change with breeding history in seeds bred for conventional and organic systems.
The focal crop in this study is the cultivated carrot (Daucus carota ssp. sativus), a biennial member of the Apiaceae family, which includes other important crops such as fennel, celery, cilantro and dill (Que et al., Reference Que, Hou, Wang, Xu, Tan, Li, Wang, Khadr and Xiong2019; Spooner, Reference Spooner, Simon, Iorizzo, Grzebelus and Baranski2019; Simon, Reference Simon, Al-Khayri, Jain and Johnson2021). Carrots are an outcrossing, insect-pollinated angiosperm and possess compound umbel inflorescences (Izzo et al., Reference Izzo, Romano, De Pascale, Mele, Gargiulo and Aronne2019; Linke et al., Reference Linke, Alessandro, Galmarini, Nothnagel, Simon, Iorizzo, Grzebelus and Baranski2019; Simon, Reference Simon, Al-Khayri, Jain and Johnson2021). Each inflorescence consists of several smaller, higher-order umbels (umbellets) that emerge from a central floral axis, which gives rise to hundreds of white flowers (Izzo et al., Reference Izzo, Romano, De Pascale, Mele, Gargiulo and Aronne2019; Linke et al., Reference Linke, Alessandro, Galmarini, Nothnagel, Simon, Iorizzo, Grzebelus and Baranski2019; Que et al., Reference Que, Hou, Wang, Xu, Tan, Li, Wang, Khadr and Xiong2019). Once pollinated, the inferior ovary of each flower develops into a dry fruit (schizocarp) that splits into two at maturity (Izzo et al., Reference Izzo, Romano, De Pascale, Mele, Gargiulo and Aronne2019; Kadluczka and Grzebelus, Reference Kadluczka and Grzebelus2022). The resulting mericarps are curved and ribbed, containing seeds (Figure 1). Each seed possesses a spiny coat, which remains attached to the flower style by a stylopodium until the time for dispersal or, in the case of cultivated carrots, harvest (Izzo et al., Reference Izzo, Romano, De Pascale, Mele, Gargiulo and Aronne2019; Kadluczka and Grzebelus, Reference Kadluczka and Grzebelus2022). Carrots are also important economic and nutritional root crops (Nagraj et al., Reference Nagraj, Jaiswal, Harper, Jaiswal and Jaiswal2020; Simon, Reference Simon, Al-Khayri, Jain and Johnson2021). Globally, they are one of the most popularly grown vegetables (Sharma et al., Reference Sharma, Karki, Thakur and Attri2012) and are the second most grown field vegetable crop in Canada, as of 2025 (Canada, 2026). They are often sought after as they are a good source of dietary antioxidants such as alpha and beta carotene (precursor to vitamin A), vitamin E, anthocyanins (Nagraj et al., Reference Nagraj, Jaiswal, Harper, Jaiswal and Jaiswal2020) and dietary fibres (Sharma et al., 2012). Because the edible portion of carrots (i.e. the taproot) is in direct contact with soil, growing these crops in organic systems becomes important for any ideally chemical-free produce.
Representative images of carrot seeds belonging to 15 different varieties arranged by breeding classes, including inbred breeding lines (panels A–F), a first filial generation hybrid (panel G) and open-pollinated varieties (panels H–O). Panel P shows the coat and spine traits that were measured for each seed. Camera magnification and scale bar are shown for each image.

Although carrots are seed-propagated (Coe et al., Reference Coe, Bostan, Rolling, Turner-Hissong, Macko-Podgórni, Senalik, Liu, Seth, Curaba, Mengist, Grzebelus, Van Deynze, Dawson, Ellison, Simon and Iorizzo2023), little, if any, information exists on the effects of organic and conventional breeding history on cultivated carrot seed traits and their relationships. Thus, this study aims to characterize variation in seed morphology in 15 cultivated carrot varieties by answering the following questions: (1) Do seed morphological traits vary and co-vary among carrot varieties? (2) If so, does breeding history (characterized as either breeding class or variety identity) explain variation and relationships in seed traits? (3) Are patterns of seed trait variation and covariation consistent with selection during breeding for carrot varieties and finally (4) what implications does this have for breeding for organic production systems?
Materials and methods
Study varieties and seed trait determination
Our study focused on carrot seeds from 15 varieties sourced from multiple farms across Canada, as part of the Canadian Organic Vegetable Improvement (CANOVI) variety trials. Information on each includes a variety ID, variety name, breeding class (i.e. inbred BL [n = 6], a first filial generation hybrid [F1; n = 1], or bred through OP [n = 8]) and breeding production system. All of the varieties were organically bred, except the F1 hybrid variety (Bolero) that was conventionally bred and two OP varieties (Touchon Deluxe and Jaune de Doubs), which were heirloom varieties. We also gathered information on the breeder, seed lot year and seed lot producer. Information on each variety and its breeding history is reflected in Table 1.
Carrot varieties, their breeding characteristics and seed production data. Information includes variety ID, variety name, breeding class, production system (whether it is bred for conventional or organic systems, or is an heirloom variety), breeder, seed lot year and seed lot producer

Table 1 Long description
Columns list variety id, variety name, breeding class, production system, breeder, seed lot year, and seed lot producer for 15 carrot entries. Breeding class includes six breeding line entries, one first filial generation entry, and eight open pollinated entries. Production system is organic for 12 varieties, conventional for Bolero F1, and heirloom for Jaune de Doubs and Touchon Deluxe. Breeder is Organic Seed Alliance or Phil Simon for 10 varieties, Canadian Organic Vegetable Improvement Project for Canovi Orange, Vilmorin for Bolero F1, Fruition Seeds for Dulcinea, and Heirloom for Jaune de Doubs and Touchon Deluxe. Seed lot year is 2023 for F7119B, Purple Orange Purple, R6220, Sunset, Fantasia, and Cioa Orange Strain Cross; 2022 for Y1246, Carnelian, Dulcinea, Cioa Orange Flavor Select, Uberlandia Flavor, and Touchon Deluxe; 2021 for Canovi Orange; and unknown for Bolero F1 and Jaune de Doubs. Seed lot producer is Organic Seed Alliance or Phil Simon for nine varieties, University of British Columbia for Canovi Orange, Johnny′s Selected Seeds for Bolero F1, Fruition Seeds for Dulcinea, La Societe des Plantes for Jaune de Doubs, and BC Eco Seed Coop for Touchon Deluxe.
For each variety, we analysed 11 morphological traits on n = 15 seeds per variety, such that traits were analysed on n = 195 seeds in total, equally distributed across varieties. First, we recorded seed mass (mg) for each individual seed, taken as the average of two weight measurements per seed. We then generated digital images of seeds taken at 1.2× magnification using an Olympus SZ61 stereo microscope fitted with an Olympus EP50 camera attachment (Evident Scientific Inc., Waltham, Massachusetts, USA), and used EPView50 software v.1.4 calibrated to 1 μm to measure seed length (inclusive of the stylopodium; mm) and width (inclusive of the seed coat but excluding any spines; mm) measured at the major and minor seed axes, respectively (Figure 1). We then calculated seed area and perimeter (both excluding spines; mm2 and mm, respectively), as well as seed coat width, spine length and stylopodium length (all in mm). These measurements were used to estimate seed shape indices, including aspect ratio (AR), circularity (also known as compactness, and used interchangeably in this study; C) and roundness (R) following equations by Cervantes et al. (Reference Cervantes, Martín and Saadaoui2016):
 \begin{equation}AR\, = \,\frac{length}{width}\end{equation}
 \begin{equation}C\, = \,\frac{4\pi \,\times \,area}{perimete{r^2}}\end{equation}
 \begin{equation}R\, = \,\frac{4\times \,area}{\pi \,\times {[major\,axis]^2}}\end{equation}
For analysis and data presentation (described below), seed traits were grouped into the following trait groups: (1) seed size traits including length, width, area, perimeter and seed mass; (2) coat and spine traits including seed coat width, spine length and stylopodium length (Figure 1P); and (3) seed shape indices including AR, C and R.
Data analysis
All statistical analyses were conducted in R v. 4.2.2 (R Foundation for Statistical Computing, Vienna, Austria). First, for each trait, we calculated variety-specific descriptive statistics including mean, standard deviation (SD), minimum and maximum trait values, and the coefficient of variation (CV). We then used analysis of variance (ANOVA) to test whether or not traits varied statistically across varieties and across BL. Additionally, we used a variance partitioning analysis to quantify the proportion of variation in each trait explained by breeding history (defined by breeding class and variety identity). Variance partitioning was performed by first fitting a linear mixed-effects model with nested random effects using the ‘lme’ function in the ‘nlme’ R package (Pinheiro and Bates, Reference Pinheiro and Bates2025). Specifically, in this model, variety identity nested within breeding class was fitted as nested random effects, and an intercept as the only fixed effect. We then used the ‘varcomp’ function in the ‘ape’ R package (Paradis and Schliep, Reference Paradis and Schliep2019) to estimate variance components associated with the nested random effects; variation in seed traits not accounted for by either variety identity or breeding class was characterized as ‘unexplained’ variance. Sample sizes in these models were n = 195 for all traits, evenly distributed across varieties (n = 15 in all cases), with n = 90, n = 120 and n = 15 observations across inbred BL, OP varieties and F1, respectively.
We then used two statistical approaches to quantify bivariate and multivariate relationships among seed traits. First, we used Pearson correlation tests to evaluate all bivariate relationships among traits (where n = 225 in all cases) and presented these relationships visually using the ‘qgraph’ function in the ‘qgraph’ R package (Epskamp et al., Reference Epskamp, Costantini, Haslbeck and Isvoranu2011). Due to the large number (55) of bivariate correlations being evaluated across our 11 traits, we interpreted statistical significance of correlations as occurring when Pearson correlation p ≤ 0.01.
We also employed a principal components analysis (PCA) implemented using the ‘PCA’ function in the ‘FactoMineR’ R package (Lê et al., Reference Lê, Josse and Husson2008) to characterize multivariate trait relationships in our dataset (n = 225). We also used the ‘dimdesc’ function in the ‘FactoMineR’ R package (Lê et al., Reference Lê, Josse and Husson2008) to identify the traits that statistically significantly loaded onto PCA axes. Here, we focused on only the first three PCA axes. Our PCA was also supplemented with a permutational multivariate analysis of variance (PerMANOVA), which tested whether or not multivariate trait syndromes (as per our PCA) varied significantly as a function of variety and/or breeding class. This PerMANOVA was implemented using the ‘adonis’ function in the ‘vegan’ R package (Oksanen et al., Reference Oksanen, Simpson, Blanchet, Kindt, Legendre, Minchin, O’Hara, Solymos, Stevens, Szoecs, Wagner, Barbour, Bedward, Bolker, Borcard, Borman, Carvalho, Chirico, De Caceres and Weedon2001), with statistical significance of each of the factors (variety identity and breeding class) being assessed against n = 999 permutations of our trait dataset.
Results
Trait variation across varieties
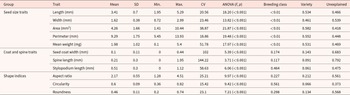
All 11 seed traits explored here varied significantly among carrot varieties (ANOVA p < 0.001 in all cases; Table 2). Seed size traits varied significantly across varieties, with CVs of seed length, width, perimeter, area and mean weight ranging from 18.86 to 51.78% across all varieties (Table 2). For this trait group, trait variation was more strongly related to variety identity than breeding class. Variety identity explained 46.1–58.2% of the variance in these traits, compared to an observed <1% explained by breeding class for all five traits (Table 2). Across breeding classes, general trends in seed size traits were less consistent, though OP varieties expressed a wider range of mean seed size values compared to BL varieties. Specifically, mean length ranged 2.48–4.31 mm in OP varieties versus 3.19–3.79 mm in BL varieties (Table 3; Figure 2A), seed width from 1.33 to 2.10 mm in OP varieties versus 1.12–1.74 mm in BL varieties (Table 3; Figure 2B) and mean weight from 0.93 to 3.51 mg in OP varieties versus 0.93–2.29 mg in BL varieties (Table 3; Figure 2E); seed area and perimeter followed similar patterns, being more variable in OP varieties compared to BL varieties (Table 3; Figure 2C and D). As an example, while they are all OP varieties, ‘Orange Strain Cross’ (OS), ‘Orange Flavour Select’ (OFS) and ‘Uberlandia’ (UBL) consistently ranked among the highest for seed size traits, while ‘Carnelian’ (CAR), ‘Dulcinea’ (DULC) and ‘Jaune de Doubs’ (JD) ranked lowest (Table 3; Figure 2). With the exception of ‘Y1246’, which consistently fell into the lower range of values, most BL varieties stayed in the mid-range of seed size trait values (Table 3; Figure 2). Our only F1 variety, ‘Bolero’ (BOL), was also largely intermediary in its seed size traits relative to all other varieties and breeding classes, except for weight, where it ranked as one of the heavier varieties (Figure 2, Table 3).
Trait variation in carrot seeds measured across 15 cultivated carrot varieties. Panels A–E present data for seed size traits, consisting of seed length (mm), width (mm), area (mm2), perimeter (mm) and weight (mg), respectively. Panels F–H represent coat and spine traits, and consist of seed coat width, spine length and stylopodium length (all in mm). Data for aspect ratio, circularity and roundness are presented in panels I–K. Data represent individual trait observations (n = 225 in total, closed circles), along with mean ± standard error values for each variety (with closed squares and error bars).

Figure 2 Long description
Multiple dot plots labeled A to K, each representing different seed traits across carrot varieties. Plots A to E focus on seed size traits: seed length, width, area, perimeter and weight. Plots F to H display coat and spine traits: seed coat width, spine length and stylopodium length. Plots I to K illustrate shape indices: aspect ratio, circularity and roundness. Each plot has the x-axis labeled with carrot varieties and the y-axis representing the specific trait measurement in millimeters or milligrams. The legend indicates three categories: breeding line, first filial generation (F1) and open pollinated, represented by different symbols. Data points are shown as individual observations with mean values and error bars for each variety. Key trends include variations in seed size traits, with open pollinated varieties generally showing a wider range of values compared to breeding lines. Notable outliers and spreads are visible in several plots, indicating significant trait variation among the varieties.
Descriptive statistics on 11 seed traits measured across 15 carrot varieties. The mean, standard deviation (SD), minimum and maximum trait values, and coefficient of variation (CV) are presented for each trait, along with results of an analysis of variance (ANOVA) test assessing statistical differences between the carrot varieties. Also shown here are the results of a variance partitioning analysis that assessed the proportion of variance in each trait explained by breeding history (breeding class and variety identity), as well as the proportion of trait variation not explained by these factors

Table 2 Long description
Descriptive statistics are listed for 11 carrot seed traits, grouped as seed size traits, coat and spine traits, and shape indices, with columns for mean, SD, minimum, maximum, CV, ANOVA F and p, and variance shares for breeding class, variety, and unexplained. Seed size traits include length mean 3.41 mm, SD 0.7, minimum 1.95, maximum 5.29, CV 20.56; width mean 1.62 mm, SD 0.38, minimum 0.72, maximum 2.99, CV 23.46; area mean 4.26 mm2, SD 1.66, minimum 1.41, maximum 10.44, CV 38.87; perimeter mean 9.29 mm, SD 1.75, minimum 5.45, maximum 13.93, CV 18.86; and mean weight mean 1.98 mg, SD 1.02, minimum 0.1, maximum 5.4, CV 51.78. Coat and spine traits list seed coat width mean 0.1 mm, SD 0.11, minimum 0, maximum 0.44, CV 102; spine length mean 0.21 mm, SD 0.3, minimum 0, maximum 1.95, CV 144.22; and stylopodium length mean 0.51 mm, SD 0.3, minimum 0, maximum 1.12, CV 58.63. Shape indices list aspect ratio mean 2.17, SD 0.55, minimum 1.28, maximum 4.51, CV 25.21; circularity mean 0.6, SD 0.09, minimum 0.36, maximum 0.82, CV 15.42; and roundness mean 0.46, SD 0.11, minimum 0.2, maximum 0.74, CV 23.1. ANOVA results for each trait are reported as F with p less than 0.001, with F values of 18.20 for length, 13.82 for width, 21.87 for area, 19.48 for perimeter, 17.97 for mean weight, 5.39 for seed coat width, 3.71 for spine length, 6.06 for stylopodium length, 9.97 for aspect ratio, 9.42 for circularity, and 7.21 for roundness. Variance partitioning shows breeding class values of less than 0.01 for all five seed size traits, then 0.174 for seed coat width, 0.117 for spine length, 0.464 for stylopodium length, 0.227 for aspect ratio, 0.561 for circularity, and 0.298 for roundness; variety values range from 0.061 for stylopodium length to 0.582 for area; unexplained values range from 0.373 for circularity to 0.792 for spine length.
Trait variation in 11 traits related to seed size, coat and spine traits, and seed shape across 15 carrot varieties. In all cases, trait means and standard errors are shown, which are based on analyses of n = 15 seeds per variety. Traits include length (mm), width (mm), area (mm2), perimeter (mm), mean weight (mg), seed coat width (mm), spine length (mm), stylopodium length (mm), aspect ratio (AR), circularity (C) and roundness (R). Variety acronyms along with their breeding class categories are presented in full in Table 1

Table 3 Long description
Fifteen carrot varieties are listed with mean plus or minus standard error for seed size traits, coat and spine traits, and shape indices. Seed size columns are length in millimeters, width in millimeters, area in millimeters squared, perimeter in millimeters, and mass in milligrams. Coat and spine columns are seed coat width in millimeters, spine length in millimeters, and stylopodium length in millimeters, followed by shape indices AR, C, and R. OFS reports length 4.31 plus or minus 0.11, width 2.00 plus or minus 0.05, area 6.22 plus or minus 0.27, perimeter 11.47 plus or minus 0.29, and mass 3.17 plus or minus 0.17; OS reports length 4.27 plus or minus 0.16, width 2.10 plus or minus 0.10, area 6.78 plus or minus 0.46, perimeter 11.51 plus or minus 0.37, and mass 3.51 plus or minus 0.29. Y1246 reports length 3.30 plus or minus 0.12, width 1.12 plus or minus 0.12, area 2.84 plus or minus 0.42, perimeter 8.38 plus or minus 0.33, and mass 0.93 plus or minus 0.25; DULC also reports mass 0.93 plus or minus 0.10 with length 2.48 plus or minus 0.10 and area 2.46 plus or minus 0.17. BOL reports seed coat width 0 plus or minus 0 and spine length 0 plus or minus 0, with stylopodium length 0.06 plus or minus 0.04. Spine length ranges from 0.10 plus or minus 0.03 in TDE and 0.10 plus or minus 0.04 in JD up to 0.60 plus or minus 0.09 in SUN. AR ranges from 1.74 plus or minus 0.03 in BOL to 3.21 plus or minus 0.20 in Y1246, while C ranges from 0.47 plus or minus 0.03 in Y1246 to 0.75 plus or minus 0.01 in BOL, and R ranges from 0.31 plus or minus 0.03 in Y1246 to 0.58 plus or minus 0.02 in BOL.
Traits related to coat and spine morphology were the most variable among varieties, with CVs of 102.0, 144.2 and 58.6% for seed coat width, spine length and stylopodium length, respectively (Table 2, Figure 2). This high variability in coat and spine traits was driven by the F1 variety (BOL), which did not possess a quantifiable seed coat or spines on any individual seeds measured. Both seed coat width and spine length possessed an average of 0 ± 0 mm, compared to an overall average of 0.10 ± 0.11 mm across our entire dataset (Tables 2 and 3). Similarly, BOL maintained the smallest stylopodium length values observed across all varieties (0.06 ± 0.04 mm on average), which were nearly an order of magnitude lower than mean stylopodium length values observed across the entire dataset (Tables 2 and 3). In turn, the variance partitioning analysis indicated that breeding class was the most important factor in explaining coat and spine traits. Specifically, breeding class categories explained 17.4% of the variation in seed coat width (versus 14.3% explained by variety identity), 11.7% of the variation in spine length (9.1% explained by variety identity) and 46.4% of the variation in stylopodium length (6.1% explained by variety identity; Table 2).
While seed size traits were largely idiosyncratic among varieties, the relationships among seed size traits – as characterized using our three seed shape indices – were better explained by breeding class compared to variety. Specifically, breeding class explained 22.7–56.1% of the variance in these traits, versus 6.6–21.2% explained by variety identity (Table 2). Generally, OP varieties (e.g. DULC, JD and UBL) were more compact/circular compared to BL varieties, with C values ranging from 0.57 to 0.65 and 0.47 to 0.60, respectively (Table 3; Figure 2J). Similarly, seeds of OP varieties expressed lower AR values compared to BL varieties (e.g. in Y1246 and F7119B), indicating a lower length: width ratio in this breeding class (Figure 2I), which was also associated with OP varieties expressing more rounded seeds (Figure 2K). Here, the F1 variety also contributed to breeding classes being distinct from one another in their traits, with BOL expressing the most compact/circular (C) and rounded (R) seeds with the lowest length:width ratio (AR; Figure 2I, J, K).
Trait bivariate and multivariate relationships
Seed traits were strongly correlated with one another across our entire dataset (n = 225 observations for all tests), with 35 of the 55 (∼64%) trait correlations being statistically significant (p < 0.01 in all cases, absolute r ≥ 0.14; Figure 3A). Bivariate trait correlations were strongly positive among all size-related traits (r ≥ 0.59 for all 10 correlations across the five size traits), as well as between size-related traits and shape indices (Figure 3A). Spine length and seed coat width were significantly positively correlated with one another (r = 0.14), though largely unrelated to other seed traits evaluated here (Figure 3B). Stylopodium length was more well integrated with other traits, including those related to seed size, being significantly correlated positively with seed length and perimeter (r = 0.32 and 0.24, respectively) and negatively with width and weight (r = −0.018 and −0.14, respectively), as well as all shape indices evaluated here (Figure 3A, B). Seed indices were integrated with seed size metrics (Figure 3B), and these analyses indicated that AR largely trades off against circularity/compactness and roundness (Figure 3A, B).
Trait relationships of 11 seed traits measured across 15 cultivated carrot varieties. Panel A displays the results from Pearson correlation tests evaluating bivariate correlations between traits represented by 15 seeds per variety (such that n = 225 seeds for each correlation test). Within individual cells, only statistically significant (p ≤ 0.05) Pearson correlation test results are shown, such that values within the coloured circles represent Pearson correlation coefficients (r), the size of the circles is scaled to absolute r values, and colours represent the direction of Pearson correlations. Panel B represents a correlation network of seed size traits (purple circles), coat and spine traits (blue) and shape indices (yellow). Statistically significant relationships (where Pearson p ≤ 0.01) are indicated by connecting lines such that solid black lines represent positive correlations, grey dashed lines represent negative correlations and line thickness represents the strength of the relationship (as per Pearson r values). Panel C displays a principal component analysis (PCA) evaluating multivariate relationships across the measured traits and varieties. Individual points correspond to a seed (such that n = 225 seeds). Statistical relationships between PCA axes and individual traits are presented in Supplementary Table S1, while PerMANOVA evaluating statistical differences in multivariate trait syndromes across variety line and breeding class are presented in Supplementary Table S2.

Figure 3 Long description
Panel A is a correlation matrix displaying Pearson correlation coefficients for seed traits such as width, area, perimeter, weight, seed coat width, spine length, stylopodium length, aspect ratio, circularity and roundness. Values range from negative to positive, with significant correlations highlighted. Panel B is a correlation network showing seed size traits, coat and spine traits and shape indices. Nodes are connected by lines indicating positive or negative correlations, with line thickness representing strength. Panel C is a PCA biplot, with PCA axis 1 explaining 10.5 percent variance and PCA axis 2 explaining 7.3 percent variance. Traits like aspect ratio and stylopodium length are marked, showing their influence on the axes. Key findings include strong positive correlations among size-related traits and notable negative correlations between certain shape indices and size metrics.
In multivariate trait space, the first two axes of our principal component analysis explained 72.8% of the variance in the 11 traits evaluated here. Specifically, PCA axis 1 explained 40.1% of the variance and represented covariation among all size-related traits (r = 0.68–0.965, p < 0.01 for all five size-related traits). Positive values along the first PCA axis were also associated with seeds that are more compact/circular and rounded (r = 0.487 and 0.372, respectively, p < 0.01 in both cases; Figure 3C, Supplementary Table S1). Along this axis then, larger and more compact/ circular/round seeds trade off against seeds with the opposite suite of traits, which also expressed smaller stylopodiums and lower aspect (i.e. length:width) ratios (r = −0.23 and −0.471, respectively; p < 0.01 for both traits along PCA axis 1; Supplementary Table S1).
Principal component axis 2 explained 32.7% of the variation in traits and was most strongly defined by its positive association with stylopodium length (r = 0.775, p < 0.001) and AR (r = 0.773, p < 0.001), which traded off against seed compactness/ circularity and roundness (r = −0.819 and −0.879, p < 0.01 in both cases; Figure 3B, Supplementary Table S1). Coat and spine traits, and their contributions to seed mass, defined by PCA axis 3, explained 10.4% of the variance in traits evaluated here. This axis was defined by larger values of seed coat width and spine length (r = 0.796 and 0.675, p < 0.001 in both cases), which traded off against seed weight (r = −0.164, p < 0.01, Figure 3B, Supplementary Table S1). These results are confirmed by the associations evaluated in PCA axis 1 versus PCA axis 3 (Supplementary Figure S1).
Our PerMANOVA indicated that both breeding class and variety identity were significant contributors to variability in seed traits across multivariate trait space, though variety differences were considerably more prominent. Specifically, breeding class explained 5.4% of the variance in multivariate seed trait values (F = 12.1, p < 0.01), while variety identity explained 47.3% of the variation (F = 17.5, p < 0.01; Supplementary Table S2). Similar to analyses of individual traits (Figure 2, Table 2), this finding is due to the trend that, across our dataset, OP varieties expressed a wider range of both PCA axis 1 and 2 scores – especially with regard to seed-size metrics – as compared to BL (Figure 3B). Along the first two PCA axes, the F1 variety BOL expressed multivariate trait values that clustered towards the large/circular/compact/round end of multivariate trait space (Figure 3C).
Discussion
Our results indicate that breeding history shapes carrot seed functional traits, particularly when considering selection at the variety level. Breeding class and variety-level selection within these classes (variety identity) explained a total of ∼21–63% of the variation across all seed traits evaluated here (Table 2), indicating that seed trait variation is strongly constrained either within varieties (for seed size traits) or within breeding classes (for seed shape and coat/ spine traits). We also show that seed size traits are the dominant axis of variation across carrot seeds (Figure 3C), such that variety identity is the most important driver of multivariate trait syndromes across all 15 varieties studied.
Our results provide early evidence for decreasing trait variability on the basis of breeding class. OP varieties on average possessed the greatest variation in trait expression in both single- and multivariate trait space for all traits analysed (Figure 2; Table 3). This is especially the case for shape and coat/spine characteristics. Simultaneously, BL and hybrid varieties (in that order) exhibited less variation than OP varieties, consistent with expectations that crop uniformity is often selected for at this stage (Rauf et al., Reference Rauf, Silva, Khan and Naveed2010; Ayiecho and Nyabundi, Reference Ayiecho, Nyabundi, Ayiecho and Nyabundi2025). Specifically, trends observed in the F1 hybrid variety ‘Bolero’, which our data suggest is characterized by heavy seeds that lack any coat or spines and are generally constrained to be circular with low length: width ratios (Figure 2), strongly point to the influence of human intervention in structuring trait variation along this continuum. F1 hybrids are preferred commercially for their high-yielding ability, stress resistance and uniformity (Acquaah, Reference Acquaah, Al-Khayri, Jain and Johnson2015; Luby et al., Reference Luby, Dawson and Goldman2016; Colombo and Galmarini, Reference Colombo and Galmarini2017). With the exception of mass and roundness, ‘Bolero’ possessed the smallest variability in all seed traits (Table 3), showing that the ‘Bolero’ variety exhibits traits expected in an intensely artificially selected crop.
While our data reveals trends expected for the breeding classes, it also points to variety identity being a more important predictor of variation in seed size traits, highlighting idiosyncratic variability in these traits across recently diverged varieties. As such, our findings suggest that breeding has altered trait expression such that specific variety selection results in mostly fine-scale variation in carrot seed size traits but less so in seed shape or coat/spine characteristics. High variety-level variation in seed size traits is consistent with research showing that while carrot breeding may influence local genetic diversity, the process does not drastically reduce overall genetic diversity in this crop (Macko-Podgórni et al., Reference Macko-Podgórni, Machaj, Stelmach, Senalik, Grzebelus, Iorizzo, Simon and Grzebelus2017). In turn, it could be that changes to the carrot genome through breeding affect seed size trait expression at a fine scale, but seed shape and coat/spine traits at larger scales of breeding classes.
When taken alongside other research, we also found evidence consistent with the hypothesis that changes in seed morphological trait relationships emerge as a result of artificial selection. A study on D. carota subsp. capillifolius, a close relative of wild carrot, shows values of 4.9 mm, 1.4 mm, 2.06 mg and 3.6 (Kadluczka and Grzebelus, Reference Kadluczka and Grzebelus2022) compared to our study’s mean values of 3.41 mm, 1.62 mm, 1.98 mg and 2.17 for mean length, width, weight and AR, respectively (Table 2). This comparison reveals that the cultivated carrot seeds in this study are smaller and less elongated than wild carrots. Finding that the sole F1 variety expresses little to no discernible seed coats, spines or stylopodiums aligns closely with comparative research suggesting that crops which have undergone artificial selection invest less in seed coat traits compared to their wild progenitors. For example, in a recent study, Milla et al. (Reference Milla, Westgeest, Maestre-Villanueva, Núñez-Castillo, Gómez-Fernández, Vasseur, Violle, Balarynová and Smykal2024) found significant reductions in seed coat investment in cultivated crops, which they and other studies attribute to selection for reduced dormancy, germination predictability, and, at least in certain grain crops, palatability (Harlan et al., Reference Harlan, de Wet and Price1973; Fuller and Allaby, Reference Fuller and Allaby2009; Larson et al., Reference Larson, Piperno, Allaby, Purugganan, Andersson, Arroyo-Kalin, Barton, Climer Vigueira, Denham, Dobney, Doust, Gepts, Gilbert, Gremillion, Lucas, Lukens, Marshall, Olsen, Pires and Fuller2014). Furthermore, the F1 variety possesses large and heavy seeds, which is consistent with much of the literature on the direct or unintended influence of selection on crop seed size trait expression (e.g. Garibaldi et al., Reference Garibaldi, Aizen, Sáez, Gleiser, Strelin and Harder2021). Thus, while seed morphological traits were likely not the target of carrot breeding programs, our findings show that their seeds have been affected by these practices.
Understanding the dynamics between seed traits and crop performance is a vital step for determining what seeds would thrive under organic agriculture. Seed size is a significant indicator of seed quality and potential crop performance, with known associations between larger seeds and germination, vigour and seed yield (Ambika et al., Reference Ambika, Manonmani and Somasundar2014). A recent study, while not on organic farming, on the effect of seed size on soybean performance revealed that larger seeds resulted in increased plant height and number of pods and seeds, highlighting how seed size can affect plant growth and physiology, as well as seed output (Wang et al., Reference Wang, Sun, Yi and Dong2025). Additionally, evaluating how seed size corresponds to seed output/production rates (either on a per-plant or per-unit-biomass basis) across our different breeding classes would represent a key next step in understanding how breeding for organic agriculture influences life history traits and trade-offs in crops (Garibaldi et al., Reference Garibaldi, Aizen, Sáez, Gleiser, Strelin and Harder2021; Martin, Reference Martin2021).
Organic farms are low-input, heterogeneous systems with a variety of conditions (such as pressure from weeds, pests or pathogens) as well as diverse management practices (Lammerts van Bueren et al., Reference Lammerts van Bueren, Jones, Tamm, Murphy, Myers, Leifert and Messmer2011). For crop varieties to thrive in these complex environments, the participatory plant breeding approach is necessary to strongly combine natural and farmer selection (Lammerts van Bueren et al., Reference Lammerts van Bueren, Jones, Tamm, Murphy, Myers, Leifert and Messmer2011), such that crops possess adaptations to stressful conditions while still performing stably in the face of changing environmental conditions (Rolhauser et al., Reference Rolhauser, Windfeld, Hanson, Wittman, Thoreau, Lyon and Isaac2022). The Bolero F1 variety was bred for conventional production systems and possesses larger seeds and reduced exteriors, which are likely to be traits associated with improved performance in agricultural settings. However, our results also show that there are several OP varieties (e.g. ‘Orange Strain Cross’, ‘Orange Flavour Select’ and ‘Uberlandia’) that possess beneficial seed characteristics (e.g. seed size and exterior characteristics) with the potential to thrive in organic systems, while maintaining the genetic basis for further variety development. Based on existing literature on the evolutionary ecology of seed trait change through artificial selection, our findings suggest that breeding for organic production systems, especially through development of OP varieties, may reintroduce life-history characteristics that are significantly reduced during breeding for conventional systems. These characteristics are hypothesized to improve crop performance under greater environmental variation commonly associated with organic systems.
One important limitation here is that our study included only one F1 hybrid. It is possible that different trends might be observed should more F1 hybrids be added and analysed. Our acquired seeds also came from multiple seed producers and included multiple umbel positions and seed lot years, which could have influenced seed trait expression. As such, our findings surrounding both breeding class and variety-level effects, as well as the influence of breeding on seed trait relationships, need to be interpreted with caution. No less, despite these limitations, our results provide evidence that while carrot selection does not target seeds per se, reproductive traits are influenced by artificial selection. Breeding for organic agriculture reintroduces greater variability in traits, with likely implications for crop performance – namely, seed yield and vigour – under the variable environmental conditions inherent in organic systems. Future studies would benefit from greater sample representation for breeding classes. Experimental studies are also needed to evaluate the performance of these varieties in conventional and especially organic systems, to identify whether seed trait variation affects crop fitness and adaptation to different production systems.
Supplementary material
The supplementary material for this article can be found at https://doi.org/10.1017/S0960258526100245.
Acknowledgements
The authors acknowledge the support of Michelle Deng, Dr Ambar Carvallo, and the Canadian Organic Vegetable Improvement (CANOVI) project.
Author contributions
K.N. and M.E.I.: data collection; K.N. and A.R.M.: data analysis; K.N. and A.R.M.: manuscript writing; K.N., M.E.I. and A.R.M.: manuscript editing; and M.E.I.: funding acquisition and logistics.
Funding statement
Funding for this research was provided by the Organic Science Cluster 4, led by the Organic Federation of Canada in collaboration with the Organic Agriculture Centre of Canada at Dalhousie University, supported by Agriculture and Agri-Food Canada. Further funding was provided by a Discovery Grant from the Natural Sciences and Engineering Research Council of Canada to both A.R.M. and M.E.I.
Competing interests
The authors declare no conflicts of interest.
Ethical standards
No ethics approvals were required for this research.
Availability of data and genetic material
Data for this research are available through the Borealis Data Repository, or by written request to the corresponding author.
Code availability
No custom code was used in generating the results of this study.




 Open access

