





Introduction
Rice cultivation occupies a paradoxical position in the sustainability of the global food system. It is indispensable to food security, providing the primary calorie source for more than half of the world’s population, yet it is also a major contributor to anthropogenic climate change (Das et al., Reference Das, Park, Seo and Kim2024). Flooded rice systems account for approximately 10–12% of global methane emissions (Sander et al., Reference Sander, Samson and Buresh2014), making rice one of the largest single agricultural sources of this highly potent greenhouse gas. Because methane has a strong warming effect over short time horizons, reducing emissions from rice cultivation is central to near-term climate mitigation strategies. The challenge, however, lies not in recognizing the need for mitigation but in achieving it without undermining yields, livelihoods, or the resilience of smallholder production systems that dominate global rice cultivation. A wide range of mitigation strategies has been proposed and tested over the past two decades. These include alternate wetting and drying (AWD), mid-season drainage, improved irrigation infrastructure, residue and fertilizer management, and water-saving technologies. Under controlled or experimental conditions, many of these interventions can substantially reduce methane emissions (Bo et al., Reference Bo, Wang, van Groenigen, Linquist, Müller, Li, Yang, Jägermeyr, Qin and Zhou2024; Coggins et al., Reference Coggins, McDonald, Silva, Urfels, Nayak, Sherpa, Jat, Jat, Krupnik, Kumar, Malik, Sapkota, Nayak and Craufurd2025; Mupangwa et al., Reference Mupangwa, Thierfelder and Ngwira2017). Yet their performance at scale has been mixed, particularly in regions characterized by smallholder farming. Adoption remains uneven, not because farmers are unaware of climate risks, but because these strategies often require reliable infrastructure, acceptance of yield uncertainty, or precise water control. These limitations are rarely technical alone. Rather, they reflect systemic mismatches between the requirements of mitigation practices and the socio-ecological realities of smallholder rice systems.
In such settings, even mitigation practices with modest probabilities of yield loss or management failure are unlikely to be adopted, despite their potential climate benefits (Hegwood et al., Reference Hegwood, Langendorf and Burgess2022). As a result, farmers often perceive methane mitigation as competing with productivity and risk-management objectives, thereby reinforcing a persistent trade-off between climate action and food security. This pattern points to a deeper limitation in how sustainability transitions in rice systems are commonly conceptualized. Much of the existing literature frames methane mitigation as a problem of optimizing management within fundamentally unchanged production systems (Vermont and De Cara, Reference Vermont and De Cara2010). Flooding regimes, soil biogeochemistry, and crop–microbe interactions are treated as fixed constraints, and emissions are reduced by adjusting water timing or input use. Such approaches implicitly accept the methane–yield trade-off as given, seeking to minimize emissions without crossing thresholds that threaten productivity. While this logic has produced important gains, it offers limited scope for transformation when managerial flexibility is constrained.
Against this backdrop, we show that microbial regulation can shift the joint relationship between methane mitigation and productivity in smallholder rice systems. Using a large, randomized field experiment embedded in farmer-managed plots, we find that a methanotroph-based microbial intervention substantially reduced methane emissions while maintaining rice yields comparable to those under conventional fertilizer management. Rather than reinforcing the familiar trade-off between climate mitigation and food production (Kreft et al., Reference Kreft, Huber, Wuepper and Finger2021), the intervention shifted outcomes toward a low-emissions, high-yield regime under real management conditions. This finding challenges the prevailing assumption that methane mitigation in rice must rely primarily on changes in water, labour, or input intensity. Most existing approaches focus on modifying farmer behaviour or field infrastructure, often with limited feasibility in smallholder contexts. By contrast, the results presented here point to biological regulation as an underexplored lever in sustainability transitions, one that operates within existing agronomic practices and targets the biophysical processes governing methane production and oxidation (Evans et al., Reference Evans, Boyd, Leu, Woodcroft, Parks, Hugenholtz and Tyson2019). By oxidizing methane in situ, methanotrophs offer a pathway to reduce net emissions without fundamentally altering flooding regimes or imposing additional management burdens on farmers (Micheni et al., Reference Micheni, Kanampiu, Kitonyo, Mburu, Mugai, Makumbi and Kassie2016). In principle, enhancing methanotrophic activity could enable methane mitigation within existing production practices rather than in opposition to them. This opens up the potential for mitigation strategies that don’t necessitate farmers adopting new water practices or facing increased yield risks, but instead work through internal biological regulation.
Recent advances in microbial ecology and soil science suggest that this possibility is plausible (Han et al., Reference Han, Kröger, Buchholz, Dewan, Quaas, Schulenburg and Reusch2023; Ume et al., Reference Ume, Kalu, Ezeibe, Ume, Ugwuoke, Onah and Joseph2025). Interventions that enhance methanotrophic populations or activity have the potential to suppress methane emissions while maintaining the anaerobic conditions necessary for rice growth. Moreover, microbial interventions may interact with plant physiology, nutrient cycling, and soil structure in ways that influence yields and system stability. Assessing these interactions requires moving beyond single-outcome metrics to examine integrated system performance, including emissions, productivity, and feasibility under real management constraints. Field-based evidence from smallholder contexts is essential. Evaluating mitigation strategies under farmer-managed conditions is essential because interventions that perform well under controlled settings may not remain effective or feasible within smallholder production systems.
This study addresses this knowledge gap by examining whether methanotrophic microbes can reduce methane emissions while maintaining rice productivity under real-world smallholder farming conditions. Using on-farm trials embedded within farmer-managed rice systems, we jointly evaluate methane emissions, rice yield, and methane intensity as integrated indicators of system performance. Rather than treating microbial interventions as standalone technologies, the study assesses their potential to improve joint climate–productivity outcomes within prevailing agronomic practices and management constraints. The objective of this study is to evaluate whether methanotroph-based microbial intervention can substantially reduce methane emissions and methane intensity without compromising rice yields under farmer-managed smallholder conditions. Specifically, the study examines whether microbial treatment shifts joint methane–yield outcomes toward lower emissions, yield-maintaining conditions relative to conventional fertilizer and no-input management systems.
Methodology
Study design and experimental setup
We used a randomized controlled field trial to evaluate the effects of a methanotroph-based microbial intervention on methane emissions and rice productivity, compared with conventional chemical fertilizer and a no-input control. Following Swinkels et al. (Reference Swinkels, Leach, Breen, Payne, White, Green and Bradley2021). We adopted a randomized controlled field trial design to enable rigorous causal inference into the effects of the intervention under real-world farming conditions. By randomly assigning plots to the treatment and control groups, this approach minimizes selection bias and confounding arising from heterogeneity in soil properties, management practices, and environmental conditions, thereby allowing observed differences in methane emissions and rice productivity to be credibly attributed to the intervention. While randomized field experiments are well established in agronomic research, their use in evaluating on-farm climate mitigation interventions remains comparatively limited, particularly in smallholder production systems.
We conducted the trial during the 2025 wet season in rainfed lowland rice systems managed by smallholder farmers in southeast Nigeria. We embedded 378 plots, each approximately 25 m2, within farmer-managed fields and cultivated them under standard agronomic practices for one complete rice growing cycle. We randomly assigned plots to one of three treatment arms, each comprising 126 plots: (1) Methanotrophs, receiving a bio-inoculant of methane-oxidizing bacteria; (2) Chemical fertilizer, receiving urea (46% N) at 90 kg N ha−1, split between early tillering and panicle initiation; and (3) Control, receiving no nutrient input and following prevailing farmer practice. We conducted randomization at the plot level within farmer fields and applied all treatments contemporaneously. Randomization was conducted using simple random assignment at the individual plot level without formal blocking or stratification. Each experimental plot corresponded to a unique farmer-managed unit, such that each participating farmer contributed only one plot to the study. Treatment allocation was therefore independent across plots, and no farmer-managed plots belonged to multiple treatment arms. We held crop variety, planting dates, and routine field management constant across treatment arms, while farmers retained control over day-to-day practices. We determined the sample size using a power analysis for one-way analysis of variance to detect a moderate effect size (Cohen’s f = 0.25) at a significance level of 0.05 and power of 0.80. Although the minimum required sample size was 28 plots per group, we expanded the trial to 126 plots per arm to improve statistical precision and assess heterogeneity under field conditions.
Methanotrophic bacteria were isolated from rice rhizosphere soil and floodwater samples collected in Ebonyi and Anambra States (Southeast Nigeria) using sterile techniques (Svenning et al., Reference Svenning, Wartiainen, Hestnes and Binnerup2003). Samples were stored at 4°C before processing. Isolation was carried out using Nitrate Mineral Salts (NMS) medium, with methane supplied as the sole carbon and energy source (Lewis et al., Reference Lewis, Tahon, Geesink, Sousa and Ettema2021). A 20% (v/v) methane–air mixture was used for enrichment. Serial dilutions (101–105) of homogenized soil samples were prepared, and dilutions 102 and 104 were plated on NMS agar. Plates were incubated in sealed jars under methane–oxygen atmosphere for 14–20 days. Emerging colonies were subcultured for purity and transferred to NMS broth sealed with butyl-rubber stoppers, into which methane was injected. Isolate purity was confirmed microscopically and through the absence of growth on complex media (Dedysh, Reference Dedysh2023). Morphological, biochemical (catalase, oxidase, nitrate reduction), and molecular analyses were conducted. DNA sequencing confirmed the presence of Type I (Methylococcus) and Type II (Methylocystis) methanotrophs, indicating functional diversity and adaptability to fluctuating redox conditions typical of paddy soils (Dedysh, Reference Dedysh2023). The methanotroph inoculum was applied in treated plots during transplanting and early tillering. Application did not require changes to flooding regimes, irrigation schedules, or routine farmer management.
Spillover and contamination effects
The study design incorporated several measures to reduce the likelihood of biophysical and behavioural spillovers across treatment arms. Randomization was conducted at the individual plot level, with each farmer contributing only one experimental plot to the study. This design reduced the possibility that a single farmer simultaneously managed plots belonging to different treatment arms. Experimental plots were spatially distributed across farmer-managed rice fields rather than concentrated within a single contiguous field, thereby reducing the likelihood of microbial transfer through water movement, soil disturbance, or shared field operations.
To further reduce behavioural spillovers, treatment hypotheses were not disclosed to participating farmers during the cropping cycle. This approach reduces the chance that management changes, rather than microbial activity, cause differences in methane emissions or yields. These measures help reduce the likelihood that observed treatment differences were driven by spillover effects rather than microbial intervention. The design also minimized farmer burden by integrating treatments into routine management and avoiding additional labour-intensive monitoring. Treatment protocols were implemented and monitored by the research team during transplanting and early tillering to ensure consistency in application procedures across plots. Although these measures substantially reduce the likelihood of spillover effects, some residual spatial or environmental correlation across nearby plots cannot be completely excluded under real-world farming conditions. However, because treatment allocation was randomized across dispersed farmer-managed plots, any remaining spillover effects are unlikely to have systematically biased treatment comparisons.
Experimental plots assigned to different treatment arms were spatially separated within farmer-managed rice landscapes rather than positioned as adjacent subplots within a single continuous field. Plots were typically separated by bunds and natural field boundaries commonly used in lowland rice systems, which limited direct surface water exchange between treatment units. Although exact inter-plot distances were not systematically standardized or recorded because of the heterogeneous structure of farmer-managed fields, the spatial dispersion of plots across different farmer-managed locations reduced the likelihood of direct microbial transfer through routine water movement or soil disturbance. In addition, drainage and water flow largely followed existing field-level bund and channel structures, further limiting uncontrolled exchange across treatment units.
Methane emission and yield measurement
Methane fluxes were measured repeatedly throughout the cropping cycle using standardized field protocols, capturing temporal variability while balancing methodological rigour with field feasibility. Methane emissions were measured using the closed static chamber method coupled with a portable non-dispersive infrared (NDIR) methane sensor (Dankwa et al., Reference Dankwa, Boh and Clark2026). Chambers were deployed on each plot during eight measurement rounds corresponding to key crop growth stages: transplanting, early vegetative, mid-vegetative (tillering), panicle initiation, flowering, grain filling, maturity, and post-harvest. Measurement dates were fixed across plots between 22 April and 22 July 2025 (six months of rain-fed season).
During each sampling event, methane concentration in the chamber headspace was recorded at 0, 15, 30, and 60 minutes after closure. Methane flux (F, mg CH4 m−2 h−1) was calculated as:
 $F={\Delta C \over \Delta t}\times {V \over A}\times {273 \over 273+T}$
where
 ${\Delta C \over \Delta t}$
is the rate of change in methane concentration (ppm h−1), V is chamber volume (m3), A is chamber surface area (m2), and T is mean chamber air temperature (°C). C denotes the methane concentration within the chamber headspace, measured in parts per million (ppm), while t represents time, expressed in hours. The term ΔC therefore captures the rate of change in methane concentration over the chamber deployment period, reflecting net methane flux from the soil–plant system into the chamber headspace.
Sensor readings were periodically validated against gas chromatography with flame ionization detection, yielding a correlation coefficient R2 > 0.90, confirming measurement reliability. Seasonal methane emissions were aggregated at the plot level and expressed in kg CH4 ha−1. For statistical analysis, instantaneous chamber-based methane flux measurements were converted into per-round methane emission estimates expressed as kg CH4 ha−1 prior to aggregation across the full cropping season. Instantaneous methane fluxes were first calculated in mg CH4 m−2 h−1 and then converted to per-round methane emission estimates expressed in kg CH4 ha−1 before seasonal aggregation and statistical analysis.
Methane emissions were converted to carbon dioxide equivalents (expressed as kg CO2-eq ha−1) using the IPCC AR6 100-year Global Warming Potential for methane (Legg, Reference Legg2021):
 ${\rm CH}_{4_{{\rm CO}_{2}} \hbox{-}{\rm eq}}={\rm CH}_{4} \times 27.2$
This enabled comparison of mitigation outcomes across treatments using a common climate metric.
Rice yield was measured once per plot at harvest and expressed as kg ha−1, following local harvest practice. Yield was treated as a plot-level outcome and replicated across methane measurement rounds for analysis.
Methane intensity (MI) was calculated consistently across all treatment arms as cumulative seasonal methane emissions divided by rice yield at the plot level:
 $MI={E_{{\rm CH}_{4} } \over Y}$
where E CH4 is cumulative seasonal methane emissions (kg CH4 ha−1) and Y is rice yield (kg ha−1). Methane intensity was therefore expressed as kg CH4 kg−1 rice and used as an integrated indicator of climate–productivity performance.
Equations (1)–(3) define the construction of methane flux, seasonal emissions, and methane intensity used in the Results and Tables 2 and 3.
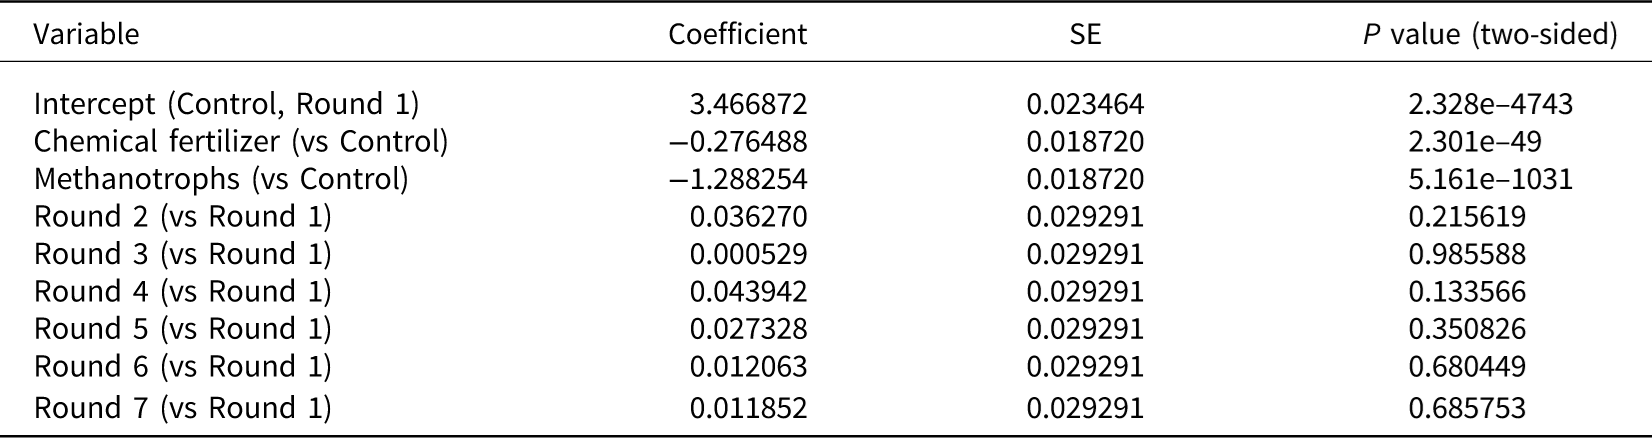
Mixed-effects model estimates for per-round methane emissions (kg CH4 ha−1)

Table 1. Long description
A table with 11 rows and 4 columns. The columns are labeled Variable, Coefficient, SE, and P value (two-sided). The rows list different variables and their corresponding coefficients, standard errors, and P values. The variables include Intercept (Control, Round 1), Chemical fertilizer (vs Control), Methanotrophs (vs Control), and Rounds 2 to 7 (vs Round 1). The table provides specific numerical values for each variable under the columns Coefficient, SE, and P value (two-sided). Notable trends include the significant reduction in methane emissions for Methanotrophs (vs Control) with a coefficient of -1.288254 and a very low P value, indicating high statistical significance. The Chemical fertilizer (vs Control) also shows a reduction in methane emissions but to a lesser extent compared to Methanotrophs.
Note: Two-sided tests were used. The analysis includes 3,024 observations from 378 plots measured over eight rounds.
Joint test (Round fixed effects): χ 2(7) = 4.7565, P = 0.6897. Plot-level random intercept = 0.001809; Residual = 0.162154.
Treatment means and 95% confidence intervals for cumulative methane emissions, rice yield, and methane intensity across management regimes

Table 2. Long description
The table presents data on cumulative methane emissions, rice yield, and methane intensity across three management regimes: Control, Chemical fertilizer, and Methanotrophs. It has three columns labeled Outcome, Control, Chemical fertilizer, and Methanotrophs, and four rows including the header. Row 1: Outcome, Control, Chemical fertilizer, Methanotrophs. Row 2: Cumulative methane emissions (kg CH4 ha^-1), 27.8 [26.9, 28.7], 25.6 [24.8, 26.4], 17.5 [16.8, 18.2]. Row 3: Rice yield (kg ha^-1), 3,210 [3,"080","3",340], 4,520 [4,"390","4",650], 4,430 [4,"300","4",560]. Row 4: Methane intensity (kg CH4 kg^-1 rice), 0.0089 [0.0085, 0.0093], 0.0117 [0.0113, 0.0121], 0.0069 [0.0066, 0.0072]. The table shows that the Methanotrophs regime has the lowest cumulative methane emissions and methane intensity but a rice yield comparable to the Chemical fertilizer regime.", "EDH": "
Notes: Values represent plot-level treatment means with 95% confidence intervals across 126 plots per treatment arm.
Methane intensity was calculated as cumulative seasonal methane emissions per unit of rice yield. Confidence intervals are shown for descriptive comparison across treatment regimes.
Pairwise comparisons of methane intensity with Tukey-adjusted P values and 95% CIs

Table 3. Long description
A table comparing methane intensity across different groups with three rows and six columns. The columns are labeled Group 1, Group 2, Mean diff (G1-G2), 95% CI lower, 95% CI upper, and P (Tukey adj). The rows are labeled with different group comparisons: Chemical fertilizer vs Control, Chemical fertilizer vs Methanotrophs, and Control vs Methanotrophs. The values in the table include mean differences, confidence intervals, and P values for each comparison. Notable trends include the negative mean difference and P values less than 0.001 for the comparisons involving Methanotrophs, indicating significant differences in methane intensity.
Note: Pairwise comparisons are based on plot-level methane intensity using Tukey-adjusted post hoc contrasts. Percentage changes are relative to the mean methane intensity of Group 2.
Two-sided tests were used.
n = 126 plots per treatment.
Statistical analysis
The unit of observation differed across outcomes. For methane emissions, the primary observational unit was the plot-round because methane fluxes were measured repeatedly across eight sampling rounds within the same plot over the cropping cycle. For rice yield and methane intensity, the plot served as the unit of analysis because these outcomes were aggregated at the plot level. The repeated-measures structure of the methane data implies that observations within plots are not independent over time. To account for this dependence, methane emission models included plot-level random intercepts, which capture within-plot correlation arising from repeated measurements and persistent farmer-level heterogeneity, as each plot corresponded to a unique farmer-managed unit.
Plot-round observations served as the primary unit for methane emission analysis, while plot-level observations were used for yield and methane intensity analyses. Methane emissions were measured repeatedly from the same plots over eight rounds throughout the rice crop cycle, while rice yield was measured once per plot at harvest. All statistical tests were two-sided, with a significance level of α = 0.05.
To estimate treatment effects on methane emissions, we fitted linear mixed-effects models that account for repeated measurements within plots. The primary specification was:
 ${{Y_{pt}} = {\beta _0} + {\beta _1}{\rm{Methanotrop}}{{\rm{h}}_p} + {\beta _2}{\rm{Fertilize}}{{\rm{r}}_p} + {\gamma _t} + {u_p} + {\varepsilon _{pt}}}$
where Ypt denotes methane flux (mg CH4 m−2 h−1) measured in plot p at measurement round t; Methanotrophpand Fertilizerpare indicator variables for treatment assignment (with the no-input control as the reference category); γ t captures measurement-round fixed effects; up is a plot-level random intercept accounting for repeated observations within plots; and ϵptis the idiosyncratic error term. Because each plot corresponded to a unique farmer-managed unit, plot-level random intercepts capture both repeated observations within plots and persistent farmer-level heterogeneity in management and environmental conditions. We did not include additional higher-level random effects for fields or communities because treatment assignment occurred independently at the plot level and each farmer contributed only one plot to the study. Experimental plots were distributed across heterogeneous farmer-managed environments rather than nested within a small number of common fields. While some spatial or community-level correlation may remain possible, the randomized allocation of treatments across dispersed plots reduces the likelihood that unobserved higher-level clustering systematically biased treatment estimates. Moreover, the primary inference focuses on treatment contrasts rather than community-level effects, and estimated treatment differences remained large relative to residual variation.
To evaluate treatment effects on rice productivity, we estimated a plot-level linear model for yield:
 ${Y_p^{{\rm{yield}}} = {\alpha _0} + {\alpha _1}{\rm{Methanotrop}}{{\rm{h}}_p} + {\alpha _2}{\rm{Fertilize}}{{\rm{r}}_p} + {\eta _p}}$
where Yp yield denotes rice yield (kg ha−1) for plot p, and ηpis the error term.
To assess whether microbial intervention altered the methane–yield trade-off, we computed methane intensity as cumulative seasonal methane emissions per unit yield:
 ${M{I_p} = {{\sum _{t = 1}^T{E_{pt}}} \over {Y_p^{{\rm{yield}}}}}}$
where Ept denotes methane emissions from plot p at measurement round t, and T = 8 measurement rounds. We compared methane intensity across treatment arms using linear models at the plot level. For plot-level methane intensity models, Huber–White heteroscedasticity-robust standard errors were used to reduce sensitivity to potential heteroscedasticity under heterogeneous farmer-managed field conditions. Because methane intensity was analysed at the plot level and each farmer contributed only one plot, additional clustering adjustments were not required. Treatment effects were reported as mean differences relative to the control group, along with 95% confidence intervals, exact P values, and effect sizes expressed both in absolute terms and as percentage changes relative to the control mean. We examined residual diagnostics for normality and heteroscedasticity and used model-based robust standard errors where appropriate. For comparisons involving multiple treatment arms, we controlled the family-wise error rate using Tukey-adjusted post hoc contrasts. All analyses were conducted using Stata (StataNow 19 BE). Analysis code and de-identified data will be made publicly available upon publication. Methane emissions and methane intensity were analysed on their original scales because residual diagnostics indicated no severe deviations from model assumptions after accounting for treatment effects and repeated measurements. Residual normality was assessed using quantile–quantile plots and visual inspection of residual distributions, while homoscedasticity was evaluated through residual-versus-fitted-value plots. Although some moderate heterogeneity in variance is expected under farmer-managed field conditions, diagnostic assessment indicated that model assumptions were sufficiently satisfied for linear mixed-effects and linear model estimation. Robust standard errors were additionally examined as a sensitivity check.
Additional environmental and management covariates, including soil texture, flooding conditions, transplanting timing, and baseline management characteristics, were examined descriptively during balance assessment across treatment arms. Because randomization produced broadly comparable treatment groups across observed baseline characteristics, the primary specifications focused on treatment assignment effects rather than covariate-adjusted estimation. This approach preserves the experimental interpretation of treatment contrasts while avoiding overfitting with post-randomization controls (Pocock, Reference Pocock2026; Roumelioti et al., Reference Roumelioti, Steel, Yabes, Vowles, Vodovotz, Beach, Rollman, Weisbord, Unruh and Jhamb2018). Nevertheless, plot-level random effects account for persistent unobserved heterogeneity across farmer-managed environments. For the yield outcome, we used a plot-level linear model because rice yield was measured once per plot at harvest. Since each plot corresponded to a unique farmer-managed unit and treatment assignment was randomized, the primary yield model estimated treatment-group differences without additional covariate adjustment. Observed sources of heterogeneity, including plot size, soil texture classification, flooding conditions, transplanting timing, farmer characteristics, and prior management practices, were assessed through baseline balance checks rather than included as post-randomization controls in the main specification. Because the trial covered only one cropping season, the observed methane reductions should be interpreted as short-run treatment effects rather than evidence of persistent multi-season performance. The study does not assess whether introduced methanotroph populations persist across seasons, whether repeated inoculation would be required, or whether soil ecological feedbacks could amplify or weaken treatment effects over time.
Results
We conducted a randomized field trial across 378 farmer-managed rice plots during the 2025 wet season, with 126 plots allocated to each of three management regimes: methanotroph inoculation, chemical fertilizer, and a no-input control. All plots were observed over a complete cropping cycle, with methane emissions measured multiple times across eight sampling rounds, and yield assessed once at the conclusion of the cycle harvest.
Participating farmers cultivated smallholder plots typical of rainfed lowland rice systems, with an average plot size of approximately 0.45 ha (range <1 ha). Farmers were predominantly small-scale producers, with a mean age of about 42 years, an average household size of six members, and approximately 15 years of rice-farming experience. Most households relied primarily on family labour, and fewer than 20% reported access to any form of controlled irrigation, reflecting the system’s rainfed nature. Baseline biophysical conditions were broadly similar across plots, including soil texture, flooding depth, and transplanting dates, with limited variation across treatment arms. Key management characteristics – such as rice variety choice, transplanting density, and prior fertilizer use – were also comparable across groups. Balance checks indicated no systematic differences across treatment arms in observed baseline biophysical or management characteristics, including plot size, flooding conditions, transplanting timing, soil texture classifications, farmer demographics, and prior management practices. This balance supports the interpretation of yield differences as treatment-associated differences rather than systematic differences in baseline soil, plot, or farmer-management conditions.
Methane emissions across the cropping season
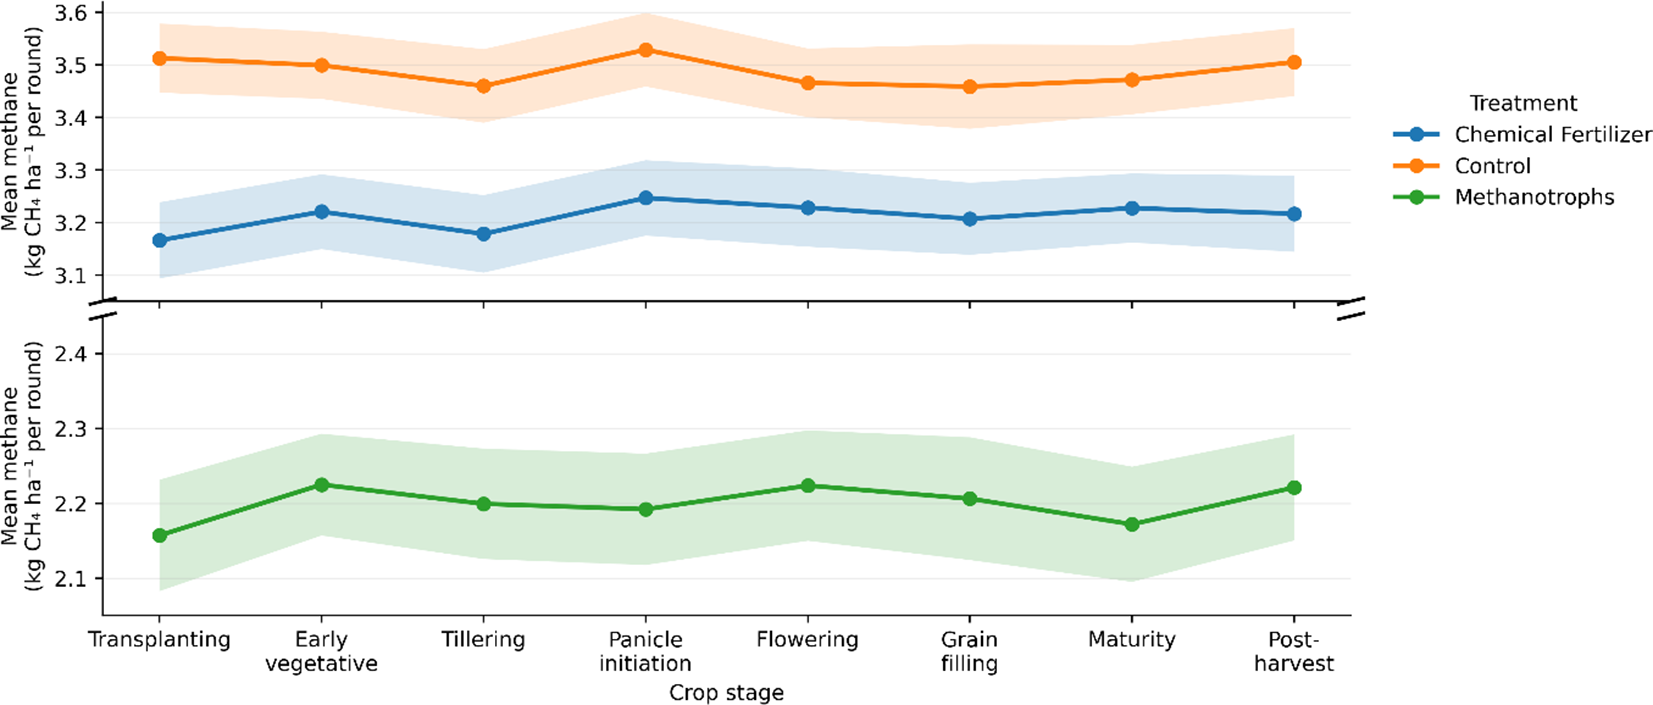
Methane emissions followed consistent patterns across crop stages, starting with low fluxes immediately after transplanting, then gradually increasing during early vegetative growth and tillering, with notable mid-season peaks under conventional management (Figure 1). This result contrasts with previous studies (Keatinge et al., Reference Keatinge, Materon, Beck, Yurtsever, Karuc and Altuntas1995b; Oda and Nguyen, Reference Oda and Nguyen2019), which reported that methane emissions in rice paddies generally do not show consistent patterns across all crop stages. Control and fertilizer-treated plots showed similar emission patterns over time, with methane levels rising sharply from the second to the fourth measurement rounds and remaining high through panicle initiation and flowering. Emissions decreased during grain filling, approaching baseline levels as the crop matured and after harvest, due to reduced substrate availability and partial soil re-aeration. In contrast, methanotroph-inoculated plots consistently exhibited lower methane emissions across all sampling rounds. Differences relative to the control and fertilizer treatments were detectable from the first measurement after transplanting and widened progressively through the vegetative and reproductive stages, when methane production was highest in conventionally managed plots. Notably, methane emissions in methanotroph-treated plots increased only modestly during the mid-season peak, producing a flatter seasonal emission profile compared with the pronounced peaks observed under fertilizer and no-input management. This divergence persisted across all eight measurement rounds.
Stage-specific methane emissions under alternative management regimes. Points represent treatment-specific mean methane emissions per measurement round estimated across plots, and error bars indicate 95% confidence intervals from the repeated-measures mixed-effects model. Methane emissions are expressed as per-round methane emissions (kg CH4 ha−1). Measurements were collected across eight sampling rounds corresponding to key crop stages: transplanting, early vegetative growth, tillering, panicle initiation, flowering, grain filling, maturity, and post-harvest. Each treatment arm included 126 plots (n = 378 total plots).

Mixed-effects analysis accounting for repeated measurements within plots indicated that per-round methane emissions differed significantly across treatment arms (Table 1). In this specification, treatment coefficients represent average differences in methane emissions per measurement round relative to the no-input control, while plot-level random intercepts account for within-plot correlation arising from repeated measurements over the crop cycle. Methanotroph-treated plots exhibited substantially lower methane emissions than the control, with an estimated mean reduction of 1.29 kg CH4 ha−1 per measurement round (95% CI [−1.32, −1.25]; P < 1 × 10⁻¹⁶). Fertilizer-treated plots also exhibited lower methane emissions relative to the control, but the magnitude of this difference was markedly smaller, at 0.28 kg CH4 ha−1 per round (95% CI [−0.31, −0.24]; P < 1 × 10⁻¹⁶). The relative magnitudes of the treatment coefficients indicate that the reduction associated with methanotroph inoculation was more than four times larger than that associated with chemical fertilizer application (Table 1). Confidence intervals around both treatment estimates were narrow, reflecting high precision arising from the large number of plot–round observations. Variance components further indicate that a non-trivial share of unexplained variation in methane emissions occurred at the plot level, justifying the inclusion of random intercepts to account for persistent plot-specific differences in emission levels across rounds.
The variance components from the mixed-effects model indicated that 38% of unexplained variation in methane emissions occurred between plots, while the remaining variation occurred within plots across measurement rounds (ICC = 0.35). This supports the inclusion of plot-level random intercepts to account for repeated observations within plots over time.
Measurement-round fixed effects were included to capture seasonal dynamics in methane emissions over the rice crop cycle. Although mean emissions varied across transplanting, vegetative, reproductive, and post-harvest stages (Figure 1), joint tests of the round fixed effects were not statistically significant after accounting for treatment assignment (Table 1). This indicates that the estimated treatment differences represent consistent average shifts in per-round methane emissions rather than being driven by a small subset of crop stages. The magnitude of the methanotroph-associated reduction is comparable to, or larger than, per-round reductions reported for fertilizer- and water-management interventions in recent field studies of rice methane emissions (Choi et al., Reference Choi, Uphoff, Kim and Lee2019; Waghmaref and Singh, Reference Waghmaref and Singh1984; Xu et al., Reference Xu, Jaffé and Mauzerall2007), reinforcing the robustness of the observed treatment effects under farmer-managed conditions.
Comparison of emission and yield by treatment
Across the full cropping season, methanotroph inoculation substantially reduced cumulative methane emissions relative to both chemical fertilizer and no-input control treatments (Figure 1). This reduction remained pronounced when emissions were expressed in CO2 equivalents using the IPCC AR6 100-year global warming potential, underscoring the climate relevance of the observed mitigation effect. By contrast, chemical fertilizer application did not reduce seasonal methane emissions relative to the control, consistent with evidence that nitrogen inputs alone do not systematically suppress methane production in flooded rice systems under farmer-managed water regimes (Liu et al., Reference Liu, Lu, Yang and Wang2016; Qi et al.,, Reference Qi, Wheeler, Keatinge, Ellis, Summerfield and Craufurd1999). The distributional separation across treatments indicates that methane mitigation under methanotroph inoculation was not driven by a small number of extreme observations but reflected a robust shift in emissions across the population of plots. Crucially, methane mitigation under methanotroph inoculation did not come at the expense of productivity. Rice yields in methanotroph-treated plots were statistically indistinguishable from those obtained under chemical fertilizer management and substantially higher than yields in the no-input control (Figure 2).
Cumulative methane emissions, rice yield, and methane intensity across management regimes. Panels compare plot-level cumulative seasonal methane emissions (kg CH4 ha−1), rice yield (kg ha−1), and methane intensity (kg CH4 kg−1 rice) across methanotroph, chemical fertilizer, and no-input control treatments. Points and distributions represent plot-level observations across 126 plots per treatment arm.

Table 2 summarizes the primary treatment outcomes across the three management regimes, reporting cumulative seasonal methane emissions, rice yield, and methane intensity together with their corresponding 95% confidence intervals. Methanotroph-treated plots exhibited the lowest cumulative methane emissions, averaging approximately 17.5 kg CH4 ha−1 (95% CI: 16.8–18.2), compared with 25.6 kg CH4 ha−1 (95% CI: 24.8–26.4) under chemical fertilizer management and 27.8 kg CH4 ha−1 (95% CI: 26.9–28.7) in the no-input control. Despite these lower emissions, rice yields in methanotroph-treated plots remained comparable to those obtained under conventional fertilizer management, averaging approximately 4,430 kg ha−1 (95% CI: 4,300–4,560) relative to 4,520 kg ha−1 (95% CI: 4,390–4,650) in fertilizer-treated plots, while both exceeded yields in the control group. Methane intensity was also lowest under methanotroph treatment, averaging approximately 0.0069 kg CH4 kg−1 rice (95% CI: 0.0066–0.0072), compared with 0.0117 kg CH4 kg−1 rice (95% CI: 0.0113–0.0121) under fertilizer management and 0.0089 kg CH4 kg−1 rice (95% CI: 0.0085–0.0093) in the control. The confidence intervals indicate clear separation in methane-related outcomes across treatment arms, whereas yield differences between methanotroph and fertilizer treatments remained comparatively small.
Methane–yield trade-offs
Firstly, the distribution of methane intensity across methanotroph, chemical fertilizer, and no-input control treatments showed that Methanotroph-treated plots consistently exhibited the lowest methane intensity (seasonal methane emissions per unit of rice yield) (Figure 3a). Each point represents one plot (n = 126 per treatment). Boxplots indicate the median, interquartile range, and 1.5 × interquartile range.
Methane intensity (a) and methane–yield outcomes (b) under alternative management regimes.

Figure 3. Long description
Panel A: A box plot shows methane intensity (kg CH4 per kg rice) under three different treatments: Methanotrophs, Chemical Fertilizer, and Control. The y-axis represents methane intensity, and the x-axis lists the treatment types. The box plot displays the distribution of methane intensity values for each treatment, with Methanotrophs showing the lowest intensity, followed by Chemical Fertilizer, and Control having the highest intensity. Panel B: A scatter plot illustrates seasonal methane emissions (kg CH4 ha^-1) against rice yield (kg ha^-1) for the same three treatments. The y-axis represents seasonal methane emissions, and the x-axis represents rice yield. Each treatment is represented by different colored dots: blue for Methanotrophs, orange for Chemical Fertilizer, and green for Control. The scatter plot shows that Methanotrophs generally have lower methane emissions and moderate rice yields, Chemical Fertilizer has moderate methane emissions and higher rice yields, and Control has the highest methane emissions with varying rice yields. Each treatment is enclosed in an ellipse to highlight the distribution of data points.
In terms of methane–yield space under alternative management regimes (Figure 3b), defined as the joint distribution of methane emissions and yield at the plot level (Chen et al., Reference Chen, Lin, Balasus, Hardy, East, Zhang, Runkle, Hancock, Taylor, Du, Sander and Jacob2025; Keatinge et al., Reference Keatinge, Beck, Materon, Yurtsever, Karuc and Altuntas1995a), the pattern shows that control plots clustered in a high-emission, low-yield region of the methane–yield space. In contrast, fertilizer-treated plots shifted toward higher yields but largely remained within a methane-intensive region. In comparison, methanotroph-treated plots occupied a distinct low-methane-emissions, high-yield region, indicating a shift toward lower emissions, high-yield outcomes rather than the conventional emissions–productivity pattern – between methane mitigation and productivity under real smallholder management conditions. This separation in methane–yield space was evident across the full distribution of plots and was not driven by a small number of outliers.
Formal statistical comparisons confirmed these visual patterns (Table 3). Table 3 reports Tukey-adjusted pairwise comparisons of treatment means, corresponding to average plot-level treatment effects. Pairwise comparisons of plot-level methane intensity revealed statistically significant differences across all treatment combinations (Table 3). Methane intensity differed between chemical fertilizer and control plots, with fertilizer-treated plots exhibiting a higher mean methane intensity than control plots. The estimated mean difference between fertilizer and control plots was 0.0028 kg CH4 kg−1 rice, with a 95% confidence interval of [0.0026, 0.0030], corresponding to a 30.2% increase relative to the control mean. This difference was statistically significant (P < 0.001). Comparisons between chemical fertilizer and methanotroph-treated plots also indicated a statistically significant difference in methane intensity (Table 3). Methane intensity in fertilizer-treated plots exceeded that in methanotroph-treated plots by a mean difference of 0.0020 kg CH4 kg−1 rice, with a 95% confidence interval of [−0.0022, −0.0018] when expressed as methanotrophs relative to fertilizer. This corresponds to a 45.1% lower methane intensity in methanotroph-treated plots relative to fertilizer-treated plots, and the difference was statistically significant based on Tukey-adjusted comparisons (P < 0.001).
The largest pairwise difference in methane intensity was observed between control and methanotroph-treated plots (Table 3). Control plots exhibited a higher methane intensity than methanotroph-treated plots by 0.0048 kg CH4 kg−1 rice, with a 95% confidence interval of [−0.0050, −0.0046] when expressed as methanotrophs relative to control. This difference corresponds to a 108.2% reduction in methane intensity in methanotroph-treated plots relative to controls and was statistically significant (P < 0.001). All reported comparisons are based on Tukey-adjusted post hoc tests using plot-level methane intensity estimates.
Interestingly, methane intensity remained higher in fertilizer-treated plots than in the no-input control despite the substantial yield gains associated with fertilizer application. This pattern suggests that the increase in methane emissions under fertilizer management exceeded the proportional increase in rice yield, resulting in comparatively methane-intensive production. One possible explanation is that nitrogen fertilization may stimulate plant biomass production and root exudation, thereby increasing the availability of carbon substrates for methanogenesis under flooded conditions. Consequently, although fertilizer application improved productivity, these gains were insufficient to offset the associated increase in methane emissions on a per-unit yield basis under farmer-managed conditions.
Consistent with the mixed-effects specification in Eq. (4), methanotroph inoculation significantly reduced methane emissions relative to both chemical fertilizer and the no-input control across all eight measurement rounds. In this specification, treatment coefficients capture average differences in methane emissions between treatment arms. At the same time, measurement-round fixed effects account for systematic variation over the rice crop cycle, and plot-level random intercepts control for repeated observations within the same plot. The estimated treatment effect remained robust after accounting for these temporal dynamics and within-plot correlation. Chemical fertilizer application did not reduce methane emissions relative to the control, and in several measurement rounds, emissions were comparable to or higher than under the control. Measurement-round fixed effects were included to account for seasonal variation in methane emissions; however, joint tests indicated that differences across rounds were not statistically significant after accounting for treatment effects.
Linear models comparing treatment means at the plot level were then used to evaluate combined climate and productivity outcomes through methane intensity. These models estimate average differences in methane intensity between treatment arms, defined as cumulative seasonal methane emissions per unit of rice yield. Methanotroph-treated plots exhibited a 52% reduction in methane intensity relative to the control and a 31% reduction relative to chemical fertilizer management (Table 4). These differences reflect lower cumulative methane emissions in methanotroph-treated plots, alongside yields that were not statistically distinguishable from those obtained under fertilizer application. These results indicate that microbial methane mitigation did not impose a yield penalty relative to conventional nutrient management, even after accounting for persistent plot-level differences (which also capture farmer-level heterogeneity because each plot corresponds to a single farmer) in baseline productivity and management conditions.
Treatment effects on methane intensity

Table 4. Long description
A table with four rows and five columns comparing the effects of different treatments on methane intensity. The columns are labeled Comparison, Mean difference (kg CH4 kg^-1 rice), % change, 95% CI, and P value. The rows present data for Methanotroph vs. Control and Methanotroph vs. Fertilizer. For Methanotroph vs. Control, the mean difference is -0.00483 kg CH4 kg^-1 rice, with a 52.1% reduction, a 95% confidence interval of [-0.00503, -0.00463], and a P value of less than 0.001. For Methanotroph vs. Fertilizer, the mean difference is -0.00202 kg CH4 kg^-1 rice, with a 31.3% reduction, a 95% confidence interval of [-0.00221, -0.00183], and a P value of less than 0.001.
Note: Estimates represent average plot-level treatment effects derived from linear models comparing treatment means. Percentage reductions are relative to the comparison group mean.
Two-sided tests were used.
n = 126 plots per treatment.
Discussion
This study demonstrates that methane mitigation in flooded rice systems can be achieved by improving joint methane–yield outcomes under real-world smallholder management conditions. By jointly evaluating methane emissions and rice yield, we show that biological regulation can shift system outcomes away from the conventional framing that treats climate mitigation and food production as competing objectives. Rather than optimizing emissions or yield in isolation, the findings demonstrate that methane and productivity outcomes can shift jointly toward lower methane-emissions and yield-maintaining conditions within prevailing agronomic practices. This distinction is particularly relevant for smallholder rice systems, where the feasibility of mitigation strategies depends not only on technical effectiveness but also on compatibility with existing constraints, risks, and management routines. In the sections that follow, we situate these findings within the broader literature on rice methane mitigation, examine why dominant management-based approaches have struggled to achieve durable adoption at scale, and discuss how biological regulation represents a complementary pathway for advancing sustainability transitions in rice-based food systems, while also outlining the scope and limits of inference from the present study.
Shifting methane–yield outcomes in smallholder rice systems6in smallholder rice systems
This study shows that methane mitigation in flooded rice systems can be achieved alongside maintained rice productivity under real-world smallholder conditions. Instead, the results show that biological regulation can reconfigure the joint relationship between methane emissions and rice yield under real-world smallholder management conditions. Existing research has largely treated methane mitigation and productivity as competing objectives in flooded rice systems, often emphasizing trade-offs arising from water management, fertilizer regimes, or residue practices (Dequiedt and Moran, Reference Dequiedt and Moran2015; Materon et al., Reference Materon, Keatinge, Beck, Yurtsever, Karuc and Altuntas1995; Rajendran et al., Reference Rajendran, Park, Kim, Park, Shin, Lee, Song, Paek and Kim2024). By contrast, our findings show that methane emissions and yield can be jointly reshaped within prevailing agronomic practices, without altering irrigation control, labour intensity, or input timing. By jointly assessing emissions and yield at the plot level, we show that treatment outcomes clustered in a lower emissions, high-yield region relative to conventional management practices (Jwaideh and Dalin, Reference Jwaideh and Dalin2025). This contribution lies not only in demonstrating methane reductions, but also in showing that emissions can decline without corresponding yield penalties under farmer-managed conditions. Much of the rice methane mitigation literature implicitly assumes that emissions reductions must be achieved either at the expense of yield or through intensified management that increases labour, risk, or infrastructural demands. In contrast, the present findings indicate that it is possible to move to a different region of outcome space without changing irrigation regimes, altering fertilizer timing, or imposing new behavioural requirements on farmers. This distinction is central to sustainability transitions in smallholder systems, where adoption depends not only on technical effectiveness but also on compatibility with existing practices and constraints. By demonstrating simultaneous methane mitigation and yield maintenance, this study contributes a systems-level perspective (Abd El-Daim et al., Reference Abd El-Daim, Bejai and Meijer2014; Rasmussen et al., Reference Rasmussen, Coolsaet, Martin, Mertz, Pascual, Corbera, Dawson, Fisher, Franks and Ryan2018; Smartt, Reference Smartt1985). This aligns with broader calls to rethink how environmental and production goals are jointly evaluated in agriculture.
The results presented here highlight biological regulation as a distinct and underexplored pathway for mitigating methane emissions in rice systems. Methanotrophic bacteria are already present in flooded rice soils, but their abundance and activity are often insufficient to offset methane production under anaerobic conditions (Seo et al., Reference Seo, Jang, Gebauer and Kang2014). Rather than introducing an entirely new technology or management regime, microbial interventions modulate processes that are endogenous to the system (Wang et al., Reference Wang, Fu and Kuramae2024). This distinguishes biological regulation from approaches that rely on external inputs or behavioural change, positioning it as a complementary strategy within existing agronomic frameworks.
Importantly, biological regulation does not replace established mitigation practices such as water management or fertilizer optimization. Instead, it offers an additional lever that operates at the level of biophysical processes rather than management decisions. By targeting methane oxidation directly, microbial interventions may reduce emissions without requiring farmers to alter flooding schedules, input timing, or labour allocation. This compatibility with prevailing practices is particularly relevant in smallholder systems, where the feasibility of mitigation strategies often hinges on their ability to integrate seamlessly into everyday farming routines (Chao, Reference Chao2024). These findings demonstrate substantial improvements in joint climate–productivity outcomes, addressing a gap in the current mitigation literature.
The comparatively higher methane intensity observed under fertilizer management relative to the no-input control may reflect biophysical processes through which nitrogen fertilization indirectly stimulates methane production under flooded rice conditions. Increased nutrient availability can enhance rice biomass production, root growth, and rhizodeposition, thereby increasing the supply of labile carbon substrates available for methanogenic microbial activity in anaerobic soils. Fertilizer application may also influence soil redox conditions and microbial competition within flooded environments, potentially creating conditions favourable for methane production. Under these conditions, the proportional increase in methane emissions appears to have exceeded the associated yield gains, resulting in comparatively methane-intensive production despite improved productivity.
Robustness, scope, and limits of inference
Important limitations should be considered when interpreting these findings. First, the study was conducted over a single growing season and within a specific agroecological context, and longer-term dynamics remain uncertain. This is important as studies such as Thapa et al. (Reference Thapa, Muthuprakash, Damani, Bell and Isaac2025) showed that soil quality changes over time along an agroecological transition. The persistence of microbial effects across seasons, their interaction with interannual climate variability, and their performance under different soil and water regimes warrant further investigation. Second, the analysis focused on methane emissions and rice yield, without explicitly accounting for other greenhouse gases such as nitrous oxide or broader environmental outcomes. While methane dominates the climate footprint of flooded rice (Tewari, Reference Tewari1968; Ume et al., Reference Ume, Kalu, Ezeibe, Ume, Ugwuoke, Onah and Joseph2025), a more comprehensive assessment would strengthen conclusions about net climate impacts. Third, although the experimental design accounts for repeated measurements at the plot level and reflects real farmer management, the results do not capture potential feedback at larger spatial or institutional scales. Adoption dynamics, cost considerations, and interactions with other mitigation practices are critical to achieving widespread adoption and sustainability at scale (Nascimento and Höhne, Reference Nascimento and Höhne2023) and were beyond the scope of this study. These limitations do not undermine the central finding of methane–yield trade-off, but they do delineate the boundaries of inference and point to priorities for future research. Because the trial covered only one cropping season, the observed methane reductions should be interpreted as short-run treatment effects rather than evidence of persistent multi-season performance. The study does not assess whether introduced methanotroph populations persist across seasons, whether repeated inoculation would be required, or whether soil ecological feedbacks could amplify or weaken treatment effects over time.
The present findings should also be interpreted within the scope of the experimental design. The study was conducted over a single cropping season within a specific smallholder rice-growing context and focused primarily on methane emissions and productivity outcomes. Consequently, the results should not be interpreted as definitive evidence of long-term system-wide mitigation performance or national-scale sustainability transformation. Seasonal variability, agroecological heterogeneity, long-term soil dynamics, and additional greenhouse gas pathways such as nitrous oxide emissions may influence the broader climate implications of microbial interventions across different production environments. Accordingly, the findings are best interpreted as evidence that methanotroph-based intervention can substantially improve joint climate–productivity outcomes under farmer-managed conditions, while highlighting the need for longer-term and multi-region evaluation.
In addition, the present analysis focused specifically on methane emissions and did not evaluate other greenhouse gas pathways such as nitrous oxide (N2O) emissions. This is important because water and nutrient management strategies in rice systems can shift the balance between CH4 and N2O emissions under different redox conditions. For example, AWD systems often reduce methane emissions but may increase N2O emissions during aeration periods, while fertilizer management may alter microbial nitrogen cycling, with implications for the overall greenhouse gas balance. Consequently, the broader climate implications of methanotroph-based interventions should be evaluated within more comprehensive greenhouse gas accounting frameworks. Accordingly, the lower-emission outcomes reported in this study should be interpreted specifically as methane-related mitigation outcomes rather than evidence of a complete reduction in the overall greenhouse gas footprint of rice production systems. Because N2O emissions and other environmental indicators were not measured, the present study cannot determine the net global warming potential associated with methanotroph-based intervention.
The long-term persistence, ecological stability, and carryover effects of introduced methanotroph populations also remain uncertain. Although the present study demonstrates strong short-run treatment effects under farmer-managed conditions, it remains unclear whether introduced microbial communities persist across multiple cropping cycles, require repeated inoculation, or interact with local soil microbial assemblages over time. Longitudinal and multi-season studies are therefore needed to assess the durability and ecological stability of observed treatment effects.
Future work should examine how microbial interventions interact with established mitigation strategies, such as AWD, and whether combined approaches can further shift methane–yield outcomes. Long-term field trials across diverse agroecological settings will be essential to assess durability, scalability, and integration into measurement, reporting, and verification frameworks. Furthermore, this study evaluates within-season mitigation effects over a complete cropping cycle. Although the longer-term persistence of introduced methanotrophs remains an open question, the design captures mitigation performance under operational conditions relevant to near-term climate accounting. The intervention was implemented using application protocols compatible with existing farmer practices and without specialized equipment, suggesting feasibility for scaling within smallholder extension and climate-smart agriculture programmes. While the present findings demonstrate strong methane mitigation potential, broader climate benefits should be confirmed through integrated assessments that include N2O emissions and whole-system greenhouse gas accounting. Together, these efforts can help expand the mitigation toolkit for rice systems in ways that align climate goals with the realities of smallholder agriculture. While the trial was conducted within a specific agroecological context, the randomized, farmer-managed design across heterogeneous soils enhances external validity relative to prior controlled experiments.
Although the observed joint outcome patterns are consistent with a shift away from conventional methane–yield trade-offs, the present analysis does not formally estimate production frontiers or treatment-specific methane–yield response functions. Future work using frontier, efficiency, or response-surface approaches could further evaluate the structural properties of these relationships.
By demonstrating that methane emissions and yield can be jointly reshaped under prevailing smallholder conditions, this study contributes to a broader rethinking of how climate mitigation in rice systems is conceptualized. Prior work has largely concluded that mitigation is achieved primarily through management optimization, especially water control (for example, AWD and drainage), which often reduces methane but can increase nitrous oxide, or requires precise irrigation scheduling and monitoring (Bertora et al., Reference Bertora, Peyron, Pelissetti, Grignani and Sacco2018; Vitali et al., Reference Vitali, Moretti, Bertora, Miniotti, Tenni, Romani, Facchi, Martin, Fogliatto, Vidotto, Celi and Said-Pullicino2024). Complementary evidence shows that fertilizer and nutrient strategies can produce heterogeneous outcomes and, in many cases, increase methane emissions depending on the form and timing of N inputs and organic amendments, complicating simple ‘fertilizer-based mitigation’ narratives (Bertora et al., Reference Bertora, Peyron, Pelissetti, Grignani and Sacco2018). Importantly, adoption studies find that even when management strategies are agronomically successful, smallholders’ uptake is limited by irrigation institutions, production risks, labour needs, and water control issues (El Fartassi et al., Reference El Fartassi, Metcalfe, El Alami, Diarra, Alonso-Chavez, Waine, Zawadzka, Milne and Corstanje2025). Building on these conclusions, our contribution shows that methane mitigation can occur alongside maintained productivity in prevailing smallholder management conditions, subject to real management constraints.
The practical scalability of methanotroph-based intervention will depend not only on biological effectiveness but also on cost, delivery systems, regulatory approval, and quality assurance under field conditions. Although the present study did not conduct a formal cost-effectiveness analysis, methanotroph inoculation was implemented using relatively simple application procedures compatible with prevailing farmer practices and without specialized irrigation infrastructure. In principle, inoculum distribution could potentially occur through existing agricultural extension systems, farmer cooperatives, climate-smart agriculture programmes, or private input distribution networks. However, large-scale deployment would require reliable inoculum production, storage stability, microbial quality control, and regulatory approval frameworks to ensure consistency and farmer confidence. The long-term adoption potential of microbial mitigation strategies will therefore depend not only on mitigation performance but also on affordability, institutional support, and integration into existing agricultural delivery systems.
Data availability statement
The code that supports the findings of this study is publicly available at https://github.com/umechukwuma2/methanotroph-field-trial and archived on Zenodo with a persistent DOI: https://doi.org/10.5281/zenodo.18084266.
The data that support the findings of this study are not publicly available due to ethical considerations and confidentiality agreements with participating farmers. Access to anonymized data may be granted upon reasonable request to the corresponding author, subject to approval and compliance with relevant ethical and data protection guidelines.
Acknowledgments
None.
Author contributions
Chukwuma Ume: Conceived the study, formulated the research questions, designed the study, coordinated data collection and analysis, interpreted the findings, and drafted the manuscript. Yonas T. Bahta: Contributed to the conceptualization and study design. Nice Chukwuma-Ume: Assisted in the study design, data collection, and interpretation of results. Uche Kalu Felix: Participated in data collection, data management, analysis, and manuscript review. Ifeoma Anugwa: Contributed to the interpretation of findings and manuscript revision. Sunny Chukwuemeka Ume: Assisted with data collection and field implementation. Ukwuaba Ikenna Charles: Participated in data collection and analysis. Ibe Justina Chituru: Assisted with data collection, validation of results, and manuscript review. Daniel Uyeh: Contributed to the study design, manuscript editing, data analysis, interpretation of findings, and critical revision of the manuscript. Henry Jordaan: Supervised the research. All authors read and approved the final version of the manuscript.
Funding statement
This work was supported by the EQT Foundation, Sweden, under the EQT Foundation’s Breakthrough Science Grant program, and the DéSIRA+ in West Africa project with the Project No. ARAA/DESIRA/2025/AP/01.
Competing interests
The authors declare that they have no known competing economic interests or personal relationships that could influence the work presented in this article.






 Open access

