

Introduction
Since the vast majority of microbes in any environment are uncultured, polymerase chain reaction (PCR) typing and sequencing methods targeting the 16S ribosomal RNA (rRNA) gene, and other housekeeping or organism-specific genes have been widely adopted to identify and quantitate members of microbial communities (Wooley et al. , Reference Wooley, Godzik and Friedberg2010). For decades, 16S rDNA profiling has been the mainstay of studies of archaeal and bacterial communities in terrestrial and marine environments. In the mid 2000s, these technologies began to be applied to human and animal microbial communities.
Sequencing full-length 16S rRNA gene clones by the Sanger dideoxy chain termination method (Sanger et al. , Reference Sanger, Nicklen and Coulson1977) is the gold standard because paired-end sequencing provides high-quality overlapping reads that can cover the entire gene. Low error rates (<0.1%) are particularly important when using 16S rDNA sequences for taxonomic assessment since a 3% difference across the ca. 1500 bp gene usually discriminates between species, phylotypes or operational taxonomic units (OTUs). The transition to ‘next-generation’ sequencing technologies such as 454 picotiter pyrosequencing (Margulies et al. , Reference Margulies, Egholm, Altman, Attiya, Bader, Bemben, Berka, Braverman, Chen, Chen, Dewell, Du, Fierro, Gomes, Godwin, He, Helgesen, Ho, Irzyk, Jando, Alenquer, Jarvie, Jirage, Kim, Knight, Lanza, Leamon, Lefkowitz, Lei, Li, Lohman, Lu, Makhijani, McDade, McKenna, Myers, Nickerson, Nobile, Plant, Puc, Ronan, Roth, Sarkis, Simons, Simpson, Srinivasan, Tartaro, Tomasz, Vogt, Volkmer, Wang, Wang, Weiner, Yu, Begley and Rothberg2005; Sogin et al. , Reference Sogin, Morrison, Huber, Mark Welch, Huse, Neal, Arrieta and Herndl2006) allowed generation of thousands of reads per sample, but the read length was much shorter (originally <100 bases) and the error rates were between 1 and 3%. Such metrics caused significant overestimates of community abundance and diversity and identification of ‘new rare’ phylotypes. It was soon recognized that poor read quality, including homopolymer tracts, contributed to many of these (Huse et al. , Reference Huse, Huber, Morrison, Sogin and Welch2007).
In 2008, the NIH/NHGRI officially launched the Human Microbiome Project (HMP; www.hmpdacc.org); the MetaHIT (Metagenomics of the Human Intestinal Tract) European research project (www.metahit.eu) was initiated shortly thereafter, and both stimulated interest in all aspects of human metagenomics, from protocol design to data analysis and visualization, to disease correlation. One of the primary goals of the HMP was to collect clinical samples from 15 to 18 body sites (dependent on sex) from 300 healthy subjects then use the nucleic acid obtained from these samples for microbial community analysis by evolving methods of nucleic acid sequencing. In the USA, the involvement of four genome sequencing centers that would sequence thousands of samples from 300 healthy human subjects required development of consistent and reproducible protocols for sample handling, nucleic acid extraction, sequencing and read filtering, assembly and analysis. These protocols and recommendations, as well as analysis and interpretation of much of the subject sequence data, are described in key ‘marker’ papers (Huttenhower et al. , Reference Huttenhower, Gevers, Knight, Abubucker, Badger, Chinwalla, Creasy, Earl, Fitzgerald, Fulton, Giglio, Pepin, Lobos, Madupu, Magrini, Martin, Mitreva, Muzny, Sodergren, Versalovic, Wollam, Worley, Wortman, Young, Zeng, Aagaard, Allen-Vercoe, Alm, Alvarado, Andersen, Anderson, Appelbaum, Arachchi, Armitage, Arze, Ayvaz, Baker, Begg, Belachew, Bihan, Blaser, Bloom, Bonazzi, Brooks, Buck, Buhay, Busam, Campbell, Canon, Cantarel, Chen, Chhibba, Chu, Ciulla, Clemente, Clifton, Conlan, Crabtree, Cutting, Davidovics, Davis, Desantis, Deal, Delehaunty, Dewhirst, Deych, Dooling, Dugan, Dunne, Durkin, Edgar, Erlich, Farmer, Farrell, Faust, Feldgarden, Felix, Fisher, Fodor, Forney, Foster, Di Francesco, Friedman, Friedrich, Fronick, Fulton, Gao, Garcia, Giannoukos, Giblin, Giovanni, Goldberg, Goll, Gonzalez, Gujja, Haake, Haas, Hamilton, Harris, Hepburn, Herter, Hoffmann, Holder, Huang, Huse, Izard, Jansson, Jiang, Jordan, Joshi, Katancik, Keitel, Kelley, Kells, King, Knights, Kong, Koren, Kota, Kovar, Kyrpides, Lee, Lemon, Lennon, Lewis, Lewis, Ley, Li, Liolios, Liu, Lozupone, Lunsford, Madden, Mahurkar, Mannon, Mardis, Markowitz, McDonald, McEwen, McGuire, McInnes, Mehta, Mihindukulasuriya, Newsham, Nusbaum, O'laughlin, Orvis, Pagani, Palaniappan, Patel, Pearson, Peterson, Podar, Pohl, Pollard, Pop, Priest, Proctor, Qin, Raes, Reid, Rhodes, Riehle, Rivera, Rodriguez-Mueller, Rogers, La Rosa, Ross, Russ, Sanka, Sankar, Sathirapongsasuti, Schloss, Schloss, Schmidt, Schriml, Schubert, Segata, Segre, Shannon, Sharp, Sharpton, Shenoy, Sheth, Simone, Singh, Smillie, Sobel, Spicer, Sutton, Sykes, Tabbaa, Thiagarajan, Tomlinson, Torralba, Truty, Vishnivetskaya, Walker, Wang, Wang, Ward, Watson, Wellington, Wetterstrand, White, Wilczek-Boney, Wu, Wylie, Wylie, Yandava, Ye, Yooseph, Youmans, Zhang, Zhou, Zhu, Zoloth, Zucker, Birren, Gibbs, Highlander, Methé, Nelson, Petrosino, Weinstock, Wilson, White, Griggs, Liu, Lo, Howarth, Sommer, McCorrison, Miller, Mavromatis, Chen, Ye, Scholz, Rho, Abolude, Minx, Chain, Koren, Treangen, Bhonagiri, Warren, Ding and Ravel2012; Methé et al. , Reference Methé, Nelson, Pop, Creasy, Giglio, Huttenhower, Gevers, Petrosino, Abubucker, Badger, Chinwalla, Earl, Fitzgerald, Fulton, Hallsworth-Pepin, Lobos, Madupu, Magrini, Martin, Mitreva, Muzny, Sodergren, Versalovic, Wollam, Worley, Wortman, Young, Zeng, Aagaard, Allen-Vercoe, Alm, Alvarado, Andersen, Anderson, Appelbaum, Arachchi, Armitage, Arze, Ayvaz, Baker, Begg, Belachew, Bihan, Blaser, Bloom, Bonazzi, Brooks, Buck, Buhay, Busam, Campbell, Canon, Cantarel, Chen, Chhibba, Chu, Ciulla, Clemente, Clifton, Conlan, Crabtree, Cutting, Davidovics, Davis, Desantis, Deal, Delehaunty, Dewhirst, Deych, Dooling, Dugan, Dunne, Durkin, Edgar, Erlich, Farmer, Farrell, Faust, Feldgarden, Felix, Fisher, Fodor, Forney, Foster, Di Francesco, Friedman, Friedrich, Fronick, Fulton, Gao, Garcia, Giannoukos, Giblin, Giovanni, Goldberg, Goll, Gonzalez, Gujja, Haake, Haas, Hamilton, Harris, Hepburn, Herter, Hoffmann, Holder, Huang, Huse, Izard, Jansson, Jiang, Jordan, Joshi, Katancik, Keitel, Kelley, Kells, King, Knight, Knights, Kong, Koren, Kota, Kovar, Kyrpides, Lee, Lemon, Lennon, Lewis, Lewis, Ley, Li, Liolios, Liu, Lozupone, Lunsford, Madden, Mahurkar, Mannon, Mardis, Markowitz, McDonald, McEwen, McGuire, McInnes, Mehta, Mihindukulasuriya, Newsham, Nusbaum, O'Laughlin, Orvis, Pagani, Palaniappan, Patel, Pearson, Peterson, Podar, Pohl, Pollard, Priest, Proctor, Qin, Raes, Reid, Rhodes, Riehle, Rivera, Rodriguez-Mueller, Rogers, La Rosa, Ross, Russ, Sanka, Sankar, Sathirapongsasuti, Schloss, Schloss, Schmidt, Schriml, Schubert, Segata, Segre, Shannon, Sharp, Sharpton, Shenoy, Sheth, Simone, Singh, Smillie, Sobel, Spicer, Sutton, Sykes, Tabbaa, Thiagarajan, Tomlinson, Torralba, Truty, Vishnivetskaya, Walker, Wang, Wang, Ward, Watson, Wellington, Wetterstrand, White, Wilczek-Boney, Wu, Wylie, Wylie, Yandava, Ye, Yooseph, Youmans, Zhang, Zhou, Zhu, Zoloth, Zucker, Birren, Gibbs, Highlander, Weinstock and Wilson2012; Ward et al. , Reference Ward2012) that form the basis for some of the following descriptions and recommendations for current microbial community sequencing and analysis approaches. These approaches are broadly applicable to microbiome projects in production animal species.
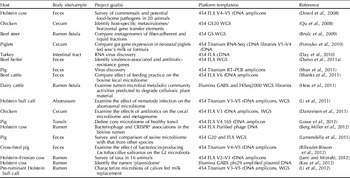
Until very recently, few studies focused on the microbiota of animals of agricultural significance. The exceptions were projects focused on the microbial composition and metagenomic function of the bovine rumen (Brulc et al. , Reference Brulc, Antonopoulos, Miller, Wilson, Yannarell, Dinsdale, Edwards, Frank, Emerson, Wacklin, Coutinho, Henrissat, Nelson and White2009; Bretschger et al. , Reference Bretschger, Osterstock, Pinchak, Ishii and Nelson2010). Studies of the rumen microbiome and its metabolome continue to be of broad interest to microbiologists, ecologists, nutritionists, and chemists and biologists interested in biomass processing. Early microbial community surveys in production animals were limited to semi-quantitative methods such as polymerase chain reaction (PCR)-denaturing gradient gel electrophoresis or terminal restriction fragment length polymorphism length determinations, or to clone-based Sanger sequencing of the 16S rDNA gene (Yu and Morrison, Reference Yu and Morrison2004a; Ozutsumi et al. , Reference Ozutsumi, Hayashi, Sakamoto, Itabashi and Benno2005; Scupham et al. , Reference Scupham, Patton, Bent and Bayles2008; Durso et al. , Reference Durso, Harhay, Smith, Bono, Desantis and Clawson2011b; Lowe et al. , Reference Lowe, Marsh, Isaacs-Cosgrove, Kirkwood, Kiupel and Mulks2011). The first applications of 454 pyrosequencing to examine the microbiota of food production animals were published in 2008 (Dowd et al. , Reference Dowd, Callaway, Wolcott, Sun, McKeehan, Hagevoort and Edrington2008; Qu et al. , Reference Qu, Brulc, Wilson, Law, Theoret, Joens, Konkel, Angly, Dinsdale, Edwards, Nelson and White2008). High throughput sequencing studies of these microbial communities have not been numerous, and often involve only a few animals, perhaps because of lack of available funding and appropriate protocols, but also because of limited access to sequencing facilities that routinely process and sequence 16S rDNA amplicons at reasonable cost. Table 1 lists some high throughput microbial community profiling projects involving production animal species. Some of these were surveys, while others were hypothesis driven projects; only a small fraction of these addressed any aspect of disease in the host species. Note that some were virus discovery projects that benefited from sample enrichment methods and amplification techniques for high throughput sequencing.
Examples of high throughput sequence-based microbiome studies in food animal species

* CRISPR: ‘clustered regularly interspaced short palindromic repeats’ implicated in bacterial resistance to bacteriophage (Horvath and Barrangou, Reference Horvath and Barrangou2010).
Sequence-based 16S rDNA surveys of the fecal or rumen microbiota of many other non-rodent and non-primate mammals have also been published. These include the studies of the dog (Suchodolski et al. , Reference Suchodolski, Camacho and Steiner2008), the dromedary camel (Samsudin et al. , Reference Samsudin, Evans, Wright and Al Jassim2011), reindeer (Sundset et al. , Reference Sundset, Edwards, Cheng, Senosiain, Fraile, Northwood, Praesteng, Glad, Mathiesen and Wright2009), the polar bear (Glad et al. , Reference Glad, Bernhardsen, Nielsen, Brusetti, Andersen, Aars and Sundset2010), as well as a broad survey by Ley et al. (Reference Ley, Hamady, Lozupone, Turnbaugh, Ramey, Bircher, Schlegel, Tucker, Schrenzel, Knight and Gordon2008), in which the fecal diversity of 106 mammals including kangaroo, elephant, rhinoceros, giraffe, panda, zebra, bear, and wild pigs, was examined.
Although the field of microbial community profiling and metagenomics is under rapid development and change, this review will attempt to summarize current approaches, with the knowledge that new sequencing platforms are constantly entering the sequencing arena and being used to develop applications for 16S rDNA and whole genome shotgun (WGS) metagenomic sequencing. In the following sections, methods and considerations for sample handling and nucleic acid extraction for microbiome surveys and metagenomic sequencing will be discussed. Current 16S rDNA and WGS sequencing strategies will be described, followed by brief discussions of established methods for community analysis using the two data types.
Sample acquisition and nucleic acid preparation
Most animal studies utilize fecal samples as the source of microbial nucleic acid, though rumen contents and samples from other body sites, such as the tonsils (see Table 1) have been used. In each case, appropriate handling of the sample is the key as microbial nucleic acid is ubiquitous. An object (tube, tip, swab, etc.) or solution that is bacteriologically ‘sterile’ is not necessarily free of nucleic acid. This can be especially challenging in veterinary settings. The primary sample (feces, swab sample, milk, and tissue) should be placed in a tube containing extraction buffer that includes nuclease inhibitors, then, if possible, the sample should be appropriately diluted and immediately processed for nucleic acid purification. If prompt DNA extraction is not possible, then the sample should be frozen on dry ice and stored at −80°C for the shortest time possible. The effect of prolonged sample storage is still a subject of debate (Lauber et al. , Reference Lauber, Zhou, Gordon, Knight and Fierer2010; Wu et al. , Reference Wu, Lewis, Hoffmann, Chen, Knight, Bittinger, Hwang, Chen, Berkowsky, Nessel, Li and Bushman2010; Zhao et al. , Reference Zhao, Li, Schloss, Kalikin, Raymond, Petrosino, Young and Lipuma2011; Bahl et al. , Reference Bahl, Bergstrom and Licht2012), so in most cases, prudent sample handling and experimental ‘convenience’ are tolerated.
A variety of commercial kits and associated techniques have been used for isolation of DNA samples from vertebrates. For the HMP, a single kit, the MO BIO Laboratories, Inc. (Carlsbad, CA) PowerSoil® DNA Isolation Kit, was selected for all body site samples (http://www.hmpdacc.org/tools_protocols/tools_protocols.php). This kit utilizes SDS and bead beating to lyse the cells and includes a proprietary PCR inhibitor removal solution. The DNA is purified from the lysate using a silica spin column. Another kit that is commonly used is the Qiagen (Valencia, CA) QIAamp DNA Stool Kit (Dowd et al. , Reference Dowd, Callaway, Wolcott, Sun, McKeehan, Hagevoort and Edrington2008; Riboulet-Bisson et al. , Reference Riboulet-Bisson, Sturme, Jeffery, O'donnell, Neville, Forde, Claesson, Harris, Gardiner, Casey, Lawlor, O'Toole and Ross2012). In this protocol, microbes are lysed in SDS at high temperature (e.g. 70°C), the sample is then incubated with a proprietary PCR inhibitor, followed by proteinase K treatment and then the DNA is purified on a spin column. Often, a bead-beating lysis step is used prior to purification using a Qiagen DNA purification kit (Yu and Morrison, Reference Yu and Morrison2004b; Qu et al. , Reference Qu, Brulc, Wilson, Law, Theoret, Joens, Konkel, Angly, Dinsdale, Edwards, Nelson and White2008; Danzeisen et al. , Reference Danzeisen, Kim, Isaacson, Tu and Johnson2011). The importance of protocols that include both chemical and bead-beating lysis of the cells has been discussed and examined on many occasions. Recently, Yuan et al. (Reference Yuan, Cohen, Ravel, Abdo and Forney2012) published a systematic evaluation of six common DNA extraction methods that utilized combinations of chemical, enzyme-based and bead-beating-based lysis techniques; five of these used silica columns for final DNA purification. An important aspect of their approach was the application of these methods to a mock community composed of a mixture of equivalent numbers of 11 bacterial species. 16S rDNA sequencing using the 454 FLX platform was performed on technical replicates of DNA isolated by each lysis method. The authors advised that DNA extraction methods for bacterial communities should employ a chemical lysis component plus bead beating and/or addition of mutanolysin to yield a reasonable recovery and representation of the species within a metagenomic sample. The current strategy in our laboratory is similar: we use the MO BIO PowerSoil® DNA Isolation Kit, beginning with a 1 h incubation at 37°C using a mixture of lysozyme, lysostaphin, and mutanolysin.
High throughput sequencing has also permitted identification of viruses and bacteriophages in production animal species (Table 1), including at least two new animal viruses (Hoffmann et al. , Reference Hoffmann, Scheuch, Hoper, Jungblut, Holsteg, Schirrmeier, Eschbaumer, Goller, Wernike, Fischer, Breithaupt, Mettenleiter and Beer2012; Reuter et al. , Reference Reuter, Nemes, Boros, Kapusinszky, Delwart and Pankovics2012) and numerous bacteriophages (Qu et al. , Reference Qu, Brulc, Wilson, Law, Theoret, Joens, Konkel, Angly, Dinsdale, Edwards, Nelson and White2008; Berg Miller et al. , Reference Berg Miller, Yeoman, Chia, Tringe, Angly, Edwards, Flint, Lamed, Bayer and White2012). For descriptions of techniques to enrich and isolate both RNA and DNA virus sequences from metagenomic samples, see Edwards and Rohwer (Reference Edwards and Rohwer2005) and Allander et al. (Reference Allander, Emerson, Engle, Purcell and Bukh2001). In brief, these protocols involve selective filtration and fractionation steps of the primary sample to isolate viral particles away from host and microbial cells, followed by nuclease treatment, recovery of viral particles, capsid lysis, and random PCR amplification, followed by adapter-specific PCR amplification to create fragments for high throughput sequencing, as detailed below.
16S rDNA gene sequencing methods and read processing
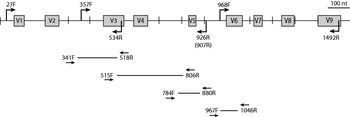
The bacterial and archaeal 16S ribosomal small subunit RNA is approximately 1500 nucleotides (nt) long and can be encoded by one to as many as 14 rRNA operons within an organism. The 16S rRNA molecule has a highly conserved and functionally constrained tertiary structure mainly composed of highly conserved domains (Gutell et al. , Reference Gutell, Larsen and Woese1994). These conserved domains are punctuated by nine ‘variable’ regions (Fig. 1), which in general, map to open loop structures within the molecule (Lane, Reference Lane, Stackebrandt and Goodfellow1991). Although near full-length sequences of cloned 16S rRNA genes are considered the gold standard for archaeal and bacterial classification, usually to the species level, full-length clone-based approaches have been replaced by high-throughput methods that directly sequence PCR products (amplicons). In most cases, amplicons that span two or more variable regions serve as reasonable surrogates for classification of organisms within a microbial community at the genus level or higher (Lan et al. , Reference Lan, Wang, Cole and Rosen2012), and the lengths of these variable region amplicons (ca. 550–600 bp) are appropriate for the current 454 Titanium chemistry.
Linear map of a ‘consensus’ eubacterial 16S rRNA gene with coordinates, variable regions, and some commonly used ‘universal’ primer locations shown. The variable regions are drawn to scale using the coordinates derived from Lane (Reference Lane, Stackebrandt and Goodfellow1991) and Woese et al. (Reference Woese, Winker and Gutell1990). Common primers used for full-length Sanger PCR amplification and sequencing (such as 27F and 1492R) and those used to create multiple region amplicons (V1–V3, V3–V5 and V6–V9) for HMP 454 sequencing are shown on the coordinate map. Primer pairs that have been used for single variable region amplification for 454 and/or Illumina sequencing are illustrated as horizontal bars with corresponding primers (arrows) and locations are shown below the coordinate map.

An important caveat, however, is that ‘universal’ primers do not amplify all 16S rRNA genes within a sample at equal efficiency. For this reason, some primers contain degenerate bases and in some cases, mixtures of primers are used to capture the expected diversity within a sample. Although many publications describe the deficiencies of particular universal 16S rDNA primer sets, especially for specific microbial communities (Matsuki et al. , Reference Matsuki, Watanabe, Fujimoto, Miyamoto, Takada, Matsumoto, Oyaizu and Tanaka2002; Frank et al. , Reference Frank, Reich, Sharma, Weisbaum, Wilson and Olsen2008; Sim et al. , Reference Sim, Cox, Wopereis, Martin, Knol, Li, Cookson, Moffatt and Kroll2012), it is surprising how rarely the choice of variable region and primers for a particular experiment or community is discussed or justified.
454 16S rDNA variable region amplicon sequencing
Individual 16S rRNA gene variable regions, or combinations thereof, have been used for amplicon sequencing on the 454 platform, beginning with the first application of the technology by Sogin et al. using the V6 region (967F and 1046R, Fig. 1) and 100 nt reads (Sogin et al. , Reference Sogin, Morrison, Huber, Mark Welch, Huse, Neal, Arrieta and Herndl2006). The current standard 454 Titanium chemistry produces more than 400 nt per amplicon read. A standardized protocol for 16S rDNA amplicon sequencing from human metagenomic DNA samples from all human body sites was developed based on extensive benchmarking by the HMP Consortium (including the use of standard DNA mock communities as sequencing controls) (Methé et al. , Reference Methé, Nelson, Pop, Creasy, Giglio, Huttenhower, Gevers, Petrosino, Abubucker, Badger, Chinwalla, Earl, Fitzgerald, Fulton, Hallsworth-Pepin, Lobos, Madupu, Magrini, Martin, Mitreva, Muzny, Sodergren, Versalovic, Wollam, Worley, Wortman, Young, Zeng, Aagaard, Allen-Vercoe, Alm, Alvarado, Andersen, Anderson, Appelbaum, Arachchi, Armitage, Arze, Ayvaz, Baker, Begg, Belachew, Bihan, Blaser, Bloom, Bonazzi, Brooks, Buck, Buhay, Busam, Campbell, Canon, Cantarel, Chen, Chhibba, Chu, Ciulla, Clemente, Clifton, Conlan, Crabtree, Cutting, Davidovics, Davis, Desantis, Deal, Delehaunty, Dewhirst, Deych, Dooling, Dugan, Dunne, Durkin, Edgar, Erlich, Farmer, Farrell, Faust, Feldgarden, Felix, Fisher, Fodor, Forney, Foster, Di Francesco, Friedman, Friedrich, Fronick, Fulton, Gao, Garcia, Giannoukos, Giblin, Giovanni, Goldberg, Goll, Gonzalez, Gujja, Haake, Haas, Hamilton, Harris, Hepburn, Herter, Hoffmann, Holder, Huang, Huse, Izard, Jansson, Jiang, Jordan, Joshi, Katancik, Keitel, Kelley, Kells, King, Knight, Knights, Kong, Koren, Kota, Kovar, Kyrpides, Lee, Lemon, Lennon, Lewis, Lewis, Ley, Li, Liolios, Liu, Lozupone, Lunsford, Madden, Mahurkar, Mannon, Mardis, Markowitz, McDonald, McEwen, McGuire, McInnes, Mehta, Mihindukulasuriya, Newsham, Nusbaum, O'Laughlin, Orvis, Pagani, Palaniappan, Patel, Pearson, Peterson, Podar, Pohl, Pollard, Priest, Proctor, Qin, Raes, Reid, Rhodes, Riehle, Rivera, Rodriguez-Mueller, Rogers, La Rosa, Ross, Russ, Sanka, Sankar, Sathirapongsasuti, Schloss, Schloss, Schmidt, Schriml, Schubert, Segata, Segre, Shannon, Sharp, Sharpton, Shenoy, Sheth, Simone, Singh, Smillie, Sobel, Spicer, Sutton, Sykes, Tabbaa, Thiagarajan, Tomlinson, Torralba, Truty, Vishnivetskaya, Walker, Wang, Wang, Ward, Watson, Wellington, Wetterstrand, White, Wilczek-Boney, Wu, Wylie, Wylie, Yandava, Ye, Yooseph, Youmans, Zhang, Zhou, Zhu, Zoloth, Zucker, Birren, Gibbs, Highlander, Weinstock and Wilson2012; Ward et al. , Reference Ward2012). The HMP protocol involved creation of PCR-derived amplicons for each DNA sample that encompass V1–V3, V3–V5 or V6–V9 regions using primers that begin with a 5′ 454 Titanium A or B adapter sequence followed by a 5–10 base sequence, called a ‘barcode’, and ending with a sequence complementary to the desired variable region (see Fig. 1 for a map of primer locations and Fig. 2 for primer sequence features). A set of 96 bar-coded primers was designed for each of the three 16S rRNA gene regions (http://www.hmpdacc.org) to permit sample multiplexing and inclusion of controls and replicates on a single picotiter sequencing plate. Following PCR amplification, the amplicons are purified, quantified, normalized and pooled. The pools are then used for emulsion PCR (emPCR) and 454 ‘One-way Read’ sequencing. For the HMP, the goal was to achieve 3000 high-quality reads per sample; this metric was based on a number of factors including estimates of coverage, sequencing capacity, and budget (Methé et al. , Reference Methé, Nelson, Pop, Creasy, Giglio, Huttenhower, Gevers, Petrosino, Abubucker, Badger, Chinwalla, Earl, Fitzgerald, Fulton, Hallsworth-Pepin, Lobos, Madupu, Magrini, Martin, Mitreva, Muzny, Sodergren, Versalovic, Wollam, Worley, Wortman, Young, Zeng, Aagaard, Allen-Vercoe, Alm, Alvarado, Andersen, Anderson, Appelbaum, Arachchi, Armitage, Arze, Ayvaz, Baker, Begg, Belachew, Bihan, Blaser, Bloom, Bonazzi, Brooks, Buck, Buhay, Busam, Campbell, Canon, Cantarel, Chen, Chhibba, Chu, Ciulla, Clemente, Clifton, Conlan, Crabtree, Cutting, Davidovics, Davis, Desantis, Deal, Delehaunty, Dewhirst, Deych, Dooling, Dugan, Dunne, Durkin, Edgar, Erlich, Farmer, Farrell, Faust, Feldgarden, Felix, Fisher, Fodor, Forney, Foster, Di Francesco, Friedman, Friedrich, Fronick, Fulton, Gao, Garcia, Giannoukos, Giblin, Giovanni, Goldberg, Goll, Gonzalez, Gujja, Haake, Haas, Hamilton, Harris, Hepburn, Herter, Hoffmann, Holder, Huang, Huse, Izard, Jansson, Jiang, Jordan, Joshi, Katancik, Keitel, Kelley, Kells, King, Knight, Knights, Kong, Koren, Kota, Kovar, Kyrpides, Lee, Lemon, Lennon, Lewis, Lewis, Ley, Li, Liolios, Liu, Lozupone, Lunsford, Madden, Mahurkar, Mannon, Mardis, Markowitz, McDonald, McEwen, McGuire, McInnes, Mehta, Mihindukulasuriya, Newsham, Nusbaum, O'Laughlin, Orvis, Pagani, Palaniappan, Patel, Pearson, Peterson, Podar, Pohl, Pollard, Priest, Proctor, Qin, Raes, Reid, Rhodes, Riehle, Rivera, Rodriguez-Mueller, Rogers, La Rosa, Ross, Russ, Sanka, Sankar, Sathirapongsasuti, Schloss, Schloss, Schmidt, Schriml, Schubert, Segata, Segre, Shannon, Sharp, Sharpton, Shenoy, Sheth, Simone, Singh, Smillie, Sobel, Spicer, Sutton, Sykes, Tabbaa, Thiagarajan, Tomlinson, Torralba, Truty, Vishnivetskaya, Walker, Wang, Wang, Ward, Watson, Wellington, Wetterstrand, White, Wilczek-Boney, Wu, Wylie, Wylie, Yandava, Ye, Yooseph, Youmans, Zhang, Zhou, Zhu, Zoloth, Zucker, Birren, Gibbs, Highlander, Weinstock and Wilson2012). For comparative analyses, where one expects to examine abundances of 1% or more, then 1000 high-quality reads should be sufficient. This level of coverage will not, however, permit sampling and identification of minor species or complete community analysis where diversity (number of OTUs) is expected to be high. All of these factors should be considered during the design phase of any microbiome study.
Summarized features of primers used to create V1–V3, V3–V5, and V6–V9 16S rDNA amplicons for 454 Titanium sequencing, respectively, where M=A or C; R=A or G; Y=C or T. B adapter=5′-CCTATCCCCTGTGTGCCTTGGCAGTCTCAG-3′; A adapter=5′-CCATCTCATCCCTGCGTGTCTCCGACTCAG-3′; Bar code=one of 96 known sequences of 5–10 bp in length, see Ward et al. , (Reference Ward2012). Note that primer 926R is equivalent to 907R-MP (Lane, Reference Lane, Stackebrandt and Goodfellow1991).

Illumina 16S rDNA variable region amplicon sequencing
The high throughput and coverage provided by the Illumina reversible dye terminator sequencing technology (Bentley et al. , Reference Bentley, Balasubramanian, Swerdlow, Smith, Milton, Brown, Hall, Evers, Barnes, Bignell, Boutell, Bryant, Carter, Keira Cheetham, Cox, Ellis, Flatbush, Gormley, Humphray, Irving, Karbelashvili, Kirk, Li, Liu, Maisinger, Murray, Obradovic, Ost, Parkinson, Pratt, Rasolonjatovo, Reed, Rigatti, Rodighiero, Ross, Sabot, Sankar, Scally, Schroth, Smith, Smith, Spiridou, Torrance, Tzonev, Vermaas, Walter, Wu, Zhang, Alam, Anastasi, Aniebo, Bailey, Bancarz, Banerjee, Barbour, Baybayan, Benoit, Benson, Bevis, Black, Boodhun, Brennan, Bridgham, Brown, Brown, Buermann, Bundu, Burrows, Carter, Castillo, Chiara, Chang, Neil Cooley, Crake, Dada, Diakoumakos, Dominguez-Fernandez, Earnshaw, Egbujor, Elmore, Etchin, Ewan, Fedurco, Fraser, Fuentes Fajardo, Scott Furey, George, Gietzen, Goddard, Golda, Granieri, Green, Gustafson, Hansen, Harnish, Haudenschild, Heyer, Hims, Ho, Horgan, Hoschler, Hurwitz, Ivanov, Johnson, James, Huw Jones, Kang, Kerelska, Kersey, Khrebtukova, Kindwall, Kingsbury, Kokko-Gonzales, Kumar, Laurent, Lawley, Lee, Lee, Liao, Loch, Lok, Luo, Mammen, Martin, McCauley, McNitt, Mehta, Moon, Mullens, Newington, Ning, Ling Ng, Novo, O'Neill, Osborne, Osnowski, Ostadan, Paraschos, Pickering, Pike, Pike, Chris Pinkard, Pliskin, Podhasky, Quijano, Raczy, Rae, Rawlings, Chiva Rodriguez, Roe, Rogers, Rogert Bacigalupo, Romanov, Romieu, Roth, Rourke, Ruediger, Rusman, Sanches-Kuiper, Schenker, Seoane, Shaw, Shiver, Short, Sizto, Sluis, Smith, Ernest Sohna Sohna, Spence, Stevens, Sutton, Szajkowski, Tregidgo, Turcatti, Vandevondele, Verhovsky, Virk, Wakelin, Walcott, Wang, Worsley, Yan, Yau, Zuerlein, Rogers, Mullikin, Hurles, McCooke, West, Oaks, Lundberg, Klenerman, Durbin and Smith2008) has led to the development of protocols for 16S rDNA profiling using shorter reads (75–100 nt). 16S rDNA amplicons have been sequenced on Illumina GAII instruments to examine human and environmental samples. The benefit is a 1000-fold increase in the number of reads per run when compared with 454 sequencing. The short read lengths are problematic, however, for 16S rRNA gene classification, especially at the level of OTU discrimination. This also is due, in part, to increased error rates.
The general scheme for Illumina amplicon preparation is similar to that for 454. Short bar-coded amplicons, corresponding to a single variable region or subregion (usually ca. 100–300 bp in length), are generated by bar-coded adapter-based PCR; amplicons are then normalized, pooled, and sequenced. The V3 (Bartram et al. , Reference Bartram, Lynch, Stearns, Moreno-Hagelsieb and Neufeld2011), V4 (Goll et al. , Reference Goll, Rusch, Tanenbaum, Thiagarajan, Li, Methe and Yooseph2010; Caporaso et al. , Reference Caporaso, Lauber, Walters, Berg-Lyons, Lozupone, Turnbaugh, Fierer and Knight2011), V5 (Lazarevic et al. , Reference Lazarevic, Whiteson, Huse, Hernandez, Farinelli, Osteras, Schrenzel and Francois2009), and V6 (Bateman et al. , Reference Bateman, Coin, Durbin, Finn, Hollich, Griffiths-Jones, Khanna, Marshall, Moxon, Sonnhammer, Studholme, Yeats and Eddy2004) regions have been used with some success (Fig. 1). In most cases, amplicons are sequenced from both ends (i.e. paired-end reads) to obtain the maximal information from the amplicon. As proof of the utility of paired-end sequencing, amplicons derived from Illumina tagged versions of 515F and 806R (Fig. 1), sequenced on a MiSeq System instrument (2×150 nt reads), were able to span the 254 bp V4 region and provide community discrimination at the phylum level (Illumina Application Note 770-2011-013).
A major bottleneck for both the 454 and Illumina-based 16S rDNA sequencing strategies is the creation, purification, and quantification of each individual PCR amplicon library prior to sequencing. Although the on-instrument sequencing costs are continuing to decline, individual library construction remains labor intensive. Methods that automate this aspect of the process will ultimately reduce costs and process time.
Processing raw 16S rDNA sequence data
A critical aspect of interpretation of high throughput 16S rDNA sequence data is read processing and error correction. Without proper read processing, the diversity of a sample can be overestimated and reads can be misclassified. The same is true for data generated by Sanger sequencing, but the general requirement for high quality bases imposed by the Human Genome Sequencing Project, the relatively low number of sequences generated per community (usually many <1000 per sample) and the lack of appreciation of the formation of chimeric 16S rDNA molecules (caused by template switching during PCR amplification), made these issues seem insignificant compared with application to tens of thousands of reads that covered less than a third of the 16S rRNA gene. These factors came into clear view when sequencing amplicons created from a mixed DNA community containing an equal mixture of DNAs from 20 bacterial strains representing 18 OTUs (mock community) were examined as part of protocol development for the HMP (Ward et al. , Reference Ward2012). Using raw reads generated from 454 sequencing of variable region amplicons, the 18 OTU community was estimated to contain about 300 members. Following stringent quality filtering and trimming, the predicted community size fell to about 200 OTUs. Removal of chimeric 16S rDNA sequences reduced the predicted community size to ca. 50–100, dependent on the variable region amplicon sequenced. The application of these same processing steps to full-length Sanger reads predicted exactly 18 OTUs. Thus, quality filtering, trimming, and chimera removal are essential. We follow a 454 16S rDNA read processing pipeline that is similar to that described by Ward et al. , (Reference Ward2012), though chimeric sequences are detected and removed using UCHIME (Edgar et al. , Reference Edgar, Haas, Clemente, Quince and Knight2011), which is more sensitive and is 1000 times faster than the method used by them.
Overview of 16S rDNA analysis methods
The analysis of 16S rDNA data can be targeted toward broad questions concerning the microbial community, including: (1) How diverse is the community? (2) How do two or more communities differ? (3) Who are the members of the community? (4) How are members of communities interrelated? The answers to these types of queries can be qualitative (is a member present or absent?) or quantitative (how abundant are members?) and numerous statistical and bioinformatic tools are available to explore these questions. Following is a brief overview of some common 16S rDNA analysis approaches.
Question one addresses the issue of alpha diversity, which is a measure of how many different members are within a community. A common illustration of alpha diversity is a collector's curve (Fig. 3a), which plots the number of OTUs or taxa discovered in a sample as a function of the number of sequences generated. These plots can reveal the richness of a community and provide clues as to whether the sample has been sufficiently sampled (by sequencing) to capture all of its diversity (a curve approaching a plateau) or not (a climbing curve). Other common measures of alpha diversity are the Chao1 estimator (Chao, Reference Chao1984) that calculates species richness by extrapolation, and Simpson's Reciprocal Diversity Index (1/D) (Magurran, Reference Magurran1988), which reflects both the richness (number of taxa) and the evenness (relative taxon abundance) within a sample (Fig. 3b).
(a) Example of collector's curves showing three different hypothetical microbial communities. Accumulating numbers of OTUs are plotted as a function of number of sequences determined per community. The community indicated by the filled line is estimated to have been sequenced to saturation between 800 and 1000 sequences and is predicted to contain about 60 OTUs. The community represented by the dotted line has not reached saturation, but is predicted to be composed of not more than 200 OTUs after about 3000 sequences have been collected. The third community, shown by the hashed line, is continuing to accumulate OTUs beyond the level of sequencing depth suggesting a high level of community richness. (b) Box and whisker plot of the Simpson's Reciprocal Diversity Index for two hypothetical microbial communities, where community B is predicted to be more diverse than community A.

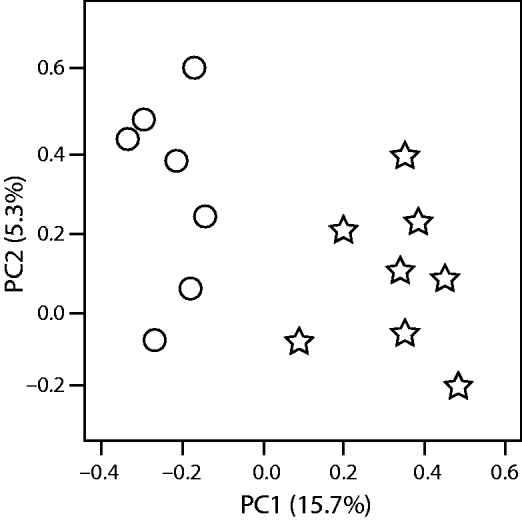
The differences (and similarities) between communities is called beta diversity. This can be calculated using one of a number of qualitative or quantitative similarity indices to create distance matrices that can be used to visualize community clusters. The Unique Fraction metric, or UniFrac (Lozupone and Knight, Reference Lozupone and Knight2005), has been used by many groups to examine beta diversity in microbial communities. This is a metric that uses the evolutionary relatedness of sequences and communities (see below) to calculate distance matrices. In contrast, beta diversity coefficients that do not depend on pre-determined phylogenies are, for example: Bray-Curtis, Morisita-Horn, and the Sörensen indices (Magurran, Reference Magurran1988). A common method used to visualize beta diversity between communities is principal coordinate analysis (PCoA). In simple terms, PCoA processes the calculated distance matrix into a smaller number of variables, called principal components, then reorients the matrix so that the first component accounts for the majority of the variability in the dataset, the second component accounts for the second tier of variability and so on. One can then plot the first two (x and y), or more coordinates of the analysis, to visualize community clusters (Fig. 4). Other methods for visualization of beta diversity include hierarchical clustering and generation of trees.
Example of a scatterplot of the first two components from a PCoA analysis of two microbial communities (indicated by circles or stars) where 15.7% of the difference between the communities is described within the first component (PC1) and 5.3% is reflected within the second component (PC2).

To identify and quantitate the membership of a community to answer, ‘Who is there?’, one can simply submit raw (trimmed and chimera-checked) sequences to a web-based rRNA classifier. The most commonly used classifier is the naïve Bayesian rRNA Classifier (Wang et al. , Reference Wang, Garrity, Tiedje and Cole2007), maintained as part of the Ribosomal Database Project (RDP) (Cole et al. , Reference Cole, Wang, Cardenas, Fish, Chai, Farris, Kulam-Syed-Mohideen, McGarrell, Marsh, Garrity and Tiedje2009). Although RDP and its associated taxonomy (rdp.cme.msu.edu) are those most commonly used and cited, one should be aware that other 16S rRNA gene taxonomies and associated databases are available, including those as part of Greengenes (McDonald et al. , Reference McDonald, Price, Goodrich, Nawrocki, Desantis, Probst, Andersen, Knight and Hugenholtz2012), SILVA (Pruesse et al. , Reference Pruesse, Quast, Knittel, Fuchs, Ludwig, Peplies and Glockner2007), and the NCBI taxonomy (Federhen, Reference Federhen2012). No two taxonomies are equivalent and some are more inclusive than others, some are more frequently updated and curated, and some place special emphasis on particular groups of organisms. About 90% of high quality, chimera checked 454 16S rDNA amplicon sequences from human body sites, other than those from the stool, could be classified to the genus level with greater than 80% confidence using the RDP Classifier with RDP Release 10 (Ward et al. , Reference Ward2012). The most recent update of Greengenes reports improvements for under classified environmental sequences; this update has not yet been tested with HMP data.
Although classification using the RDP Classifier alone can provide rank abundance data, high throughput methods for large datasets usually divide sequences into OTUs, or taxa, before proceeding with downstream analyses. Here is a point of divergence in approach. OTUs can be assigned based on sequence similarity (or distance), or they can be assigned by relating them to a phylogenetic tree. These are considered: (1) phylogeny-independent, or OTU-based methods (Schloss et al. , Reference Schloss, Westcott, Ryabin, Hall, Hartmann, Hollister, Lesniewski, Oakley, Parks, Robinson, Sahl, Stres, Thallinger, Van Horn and Weber2009), versus (2) phylogeny-dependent, or phylogenetic methods (Lozupone and Knight, Reference Lozupone and Knight2005; Lozupone et al. , Reference Lozupone, Lladser, Knights, Stombaugh and Knight2011). An advantage of the OTU-based approach is that it has no taxonomic bias and readily accepts novel sequences from unknown taxonomies. A disadvantage is that de novo OTU assignment is computationally intensive. The phylogenetic method, such as that used in UniFrac, is considered to be more useful for examining similarities and differences among species in communities (Lozupone and Knight, Reference Lozupone and Knight2008). Considerable controversy surrounded the rationale for choosing one method or another, especially for beta diversity analyses (Schloss, Reference Schloss2008; Lozupone et al. , Reference Lozupone, Lladser, Knights, Stombaugh and Knight2011), though most agree that there are benefits and pitfalls associated with each scheme.
Two freely available 16S rRNA gene analysis packages, QIIME (qiime.org) (Kuczynski et al. , Reference Kuczynski, Stombaugh, Walters, Gonzalez, Caporaso and Knight2011) and mothur (http://www.mothur.org) (Schloss et al. , Reference Schloss, Westcott, Ryabin, Hall, Hartmann, Hollister, Lesniewski, Oakley, Parks, Robinson, Sahl, Stres, Thallinger, Van Horn and Weber2009), can perform all of the processes described above, plus many more, while a wrapper, called CloVR (clovr.org), that incorporates most of the features of QIIME and mothur has also been developed (Angiuoli et al. , Reference Angiuoli, Matalka, Gussman, Galens, Vangala, Riley, Arze, White, White and Fricke2011). The QIIME package (Kuczynski et al. , Reference Kuczynski, Stombaugh, Walters, Gonzalez, Caporaso and Knight2011) uses UniFrac-based phylogenetic beta diversity metrics (Lozupone and Knight, Reference Lozupone and Knight2005) to create distance matrices that are either unweighted or weighted, for qualitative or quantitative assessments, respectively. The input required is an OTU abundance table and a phylogenetic tree, which can be generated by QIIME. Other more complex types of community interactions, including hierarchical clustering, and networks can also be visualized using the distance matrix file as input. The platform will also perform OTU-based analyses. The mothur package is more focused on OTU-based approaches to evaluate community diversity but also includes the UniFrac algorithms. It includes a useful read processing pipeline that is used by the HMP. Both QIIME and mothur include clustering and network analysis tools that can be used to begin to address the fourth and most complex question that was posed at the beginning of this section, ‘How are members of communities interrelated?’
Whole genome shotgun sequencing and analysis methods
Although 16S rRNA gene surveys provide immense information about microbial communities, the problems associated with the use of 16S rDNA data alone, especially in high throughput contexts where only a portion of the 16S rRNA gene is amplified and analyzed, have been previously discussed. As sequencing technologies have evolved, throughput has increased and costs have decreased, so more studies are including or are exclusively composed of WGS sequencing data. This method also has benefits and drawbacks. WGS sequencing is capable of providing true metagenomic data though analysis is complex and processor intensive. Indeed, the first application of 454 sequencing to examine a microbial community was a metagenomic sequencing project of a deep mine environment (Edwards et al. , Reference Edwards, Rodriguez-Brito, Wegley, Haynes, Breitbart, Peterson, Saar, Alexander, Alexander and Rohwer2006); in food production animals the first use was a study of the chicken cecum (Qu et al. , Reference Qu, Brulc, Wilson, Law, Theoret, Joens, Konkel, Angly, Dinsdale, Edwards, Nelson and White2008; Table 1). WGS sequencing permits annotation of most bacterial genes within a sample and is not restricted to issues associated with 16S rRNA gene phylogenies. Gene annotations can be used to predict function of a metagenome and thus be used to construct predicted ‘metabolomes’ (Turnbaugh and Gordon, Reference Turnbaugh and Gordon2008).
Most recent WGS metagenomic sequencing has been performed on 454 or Illumina platforms, though early studies used Sanger sequencing to obtain data from shotgun libraries of metagenomic DNA constructed in bacterial artificial chromosome (BAC) (Beja et al. , Reference Beja, Aravind, Koonin, Suzuki, Hadd, Nguyen, Jovanovich, Gates, Feldman, Spudich, Spudich and Delong2000a, Reference Beja, Suzuki, Koonin, Aravind, Hadd, Nguyen, Villacorta, Amjadi, Garrigues, Jovanovich, Feldman and Delong2000b) or ColE1-type vectors (Venter et al. , Reference Venter, Remington, Heidelberg, Halpern, Rusch, Eisen, Wu, Paulsen, Nelson, Nelson, Fouts, Levy, Knap, Lomas, Nealson, White, Peterson, Hoffman, Parsons, Baden-Tillson, Pfannkoch, Rogers and Smith2004; Tringe and Rubin, Reference Tringe and Rubin2005). A limitation that persists is the quantity (100 ng) of high quality, high molecular weight DNA needed to create a WGS library. In theory, this could be overcome by multi-displacement amplification using an enzyme such as phi29 (Binga et al. , Reference Binga, Lasken and Neufeld2008) if the metagenomic DNA contains little host contamination. This is rarely the case. In HMP samples, the percent of human contamination ranged from about 1% in stool to more than 80% in samples obtained from the saliva, nares, and vagina (Methé et al. , Reference Methé, Nelson, Pop, Creasy, Giglio, Huttenhower, Gevers, Petrosino, Abubucker, Badger, Chinwalla, Earl, Fitzgerald, Fulton, Hallsworth-Pepin, Lobos, Madupu, Magrini, Martin, Mitreva, Muzny, Sodergren, Versalovic, Wollam, Worley, Wortman, Young, Zeng, Aagaard, Allen-Vercoe, Alm, Alvarado, Andersen, Anderson, Appelbaum, Arachchi, Armitage, Arze, Ayvaz, Baker, Begg, Belachew, Bihan, Blaser, Bloom, Bonazzi, Brooks, Buck, Buhay, Busam, Campbell, Canon, Cantarel, Chen, Chhibba, Chu, Ciulla, Clemente, Clifton, Conlan, Crabtree, Cutting, Davidovics, Davis, Desantis, Deal, Delehaunty, Dewhirst, Deych, Dooling, Dugan, Dunne, Durkin, Edgar, Erlich, Farmer, Farrell, Faust, Feldgarden, Felix, Fisher, Fodor, Forney, Foster, Di Francesco, Friedman, Friedrich, Fronick, Fulton, Gao, Garcia, Giannoukos, Giblin, Giovanni, Goldberg, Goll, Gonzalez, Gujja, Haake, Haas, Hamilton, Harris, Hepburn, Herter, Hoffmann, Holder, Huang, Huse, Izard, Jansson, Jiang, Jordan, Joshi, Katancik, Keitel, Kelley, Kells, King, Knight, Knights, Kong, Koren, Kota, Kovar, Kyrpides, Lee, Lemon, Lennon, Lewis, Lewis, Ley, Li, Liolios, Liu, Lozupone, Lunsford, Madden, Mahurkar, Mannon, Mardis, Markowitz, McDonald, McEwen, McGuire, McInnes, Mehta, Mihindukulasuriya, Newsham, Nusbaum, O'Laughlin, Orvis, Pagani, Palaniappan, Patel, Pearson, Peterson, Podar, Pohl, Pollard, Priest, Proctor, Qin, Raes, Reid, Rhodes, Riehle, Rivera, Rodriguez-Mueller, Rogers, La Rosa, Ross, Russ, Sanka, Sankar, Sathirapongsasuti, Schloss, Schloss, Schmidt, Schriml, Schubert, Segata, Segre, Shannon, Sharp, Sharpton, Shenoy, Sheth, Simone, Singh, Smillie, Sobel, Spicer, Sutton, Sykes, Tabbaa, Thiagarajan, Tomlinson, Torralba, Truty, Vishnivetskaya, Walker, Wang, Wang, Ward, Watson, Wellington, Wetterstrand, White, Wilczek-Boney, Wu, Wylie, Wylie, Yandava, Ye, Yooseph, Youmans, Zhang, Zhou, Zhu, Zoloth, Zucker, Birren, Gibbs, Highlander, Weinstock and Wilson2012).
WGS read processing
The first step for processing metagenomic data generated by WGS sequencing is to mask reads corresponding to host sequence. This can be accomplished using a tool such as Best Match Tagger (BMTagger) using a reference genome as input. Fortunately, genomes of many important food production animals are available (Genus species assembly number): Bos taurus UMD_3.1; Bos indicus 1.0; Bubalus bubalis ASM18099v; Sus scrofa 9.2; Ovis aries 1.0; and Gallus gallus 4.0. Unfortunately, however, most of these are low-quality draft sequences, so host masking is likely to be very inefficient. Once host sequences are removed from the WGS data, duplicate reads, which are sequencing artifacts, are removed, low-quality bases are trimmed, then low-quality reads are identified using an aligner such as the Burrows-Wheeler Aligner (Li and Durbin, Reference Li and Durbin2009), and are discarded.
Analysis of WGS data
WGS data can be analyzed as individual processed reads that are mapped to microbial reference genome databases using tools such as MetaPhyler (Liu et al. , Reference Liu, Gibbons, Ghodsi, Treangen and Pop2011) or WebCARMA (Gerlach et al. , Reference Gerlach, Junemann, Tille, Goesmann and Stoye2009). Individual read mapping can also be useful for assessment of abundance of taxa. In addition, reads can be assembled into contigs then annotated. Both the HMP and MetaHIT Consortia used SOAPdenovo (Li et al. , Reference Li, Zhu, Ruan, Qian, Fang, Shi, Li, Li, Shan, Kristiansen, Li, Yang, Wang and Wang2010) for assembly of Illumina microbiome data. Hybrid 454/Illumina assemblies were also generated from HMP sequences using the Newbler assembler (Margulies et al. , Reference Margulies, Egholm, Altman, Attiya, Bader, Bemben, Berka, Braverman, Chen, Chen, Dewell, Du, Fierro, Gomes, Godwin, He, Helgesen, Ho, Irzyk, Jando, Alenquer, Jarvie, Jirage, Kim, Knight, Lanza, Leamon, Lefkowitz, Lei, Li, Lohman, Lu, Makhijani, McDade, McKenna, Myers, Nickerson, Nobile, Plant, Puc, Ronan, Roth, Sarkis, Simons, Simpson, Srinivasan, Tartaro, Tomasz, Vogt, Volkmer, Wang, Wang, Weiner, Yu, Begley and Rothberg2005; Methé et al. , Reference Methé, Nelson, Pop, Creasy, Giglio, Huttenhower, Gevers, Petrosino, Abubucker, Badger, Chinwalla, Earl, Fitzgerald, Fulton, Hallsworth-Pepin, Lobos, Madupu, Magrini, Martin, Mitreva, Muzny, Sodergren, Versalovic, Wollam, Worley, Wortman, Young, Zeng, Aagaard, Allen-Vercoe, Alm, Alvarado, Andersen, Anderson, Appelbaum, Arachchi, Armitage, Arze, Ayvaz, Baker, Begg, Belachew, Bihan, Blaser, Bloom, Bonazzi, Brooks, Buck, Buhay, Busam, Campbell, Canon, Cantarel, Chen, Chhibba, Chu, Ciulla, Clemente, Clifton, Conlan, Crabtree, Cutting, Davidovics, Davis, Desantis, Deal, Delehaunty, Dewhirst, Deych, Dooling, Dugan, Dunne, Durkin, Edgar, Erlich, Farmer, Farrell, Faust, Feldgarden, Felix, Fisher, Fodor, Forney, Foster, Di Francesco, Friedman, Friedrich, Fronick, Fulton, Gao, Garcia, Giannoukos, Giblin, Giovanni, Goldberg, Goll, Gonzalez, Gujja, Haake, Haas, Hamilton, Harris, Hepburn, Herter, Hoffmann, Holder, Huang, Huse, Izard, Jansson, Jiang, Jordan, Joshi, Katancik, Keitel, Kelley, Kells, King, Knight, Knights, Kong, Koren, Kota, Kovar, Kyrpides, Lee, Lemon, Lennon, Lewis, Lewis, Ley, Li, Liolios, Liu, Lozupone, Lunsford, Madden, Mahurkar, Mannon, Mardis, Markowitz, McDonald, McEwen, McGuire, McInnes, Mehta, Mihindukulasuriya, Newsham, Nusbaum, O'Laughlin, Orvis, Pagani, Palaniappan, Patel, Pearson, Peterson, Podar, Pohl, Pollard, Priest, Proctor, Qin, Raes, Reid, Rhodes, Riehle, Rivera, Rodriguez-Mueller, Rogers, La Rosa, Ross, Russ, Sanka, Sankar, Sathirapongsasuti, Schloss, Schloss, Schmidt, Schriml, Schubert, Segata, Segre, Shannon, Sharp, Sharpton, Shenoy, Sheth, Simone, Singh, Smillie, Sobel, Spicer, Sutton, Sykes, Tabbaa, Thiagarajan, Tomlinson, Torralba, Truty, Vishnivetskaya, Walker, Wang, Wang, Ward, Watson, Wellington, Wetterstrand, White, Wilczek-Boney, Wu, Wylie, Wylie, Yandava, Ye, Yooseph, Youmans, Zhang, Zhou, Zhu, Zoloth, Zucker, Birren, Gibbs, Highlander, Weinstock and Wilson2012).
The J. Craig Venter Institute (JCVI) developed a metagenomics analysis pipeline that can be used for annotation of WGS reads or assemblies (Tanenbaum et al. , Reference Tanenbaum, Goll, Murphy, Kumar, Zafar, Thiagarajan, Madupu, Davidsen, Kagan, Kravitz, Rusch and Yooseph2010). The pipeline annotates RNAs (rRNAs, tRNAs, and ncRNAs) and performs ab initio open reading frame (ORF) calling using MetaGeneAnnotator (Noguchi et al. , Reference Noguchi, Taniguchi and Itoh2008). Predicted protein sequences are examined for functional motifs and cellular localization signals using a variety of tools such as PRIAM (Claudel-Renard et al. , Reference Claudel-Renard, Chevalet, Faraut and Kahn2003) for enzyme classification, HMM-Pfam (Bateman et al. , Reference Bateman, Coin, Durbin, Finn, Hollich, Griffiths-Jones, Khanna, Marshall, Moxon, Sonnhammer, Studholme, Yeats and Eddy2004) and TIGRFAM (Haft et al. , Reference Haft, Selengut and White2003) for functional motifs, TMHMM (Sonnhammer et al. , Reference Sonnhammer, Von Heijne and Krogh1998) to identify transmembrane potential domains, and BLAST against JCVI's internal non-redundant nucleotide and protein database, PANDA. The BLAST results from this pipeline can be directly imported into the MEGAN MEtaGenome Analyzer (Mitra et al. , Reference Mitra, Stark and Huson2011), where reads are assigned to the NCBI taxonomy and functional analysis is performed using the SEED (http://www.theseed.org) classification system (Overbeek et al. , Reference Overbeek, Begley, Butler, Choudhuri, Chuang, Cohoon, De Crecy-Lagard, Diaz, Disz, Edwards, Fonstein, Frank, Gerdes, Glass, Goesmann, Hanson, Iwata-Reuyl, Jensen, Jamshidi, Krause, Kubal, Larsen, Linke, McHardy, Meyer, Neuweger, Olsen, Olson, Osterman, Portnoy, Pusch, Rodionov, Ruckert, Steiner, Stevens, Thiele, Vassieva, Ye, Zagnitko and Vonstein2005). MEGAN also uses the Kyoto Encyclopedia of Genes and Genomes (KEGG, www.kegg.jp) (Kanehisa and Goto, Reference Kanehisa and Goto2000) to construct metabolic pathways from metagenome sequences.
Another established online resource is the Metagenomics Analysis Server (MG-RAST; metagenomics.anl.gov) (Meyer et al. , Reference Meyer, Paarmann, D'souza, Olson, Glass, Kubal, Paczian, Rodriguez, Stevens, Wilke, Wilkening and Edwards2008), which is also associated with the SEED. MG-RAST annotates, calculates taxonomic distribution of species, rank abundances, and alpha diversity and bins ORFs into functional categories and subsystems. It includes tools to compare and visualize data from preloaded or user uploaded data. MG-RAST can export species and functional category abundance profiles that are compatible as input for QIIME.
Finally, the Joint Genome Institute (JGI) Integrated Microbial Genomes with Metagenome Samples system (IMG/M; img.jgi.doe.gov) (Markowitz et al. , Reference Markowitz, Chen, Chu, Szeto, Palaniappan, Grechkin, Ratner, Jacob, Pati, Huntemann, Liolios, Pagani, Anderson, Mavromatis, Ivanova and Kyrpides2012) also provides tools for functional analysis of microbial communities. A key feature of IMG/M is integration with microbial genomes, finished and draft, in the JGI integrated microbial genome (IMG) system (Markowitz et al. , Reference Markowitz, Chen, Palaniappan, Chu, Szeto, Grechkin, Ratner, Anderson, Lykidis, Mavromatis, Ivanova and Kyrpides2010). One of the early and continuing goals of the HMP has been population of the NCBI genome database (and thus the IMG) with human microbial reference genome sequences to serve as a ‘catalog’ for classification of human microbial metagenomic sequences (Nelson et al. , Reference Nelson, Weinstock, Highlander, Worley, Creasy, Wortman, Rusch, Mitreva, Sodergren, Chinwalla, Feldgarden, Gevers, Haas, Madupu, Ward, Birren, Gibbs, Methe, Petrosino, Strausberg, Sutton, White, Wilson, Durkin, Giglio, Gujja, Howarth, Kodira, Kyrpides, Mehta, Muzny, Pearson, Pepin, Pati, Qin, Yandava, Zeng, Zhang, Berlin, Chen, Hepburn, Johnson, McCorrison, Miller, Minx, Nusbaum, Russ, Sykes, Tomlinson, Young, Warren, Badger, Crabtree, Markowitz, Orvis, Cree, Ferriera, Fulton, Fulton, Gillis, Hemphill, Joshi, Kovar, Torralba, Wetterstrand, Abouellleil, Wollam, Buhay, Ding, Dugan, FitzGerald, Holder, Hostetler, Clifton, Allen-Vercoe, Earl, Farmer, Liolios, Surette, Xu, Pohl, Wilczek-Boney and Zhu2010). To date, about 800 HMP genomes have been deposited and are available from NCBI. The HMP goal is to complete 3000 draft microbial genomes by the end of 2013. Only 26% of the total of 46% of mappable WGS reads from 681 human subjects aligned to these reference genomes (Methé et al. , Reference Methé, Nelson, Pop, Creasy, Giglio, Huttenhower, Gevers, Petrosino, Abubucker, Badger, Chinwalla, Earl, Fitzgerald, Fulton, Hallsworth-Pepin, Lobos, Madupu, Magrini, Martin, Mitreva, Muzny, Sodergren, Versalovic, Wollam, Worley, Wortman, Young, Zeng, Aagaard, Allen-Vercoe, Alm, Alvarado, Andersen, Anderson, Appelbaum, Arachchi, Armitage, Arze, Ayvaz, Baker, Begg, Belachew, Bihan, Blaser, Bloom, Bonazzi, Brooks, Buck, Buhay, Busam, Campbell, Canon, Cantarel, Chen, Chhibba, Chu, Ciulla, Clemente, Clifton, Conlan, Crabtree, Cutting, Davidovics, Davis, Desantis, Deal, Delehaunty, Dewhirst, Deych, Dooling, Dugan, Dunne, Durkin, Edgar, Erlich, Farmer, Farrell, Faust, Feldgarden, Felix, Fisher, Fodor, Forney, Foster, Di Francesco, Friedman, Friedrich, Fronick, Fulton, Gao, Garcia, Giannoukos, Giblin, Giovanni, Goldberg, Goll, Gonzalez, Gujja, Haake, Haas, Hamilton, Harris, Hepburn, Herter, Hoffmann, Holder, Huang, Huse, Izard, Jansson, Jiang, Jordan, Joshi, Katancik, Keitel, Kelley, Kells, King, Knight, Knights, Kong, Koren, Kota, Kovar, Kyrpides, Lee, Lemon, Lennon, Lewis, Lewis, Ley, Li, Liolios, Liu, Lozupone, Lunsford, Madden, Mahurkar, Mannon, Mardis, Markowitz, McDonald, McEwen, McGuire, McInnes, Mehta, Mihindukulasuriya, Newsham, Nusbaum, O'Laughlin, Orvis, Pagani, Palaniappan, Patel, Pearson, Peterson, Podar, Pohl, Pollard, Priest, Proctor, Qin, Raes, Reid, Rhodes, Riehle, Rivera, Rodriguez-Mueller, Rogers, La Rosa, Ross, Russ, Sanka, Sankar, Sathirapongsasuti, Schloss, Schloss, Schmidt, Schriml, Schubert, Segata, Segre, Shannon, Sharp, Sharpton, Shenoy, Sheth, Simone, Singh, Smillie, Sobel, Spicer, Sutton, Sykes, Tabbaa, Thiagarajan, Tomlinson, Torralba, Truty, Vishnivetskaya, Walker, Wang, Wang, Ward, Watson, Wellington, Wetterstrand, White, Wilczek-Boney, Wu, Wylie, Wylie, Yandava, Ye, Yooseph, Youmans, Zhang, Zhou, Zhu, Zoloth, Zucker, Birren, Gibbs, Highlander, Weinstock and Wilson2012), underscoring the need for a broad and relevant database of microbial reference genomes for metagenomics studies. For animals of agricultural interest, a microbial reference genome resource is lacking. As such, data interpretation is limited to what can be gleaned from human microbial genomes. Many of these will be useful proxies, but many will not.
Conclusion/Perspective
Based on the extensive analysis performed by the HMP community, the recommendation in 2012 for microbial community profiling would be a multiplexed 454 amplicon sequencing approach targeting either the V1–V3 or V3–V5 16S rDNA regions followed by robust read trimming and chimera detection and removal. If sample DNA quantity is not limiting and host contamination is not expected to be substantial, then paired-end WGS sequencing on the Illumina platform is an attractive strategy that can provide additional taxonomic and functional predictions. For example, if stool is the sample of choice, then host contamination should be of minimal concern. On the other hand, if other body sites or tissues are to be studied, then the availability and quality of the host genomic sequence will be of paramount importance since host contamination of metagenomic reads will be significant. Another encumbrance is the lack of suitable microbial reference genomes for WGS read mapping. These problems may restrict food animal microbiome studies to 16S rDNA or other PCR-based gene surveys.
Although not discussed here, a critical component of all microbiome/metagenomic projects is proper attention to study design. Power calculations, using effect size to predict sample size, consideration of case-matched controls, appropriate sample handling, and care to prevent environmental DNA contamination are some of the lessons learned from the HMP. The HMP results also indicate that sample sequencing depth, both for 16S rDNA and WGS methods was more than adequate for the community comparisons made, but despite the exponential expansion of the human-related microbial reference genome sequences at NCBI, the reference catalog is far from saturated. Future projects, especially those involving food production animals and other lesser studied vertebrates will benefit from improved host genome sequences, new technologies to separate host from microbial DNA, and efforts to include commensal microbes of agriculturally important animals in reference genome sequencing initiatives.