

Introduction
Carcinoma ex pleomorphic adenoma is a rare malignant salivary gland neoplasm arising from malignant transformation of a pre-existing pleomorphic adenoma.Reference Antony, Gopalan, Smith and Lam1 As carcinoma ex pleomorphic adenoma is typically considered a high grade tumour, counselling patients regarding the decision between surveillance and excision of the benign pleomorphic adenoma is guided by the risk of malignant transformation during a patient’s lifetime. Based upon current guidelines, pre-operative imaging is a key step in the evaluation of salivary gland tumours.Reference Geiger, Ismaila, Beadle, Caudell, Chau and Deschler2 Imaging modalities used in characterising salivary gland tumours include ultrasound, computed tomography (CT) and magnetic resonance imaging (MRI).Reference Angang, Jia, Xia, Ping and Jiang3–Reference Wada, Yokota, Horikoshi, Starkey, Hattori and Hashiba7
Magnetic resonance imaging is particularly useful as it allows identification of perineural involvement and features such as size and margin definition, which are known to portend malignancy in salivary gland tumours.Reference Katayama, Eida, Fujita, Hotokezaka, Sumi and Nakamura6, Reference Cho, Lee, Choi, Lee, Choi and Nam8 There is contemporary interest in MRI features because it has been suggested that assessment of apparent diffusion coefficient on MRI may be useful in predicting mortality for salivary gland tumours, including carcinoma ex pleomorphic adenoma;Reference Sumi and Nakamura9 and in differentiating benign from malignant tumours.Reference Wang, Yu, Li, Sun, Zhu and Wang5, Reference Sumi and Nakamura9, Reference Tanaka, Umino, Maeda, Nakayama, Inoue and Kogue10 Furthermore, MRI features predicting perineural invasion pre-operatively is of clinical interest because it guides prognosis, pre-operative discussion and treatment decision-making. In addition, MRI features assist with planning for adjuvant therapies such as radiotherapy.Reference Pfister11 Ultrasound is another imaging modality with utility in predicting malignancy using features such as irregularity, poorly defined borders and poor enhancement of posterior echo.Reference Angang, Jia, Xia, Ping and Jiang3 Additionally, contemporary studies have begun utilising emerging technologies such as radiomic analysis to further predict the risk of malignancy, and by doing so, stratify the need for surgery.Reference Zhang, Ai, Wong, Green, Qamar and So4
Due to the rarity of carcinoma ex pleomorphic adenoma, there is limited high-level evidence to guide its diagnosis and pre-operative decision-making. This systematic review aims to identify the radiological features that may pre-operatively predict for carcinoma ex pleomorphic adenoma and its degree of invasion using ultrasound, CT and MRI. The hypothesis under investigation is: in salivary gland tumours, do radiological features on ultrasound, CT and MRI predict carcinoma ex pleomorphic adenoma?
Materials and methods
This systematic review was registered prospectively on PROSPERO (CRD42023421449). This protocol was written in accordance with the Preferred Reporting Items for Systematic Review and Meta-Analyses ‘PRISMA’-P protocol for systematic reviews.
A systematic search of MeSH-indexed phrases relating to ‘carcinoma ex pleomorphic adenoma,’ ‘radiology,’ ‘magnetic resonance imaging,’ ‘computed tomography,’ and ‘ultrasound’ was performed from database inception to 29 April 2023 (Supplement 1). Peer-reviewed literature was searched for via Ovid Medline, Embase, Scopus, Web of Science (BIOSIS), Cochrane CENTRAL, and the Cochrane database of systematic reviews. To include emerging radiological modalities, grey literature including conference proceedings were searched for via Embase, SCOPUS, Web of Science (BIOSIS), OpenDOAR, and GreyNet International (OpenGrey). Systematic review databases including PROSPERO and Cochrane Library were searched for existing reviews. Reference lists of included articles were checked to identify further articles for screening. Database search was limited to ‘humans’ and ‘English.’
One author (SK) screened all abstracts for full-text review. Papers selected for full-text screening subsequently underwent data extraction on a pre-determined spreadsheet by two independent reviewers (SK, ZH). A third reviewer (PS) was consulted to resolve discrepancies. The systematic review management software, Covidence,12 was used for review management.
Papers that met all of the inclusion criteria and none of the exclusion criteria were included in the data analysis. PIOs (patient/population, intervention, comparison, outcomes) for this study were: (P) confirmed histological diagnosis of carcinoma ex pleomorphic adenoma in the major or minor salivary glands; (I) magnetic resonance imaging, computed tomography, ultrasound; (O) radiological features unique to each modality predicting carcinoma ex pleomorphic adenoma. We focussed on three radiological modalities and outcomes: (1) ultrasound: irregular shape, ill-defined borders, and posterior echo enhancement; (2) CT: attenuation and enhancement; and (3) MRI: signal, enhancement, and apparent diffusion coefficient.
Study types for inclusion were randomised, controlled trials (RCTs), cohort studies, case-control studies, cross-sectional studies from cancer databases and case reports with three or more patients. Exclusion criteria were insufficiently discrete data from other salivary gland cancers, no pre-operative radiological data and non-humans.
Clinicopathological features such as patient age, sex, invasiveness, and primary salivary gland of interest were collected. Additional pathognomonic radiological features highlighted in the included studies were collected for further discussion. Where available, prognostic information for follow-up duration, mortality and recurrence rates were collected.
Descriptive statistics were used to synthesise aggregate data for clinical and radiological features, and the Shapiro–Wilk test was used to test normal distribution. Subgroup analysis was performed for non-invasive and minimally invasive carcinoma ex pleomorphic adenoma against frankly invasive carcinoma ex pleomorphic adenoma.
Risk-of-bias assessment was performed by two independent reviewers (SK, ML), and a third reviewer (PS) was available to resolve any discrepancies. For prognostic and prediction studies, the Quality in Prognostic Studies tool was used.Reference Hayden, van der Windt, Cartwright, Côté and Bombardier13 The Centre for Evidence-based Medicine levels of evidence were collected for each included article.14
Results and analysis
Of 1729 unique studies, 127 studies underwent full-text screening, 12 of which (n = 426 patients) met criteria for independent data extraction. There were seven cohort studies,Reference Angang, Jia, Xia, Ping and Jiang3, Reference Wang, Yu, Li, Sun, Zhu and Wang5, Reference Sumi and Nakamura9, Reference Abdel Razek, Elkhamary and Nada15–Reference Kashiwagi, Murakami, Chikugo, Tomita, Kawano and Nakanishi18 four case-control studiesReference Katayama, Eida, Fujita, Hotokezaka, Sumi and Nakamura6, Reference Wada, Yokota, Horikoshi, Starkey, Hattori and Hashiba7, Reference Li, Lu, Zhang, Lai, Zhang and Ni19, Reference Seok, Hyun, Jeong, Ahn, Kim and Jung20 and one case seriesReference Kato, Kanematsu, Mizuta, Ito and Hirose21 (Figure 1). There was high inter-rater agreement between study authors for studies identified for inclusion into the study.
PRISMA flow chart for included and excluded studies. CXPA = carcinoma ex pleomorphic adenoma.

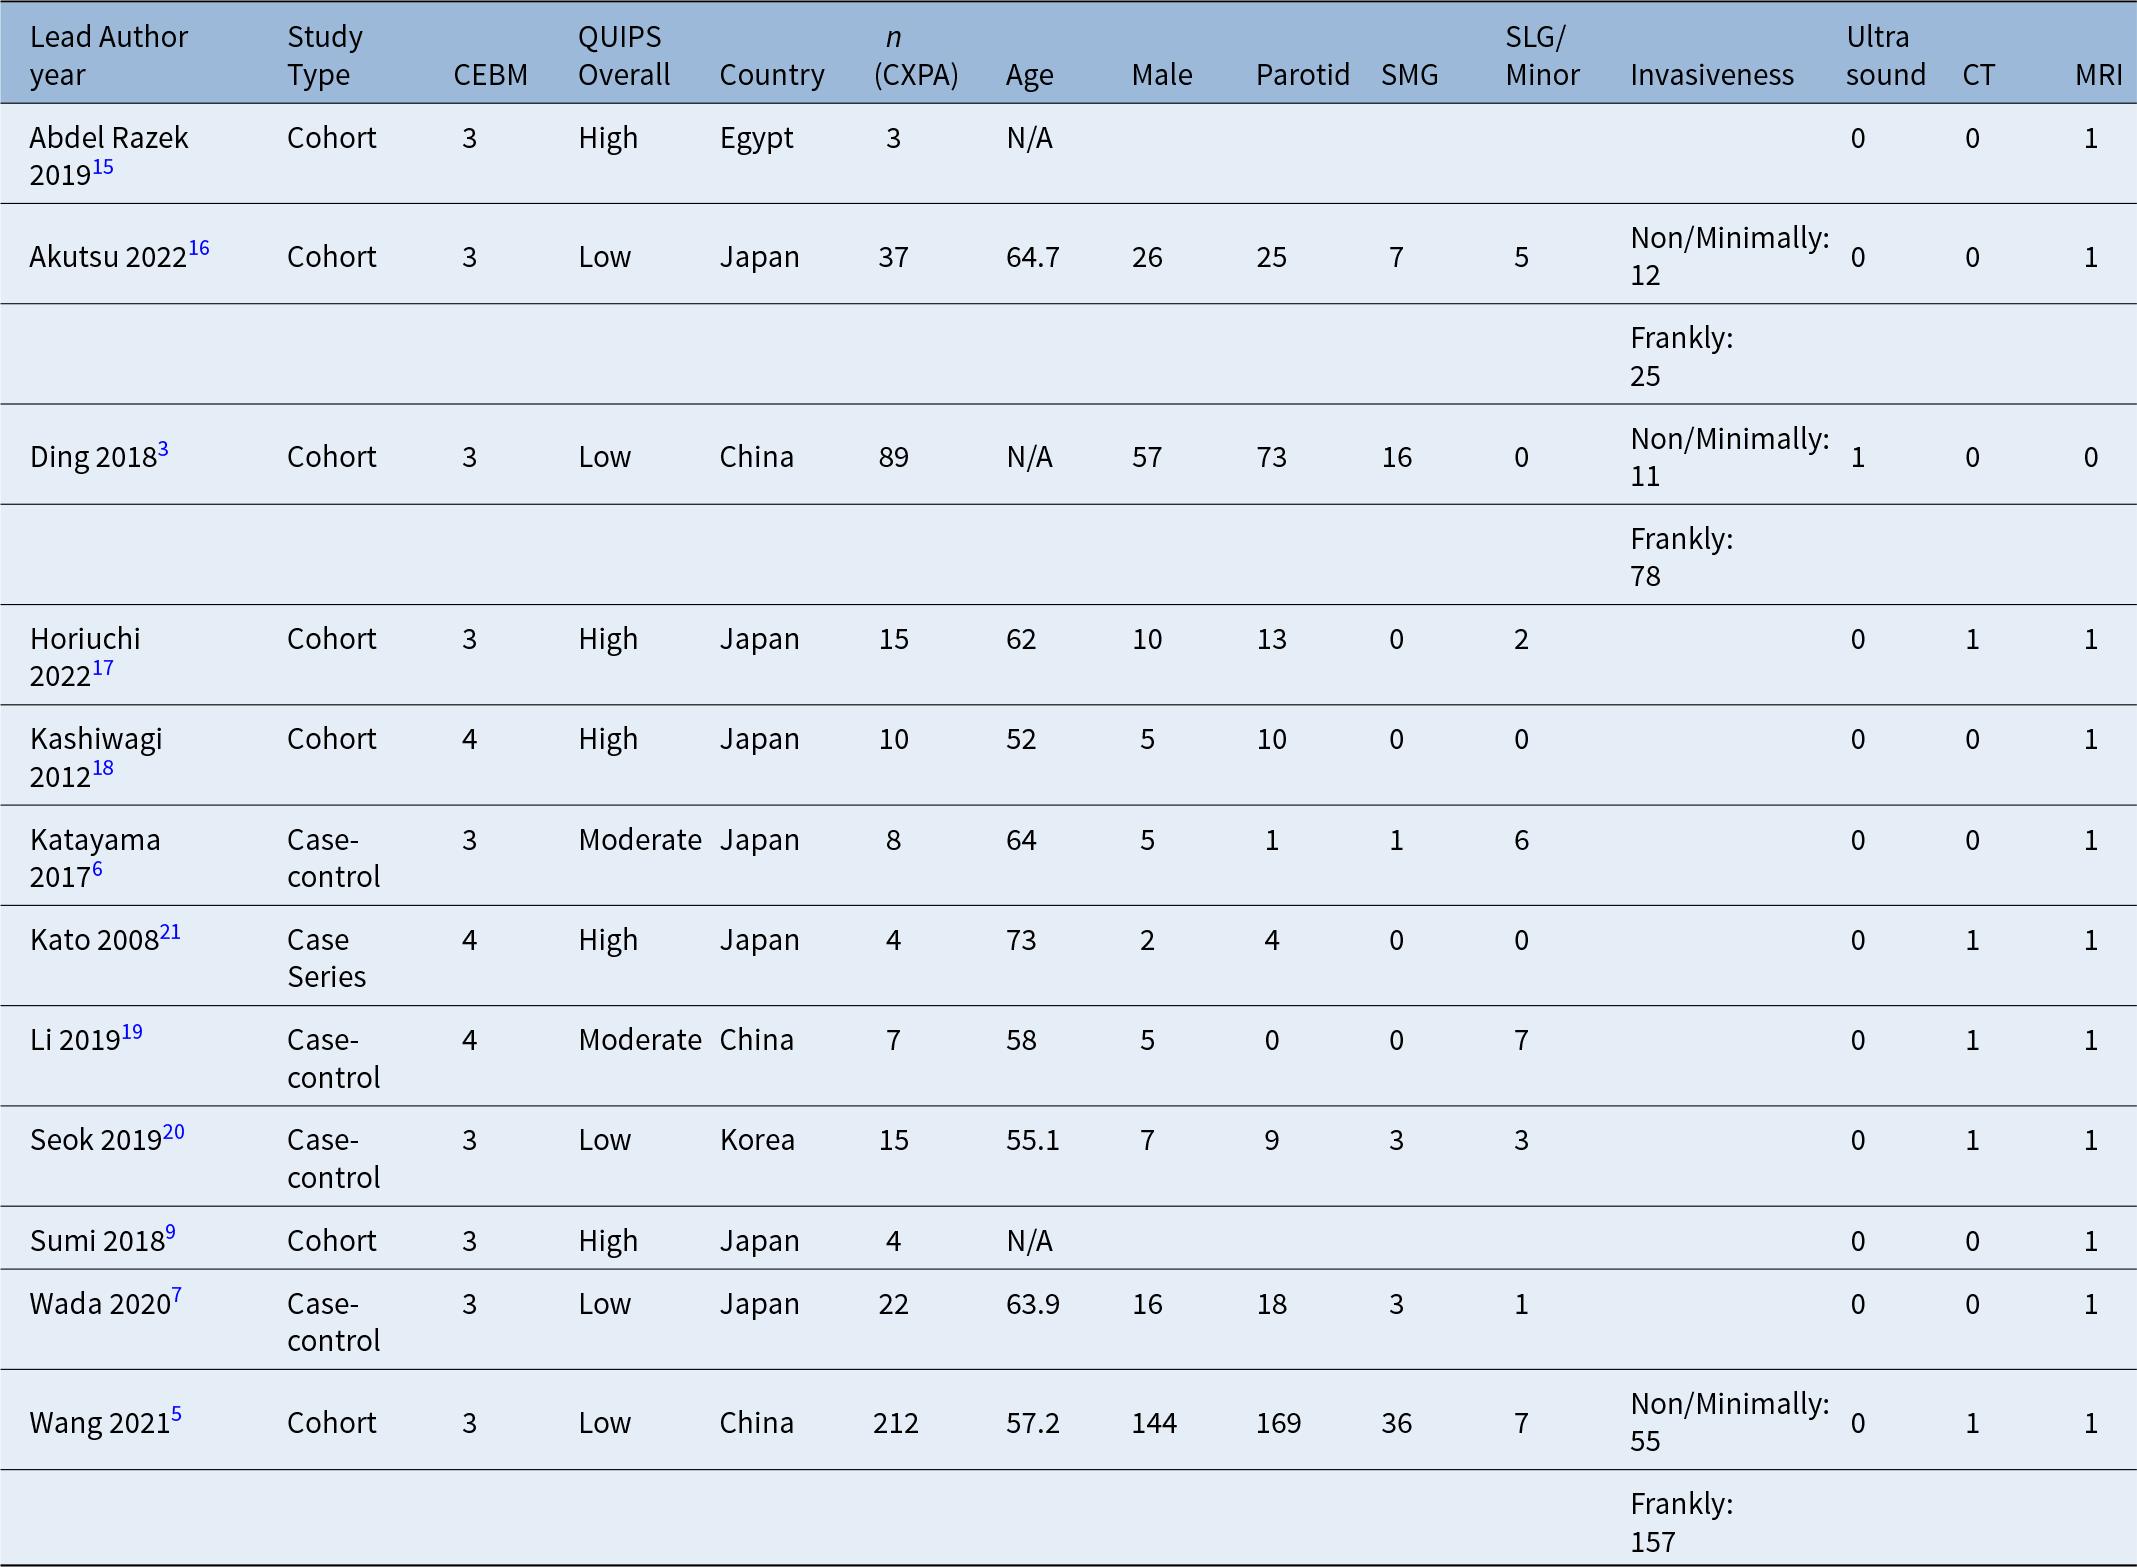
Demographic data indicated median age was 62 years (n = 330 patients), and 54.18 per cent were male (n = 227/419). In 419 patients, the most common primary subsite was in the parotid gland (76.85 per cent, n = 322/419), followed by submandibular gland (15.75 per cent, n = 66/419) and minor salivary glands (7.40 per cent, n = 31/419), respectively. In studies reporting invasiveness, most tumours were frankly invasive (76.92 per cent, n = 260/338), compared to non-invasive or minimally invasive (23.08 per cent, n = 78/338). Clinical evidence of perineural invasion was reported in 14.08 per cent (n = 10/71) of patients. Tumour–node–metastasis staging and previous pleomorphic adenoma history was not well reported. Limited prognostic data were reported. Recurrent disease was reported in 19.23 per cent of patients (n = 5/26). Median follow-up duration for carcinoma ex pleomorphic adenoma was poorly reported (Table 1).
Study characteristics; CEBM = Centre for Evidence-based Medicine;14 CT = computed tomography; CXPA = carcinoma ex pleomorphic adenoma; MRI = magnetic resonance imaging; QUIPS = Quality in Prognostic Studies;Reference Hayden, van der Windt, Cartwright, Côté and Bombardier13 SLG = sublingual; SMG = submandibular gland; N/A = not applicable

Magnetic resonance imaging (MRI)
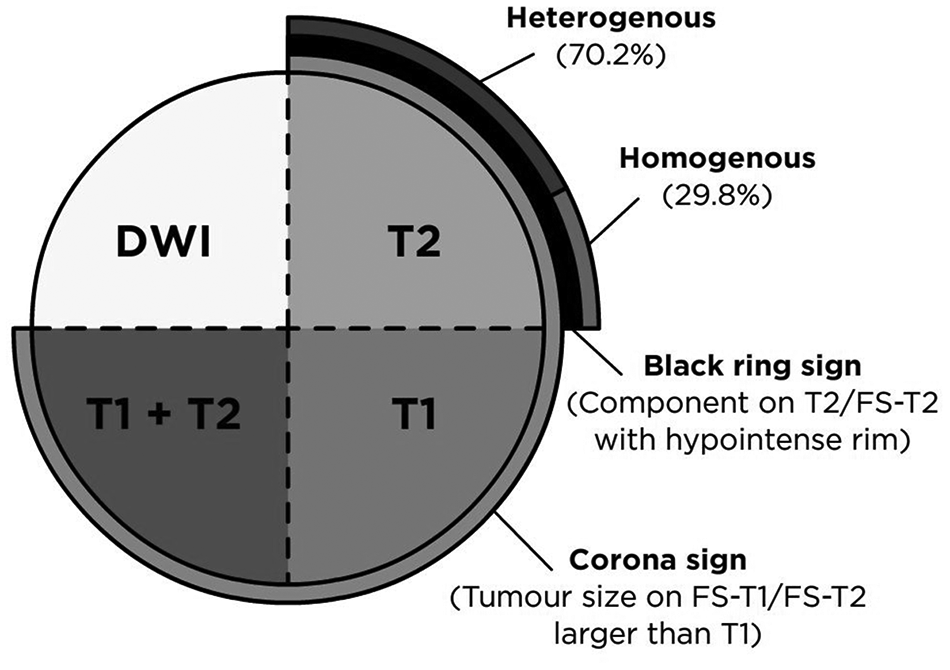
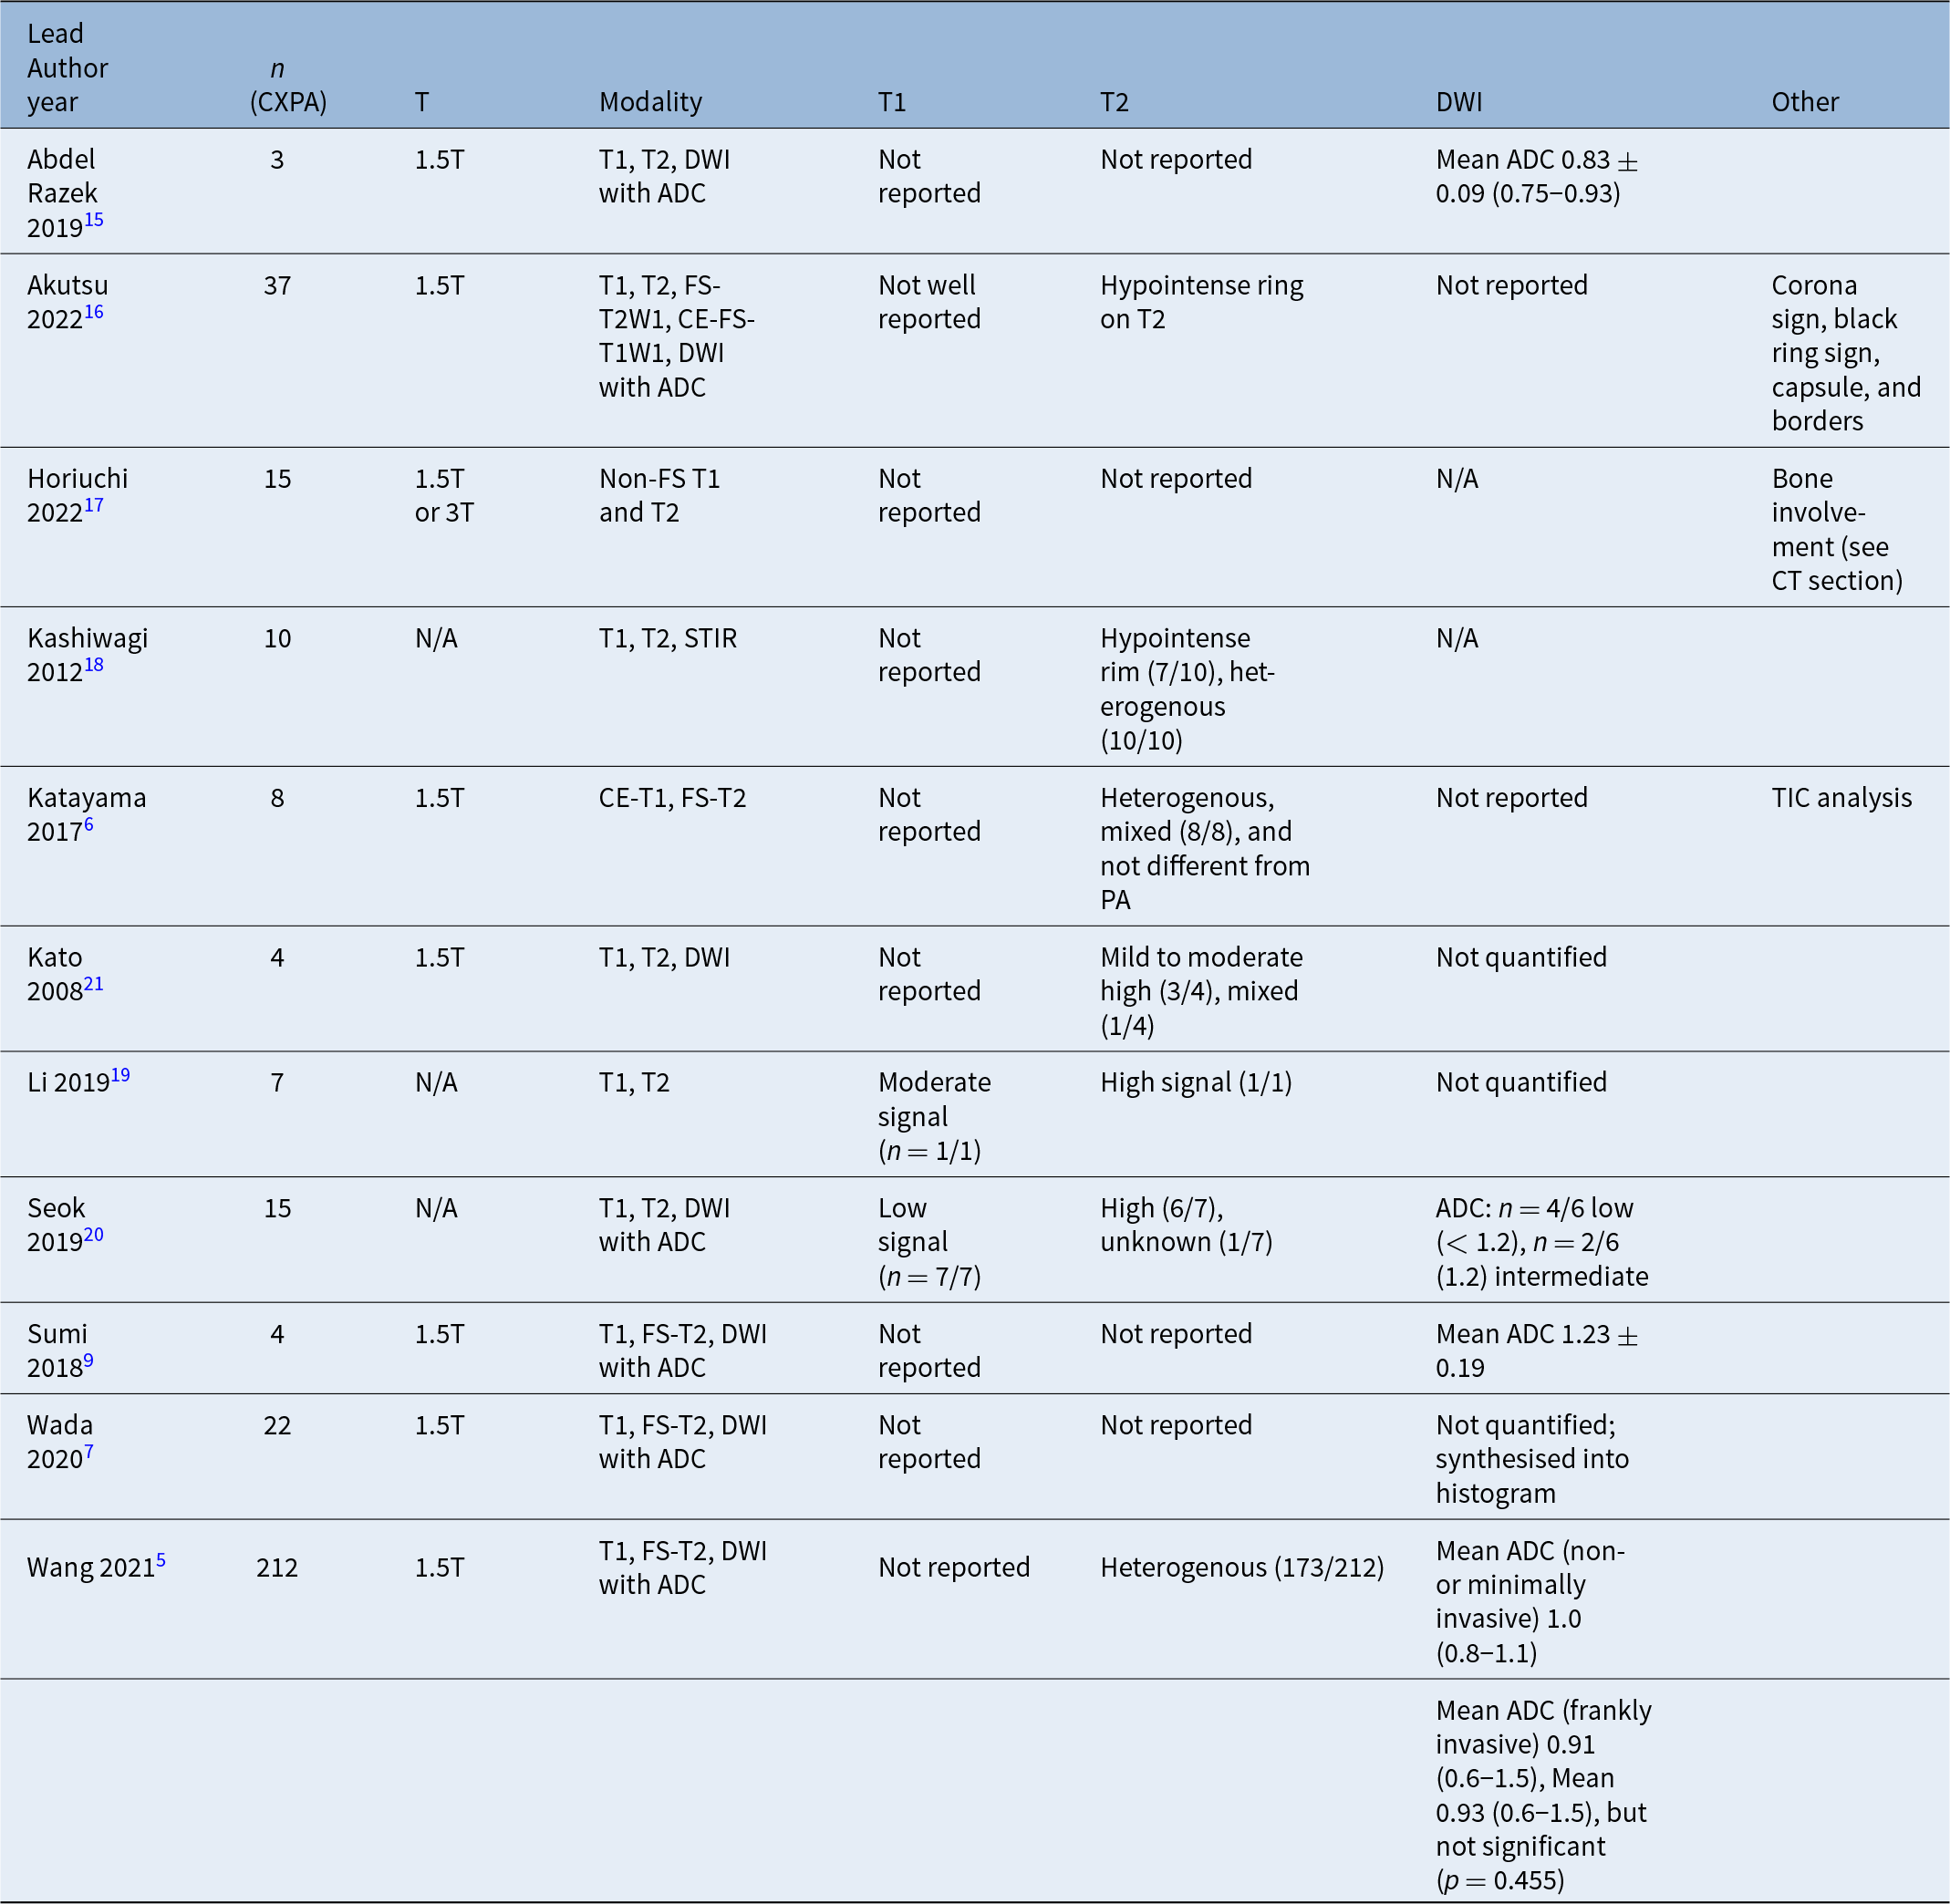
Eleven studies (n = 337 patients) reported on MRI in carcinoma ex pleomorphic adenoma (Table 2).Reference Wang, Yu, Li, Sun, Zhu and Wang5–Reference Wada, Yokota, Horikoshi, Starkey, Hattori and Hashiba7, Reference Sumi and Nakamura9, Reference Abdel Razek, Elkhamary and Nada15–Reference Kato, Kanematsu, Mizuta, Ito and Hirose21 Seven studies reported using 1.5T MRI,Reference Wang, Yu, Li, Sun, Zhu and Wang5–Reference Wada, Yokota, Horikoshi, Starkey, Hattori and Hashiba7, Reference Sumi and Nakamura9, Reference Abdel Razek, Elkhamary and Nada15, Reference Akutsu, Horikoshi, Yokota, Wada, Motoori and Nasu16, Reference Kato, Kanematsu, Mizuta, Ito and Hirose21and one study used both 1.5T and 3T MRI;Reference Horiuchi, Shimono, Tatekawa, Tsukamoto, Takita and Okazaki17 it was unclear which type of MRI was used for three studies.Reference Kashiwagi, Murakami, Chikugo, Tomita, Kawano and Nakanishi18–Reference Seok, Hyun, Jeong, Ahn, Kim and Jung20 A graphical depiction of major MRI findings is included in (Figure 2). Most studies described T2, and apparent diffusion coefficient characteristics for carcinoma ex pleomorphic adenoma, wherein carcinoma ex pleomorphic adenoma typically demonstrated T2 heterogenous or high intensity, and lower mean apparent diffusion coefficient values on diffusion-weighted imaging compared to benign tumours.
Graphical depiction of major MRI findings; FS-T1 = fat-suppressed T1; FS-T2 = fat-suppressed T2.

MRI features of carcinoma ex pleomorphic adenoma; ADC = apparent diffusion coefficient; CE-FS-T1W1 = contrast-enhanced, fat-suppressed T1-weighted imaging; CT = computed tomography; CXPA = Carcinoma ex pleomorphic adenoma; DWI = diffusion-weighted imaging; FS-T1W1 = fat-suppressed T1-weighted imaging; FS-T2W1 = fat-suppressed T2-weighted imaging; PA = pleomorphic adenoma; STIR = short tau inversion recovery; TIC = time-intensity curve

Six studies performed apparent diffusion coefficient calculations on diffusion-weighted imaging,Reference Wang, Yu, Li, Sun, Zhu and Wang5, Reference Wada, Yokota, Horikoshi, Starkey, Hattori and Hashiba7, Reference Sumi and Nakamura9, Reference Abdel Razek, Elkhamary and Nada15, Reference Seok, Hyun, Jeong, Ahn, Kim and Jung20, Reference Kato, Kanematsu, Mizuta, Ito and Hirose21 in which four quantified apparent diffusion coefficient values. In two studies that provided pooled apparent diffusion coefficient values, mean apparent diffusion coefficient was 0.83×10⁻³mm2/s (SD 0.09),Reference Abdel Razek, Elkhamary and Nada15 and 1.2310–3mm2/s (SD 0.19),Reference Sumi and Nakamura9 respectively. In a study of six patients with carcinoma ex pleomorphic adenoma, Seok et al. reported four of six patients had low apparent diffusion coefficient values (< 1.2 × 10⁻³mm2/s), whilst two had medium apparent diffusion coefficient values (1.2 × 10⁻³mm2/s).Reference Seok, Hyun, Jeong, Ahn, Kim and Jung20 In Wang et al.’s study of 212 patients with carcinoma ex pleomorphic adenoma, apparent diffusion coefficient values were available for 22 patients. Mean apparent diffusion coefficient (1.0 × 10⁻³mm2/s and 0.91 × 10⁻³mm2/s) for five non-invasive and minimally invasive carcinoma ex pleomorphic adenoma was 1.0 (range 0.8 to 1.1), and 17 frankly invasive carcinoma ex pleomorphic adenoma was 0.91 (0.6–1.5). The mean apparent diffusion coefficient was 0.93 (range 0.6–1.5), but this was not statistically significant between levels of invasiveness (p = 0.455).Reference Wang, Yu, Li, Sun, Zhu and Wang5 Additionally, in a case-control study of 22 carcinoma ex pleomorphic adenoma and 115 pleomorphic adenoma patients, Wada et al.Reference Wada, Yokota, Horikoshi, Starkey, Hattori and Hashiba7 synthesised mean apparent diffusion coefficient values into a histogram utilising machine-learning techniques. This was used to produce a radiomics-based model and compare it against a one-point apparent diffusion coefficient measurement, suggesting the former can overcome lower levels of operator experience.Reference Wada, Yokota, Horikoshi, Starkey, Hattori and Hashiba7 Kato et al.Reference Kato, Kanematsu, Mizuta, Ito and Hirose21 related radiology features of carcinoma ex pleomorphic adenoma to their histopathological benign and malignant components. In three of the patients, apparent diffusion coefficient values for the carcinoma ex pleomorphic adenoma component was higher than the surrounding benign component, although the exact apparent diffusion coefficient value was not specified. These carcinoma ex pleomorphic adenoma components demonstrated T2 mild to moderate hyperintensity.Reference Kato, Kanematsu, Mizuta, Ito and Hirose21
Of 11 studies examining MRI, seven studies reported on T2 characteristics.Reference Wang, Yu, Li, Sun, Zhu and Wang5, Reference Katayama, Eida, Fujita, Hotokezaka, Sumi and Nakamura6, Reference Akutsu, Horikoshi, Yokota, Wada, Motoori and Nasu16, Reference Kashiwagi, Murakami, Chikugo, Tomita, Kawano and Nakanishi18–Reference Kato, Kanematsu, Mizuta, Ito and Hirose21 In the 272 patients from these studies, most (70.22 per cent, n = 191/272) reported heterogenous findings.Reference Wang, Yu, Li, Sun, Zhu and Wang5, Reference Katayama, Eida, Fujita, Hotokezaka, Sumi and Nakamura6, Reference Kashiwagi, Murakami, Chikugo, Tomita, Kawano and Nakanishi18–Reference Kato, Kanematsu, Mizuta, Ito and Hirose21 In the remaining 29.78 per cent (n = 81/272), 10 patients reported an association between high T2 intensity and carcinoma ex pleomorphic adenoma.Reference Wang, Yu, Li, Sun, Zhu and Wang5, Reference Li, Lu, Zhang, Lai, Zhang and Ni19–Reference Kato, Kanematsu, Mizuta, Ito and Hirose21 The T2 signals of the remaining patients were unknown. Other T2 findings of note were a hypointense rim in 7 of 10 carcinoma ex pleomorphic adenoma patients.Reference Kashiwagi, Murakami, Chikugo, Tomita, Kawano and Nakanishi18
In the two studies with eight patients reporting T1,Reference Li, Lu, Zhang, Lai, Zhang and Ni19, Reference Seok, Hyun, Jeong, Ahn, Kim and Jung20 there was no unified consensus. One study with one patient reported moderate T1 intensity,Reference Li, Lu, Zhang, Lai, Zhang and Ni19 and one study with seven patients exhibited low T1 intensity.Reference Seok, Hyun, Jeong, Ahn, Kim and Jung20
Alternative imaging modalities such as short tau inversion recovery imaging were examined by Kashiwagi et al. in 10 carcinoma ex pleomorphic adenoma patients.Reference Kashiwagi, Murakami, Chikugo, Tomita, Kawano and Nakanishi18 This identified specific radiological features that differentiated invasive and non-invasive carcinoma ex pleomorphic adenoma, which were further explored by Akutsu et al.,Reference Akutsu, Horikoshi, Yokota, Wada, Motoori and Nasu16 namely the black ring and corona signs. Invasive carcinoma ex pleomorphic adenoma was more likely to demonstrate a ‘corona’ sign, increased tumour size on FS-T2Q1 and/or CE-FS-T1W1 compared to T1W1, reaching statistical significance (odds ratio 14.40, p = 0.001 and odds ratio 9.31, p = 0.007). The black ring sign, a hypointense ring thicker than the benign pleomorphic adenoma capsule, was also statistically more likely to be present in invasive carcinoma ex pleomorphic adenoma (odds ratio 13.11, p = 0.011). In this same study, invasive carcinoma ex pleomorphic adenoma was more likely to have ill-defined borders (odds ratio 14.41, p = 0.002) and no capsule (odds ratio 38.18, p < 0.001).Reference Akutsu, Horikoshi, Yokota, Wada, Motoori and Nasu16 Another method of assessing tumours on MRI is the time-intensity curve, based on enhancement ratio, maximum time and washout ratio, which was performed on eight carcinoma ex pleomorphic adenoma patients and 20 pleomorphic adenoma patients. Although there was no statistical difference in time-intensity curve types between carcinoma ex pleomorphic adenoma and pleomorphic adenoma, time-intensity curve with rapid uptake and a low washout ratio was more likely to diagnose carcinoma ex pleomorphic adenoma.Reference Katayama, Eida, Fujita, Hotokezaka, Sumi and Nakamura6
Computed tomography (CT)
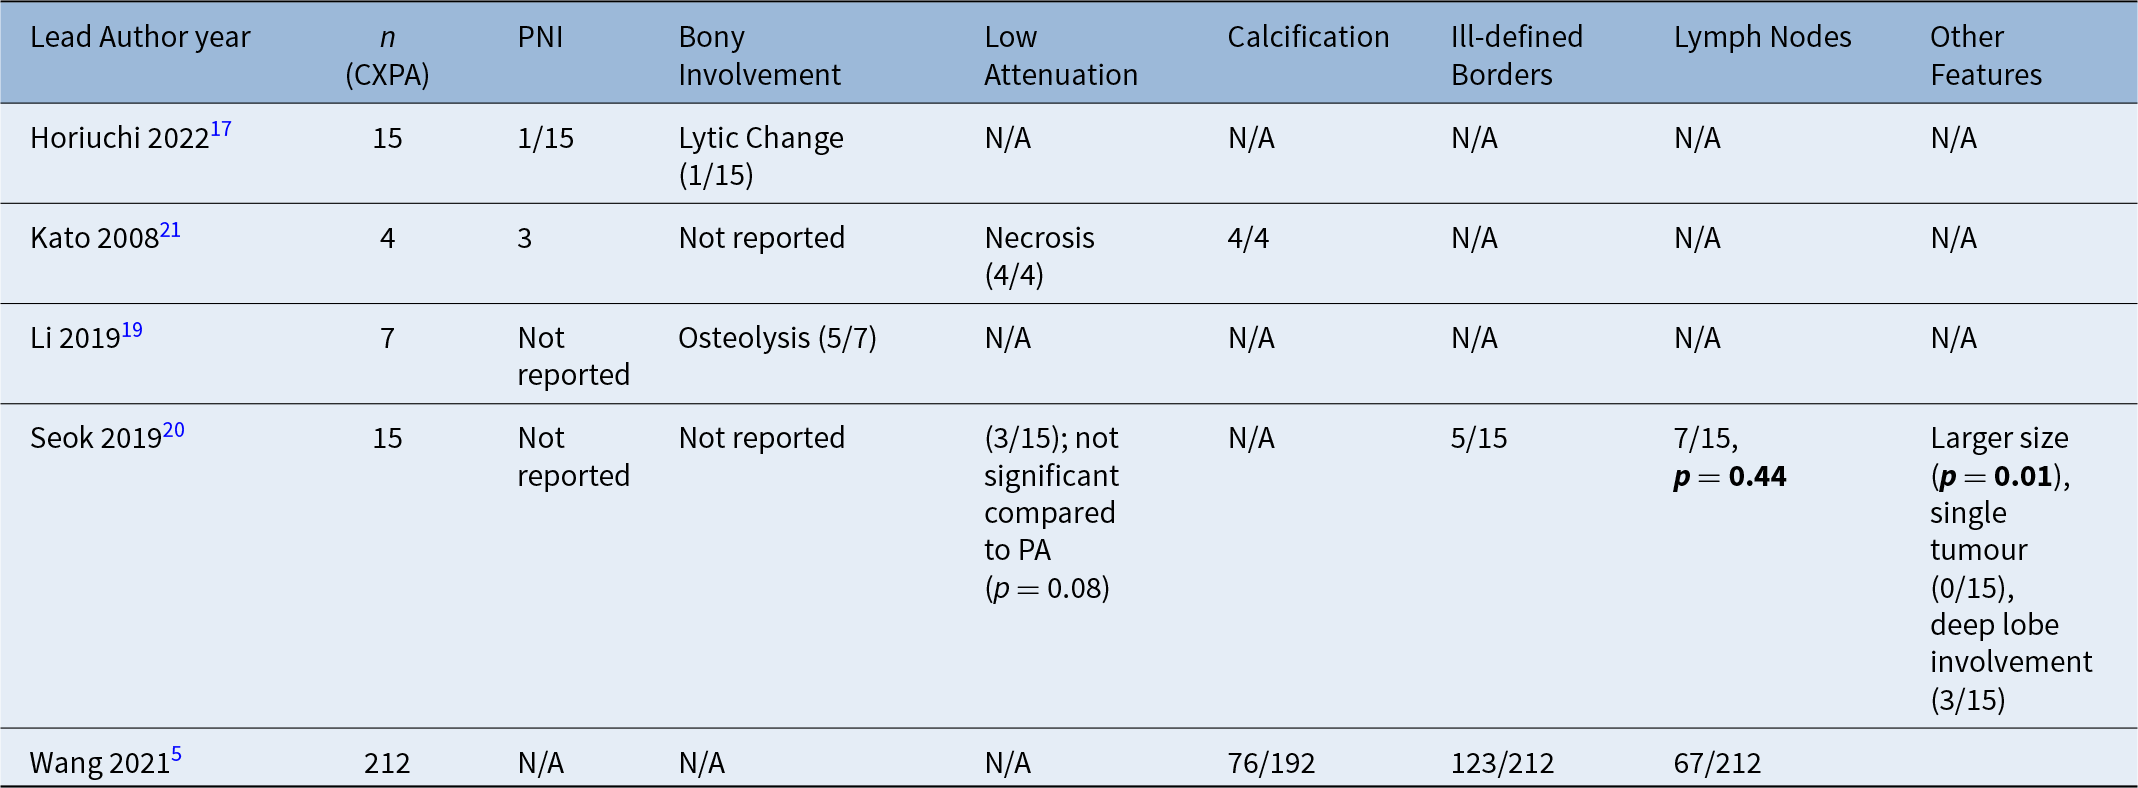
Five studies (n = 253 patients) reported on pre-operative CT findings in carcinoma ex pleomorphic adenomaReference Wang, Yu, Li, Sun, Zhu and Wang5, Reference Horiuchi, Shimono, Tatekawa, Tsukamoto, Takita and Okazaki17, Reference Li, Lu, Zhang, Lai, Zhang and Ni19–Reference Kato, Kanematsu, Mizuta, Ito and Hirose21 (Table 3). All studies correlated MRI findings to CT findings, and both non-contrast and contrast-enhanced CT were used. Computed tomography was used as an additional imaging modality to supplement MRI findings, identifying specific characteristics of interest, such as bony involvement. Incidence of commonly reported findings were bony involvement (n = 6/22, 27.3 per cent),Reference Horiuchi, Shimono, Tatekawa, Tsukamoto, Takita and Okazaki17, Reference Li, Lu, Zhang, Lai, Zhang and Ni19 low-attenuation indicating cystic or necrotic change (n = 7/19, 36.8 per cent),Reference Seok, Hyun, Jeong, Ahn, Kim and Jung20, Reference Kato, Kanematsu, Mizuta, Ito and Hirose21 calcification (n = 80/196, 40.8 per cent),Reference Wang, Yu, Li, Sun, Zhu and Wang5, Reference Kato, Kanematsu, Mizuta, Ito and Hirose21 ill-defined borders (n = 128/227, 56.4 per cent),Reference Wang, Yu, Li, Sun, Zhu and Wang5, Reference Seok, Hyun, Jeong, Ahn, Kim and Jung20 and lymphadenopathy greater than or equal to 5 mm (n = 74/227, 32.6 per cent).Reference Wang, Yu, Li, Sun, Zhu and Wang5, Reference Seok, Hyun, Jeong, Ahn, Kim and Jung20 Horiuchi et al.Reference Horiuchi, Shimono, Tatekawa, Tsukamoto, Takita and Okazaki17 compared carcinoma ex pleomorphic adenoma to adenoid cystic carcinoma, and other malignant tumours such as salivary duct carcinoma. Carcinoma ex pleomorphic adenoma had less perineural invasion compared to adenoid cystic carcinoma (p = 0.017) and salivary duct carcinoma (p = 0.041), and lower rates of bony change compared to adenoid cystic carcinoma (p = 0.02).Reference Horiuchi, Shimono, Tatekawa, Tsukamoto, Takita and Okazaki17 Seok et al.Reference Seok, Hyun, Jeong, Ahn, Kim and Jung20 compared carcinoma ex pleomorphic adenoma to pleomorphic adenoma, demonstrating carcinoma ex pleomorphic adenoma to have a statistically significant difference in tumour size (p = 0.01), and higher rates of lymphadenopathy greater than or equal to 5 mm (p = 0.44). The authors also reported deep lobe involvement on 3/15 patients, and all 15 carcinoma ex pleomorphic adenoma tumours were single tumours. These two features did not achieve statistical significance.Reference Seok, Hyun, Jeong, Ahn, Kim and Jung20 The other three papers did not have a comparator group.
CT features of carcinoma ex pleomorphic adenoma (CXPA); PA = pleomorphic adenoma; PNI = perineural invasion

Ultrasound
Only one study reported on ultrasound in carcinoma ex pleomorphic adenoma.Reference Angang, Jia, Xia, Ping and Jiang3 Ding et al. compared ultrasound findings of 11 intracapsular and 78 invasive carcinoma ex pleomorphic adenoma. Three key features examined were irregular edges, ill-defined borders and no enhancement of posterior echo. Although individual features demonstrated low sensitivity (51.3 per cent, 51.3 per cent and 56.4 per cent respectively), further analysis where the presence of any one of three features was demonstrated showed a sensitivity of 85.9 per cent and specificity of 90.9 per cent for predicting malignancy.Reference Angang, Jia, Xia, Ping and Jiang3
Subgroup analysis
Subgroup analysis could be performed for non-invasive and/or minimally invasive tumours against frankly invasive tumours in three studies.Reference Angang, Jia, Xia, Ping and Jiang3, Reference Wang, Yu, Li, Sun, Zhu and Wang5, Reference Akutsu, Horikoshi, Yokota, Wada, Motoori and Nasu16 Akutsu et al. suggested there were statistically significant differences in the corona signs between invasive and non-invasive carcinoma ex pleomorphic adenoma (p < 0.001 for fat-suppressed T2-weighted imaging, and p = 0.001 for contrast-enhanced, fat-suppressed T1-weighted imaging), but not for the black ring sign (p = 0.31).Reference Akutsu, Horikoshi, Yokota, Wada, Motoori and Nasu16
Wang et al.Reference Wang, Yu, Li, Sun, Zhu and Wang5 noted that radiological features such as morphology and boundary, including uneven margins and irregularity, are more likely to predict invasive carcinoma ex pleomorphic adenoma. Although the mean apparent diffusion coefficient values for non-invasive carcinoma ex pleomorphic adenoma was higher than invasive carcinoma ex pleomorphic adenoma, there was no statistically significant difference between the two.Reference Wang, Yu, Li, Sun, Zhu and Wang5 Ding et al. similarly reported ultrasound features that indicate malignancy are ill-defined borders and irregularity.Reference Angang, Jia, Xia, Ping and Jiang3
Risk-of-bias assessment
The Oxford Centre for Evidence-based Medicine level of evidence was assessed. There were nine level-3 studies,Reference Angang, Jia, Xia, Ping and Jiang3, Reference Wang, Yu, Li, Sun, Zhu and Wang5–Reference Wada, Yokota, Horikoshi, Starkey, Hattori and Hashiba7, Reference Sumi and Nakamura9, Reference Abdel Razek, Elkhamary and Nada15–Reference Horiuchi, Shimono, Tatekawa, Tsukamoto, Takita and Okazaki17, Reference Seok, Hyun, Jeong, Ahn, Kim and Jung20 and three level-4 studies.Reference Kashiwagi, Murakami, Chikugo, Tomita, Kawano and Nakanishi18, Reference Li, Lu, Zhang, Lai, Zhang and Ni19, Reference Kato, Kanematsu, Mizuta, Ito and Hirose21 All studies were retrospective. Common issues were that most studies were local, non-random samples of salivary gland tumoursReference Sumi and Nakamura9, Reference Abdel Razek, Elkhamary and Nada15, Reference Horiuchi, Shimono, Tatekawa, Tsukamoto, Takita and Okazaki17 or case series,Reference Kashiwagi, Murakami, Chikugo, Tomita, Kawano and Nakanishi18, Reference Li, Lu, Zhang, Lai, Zhang and Ni19, Reference Kato, Kanematsu, Mizuta, Ito and Hirose21 thus reducing their levels of evidence.
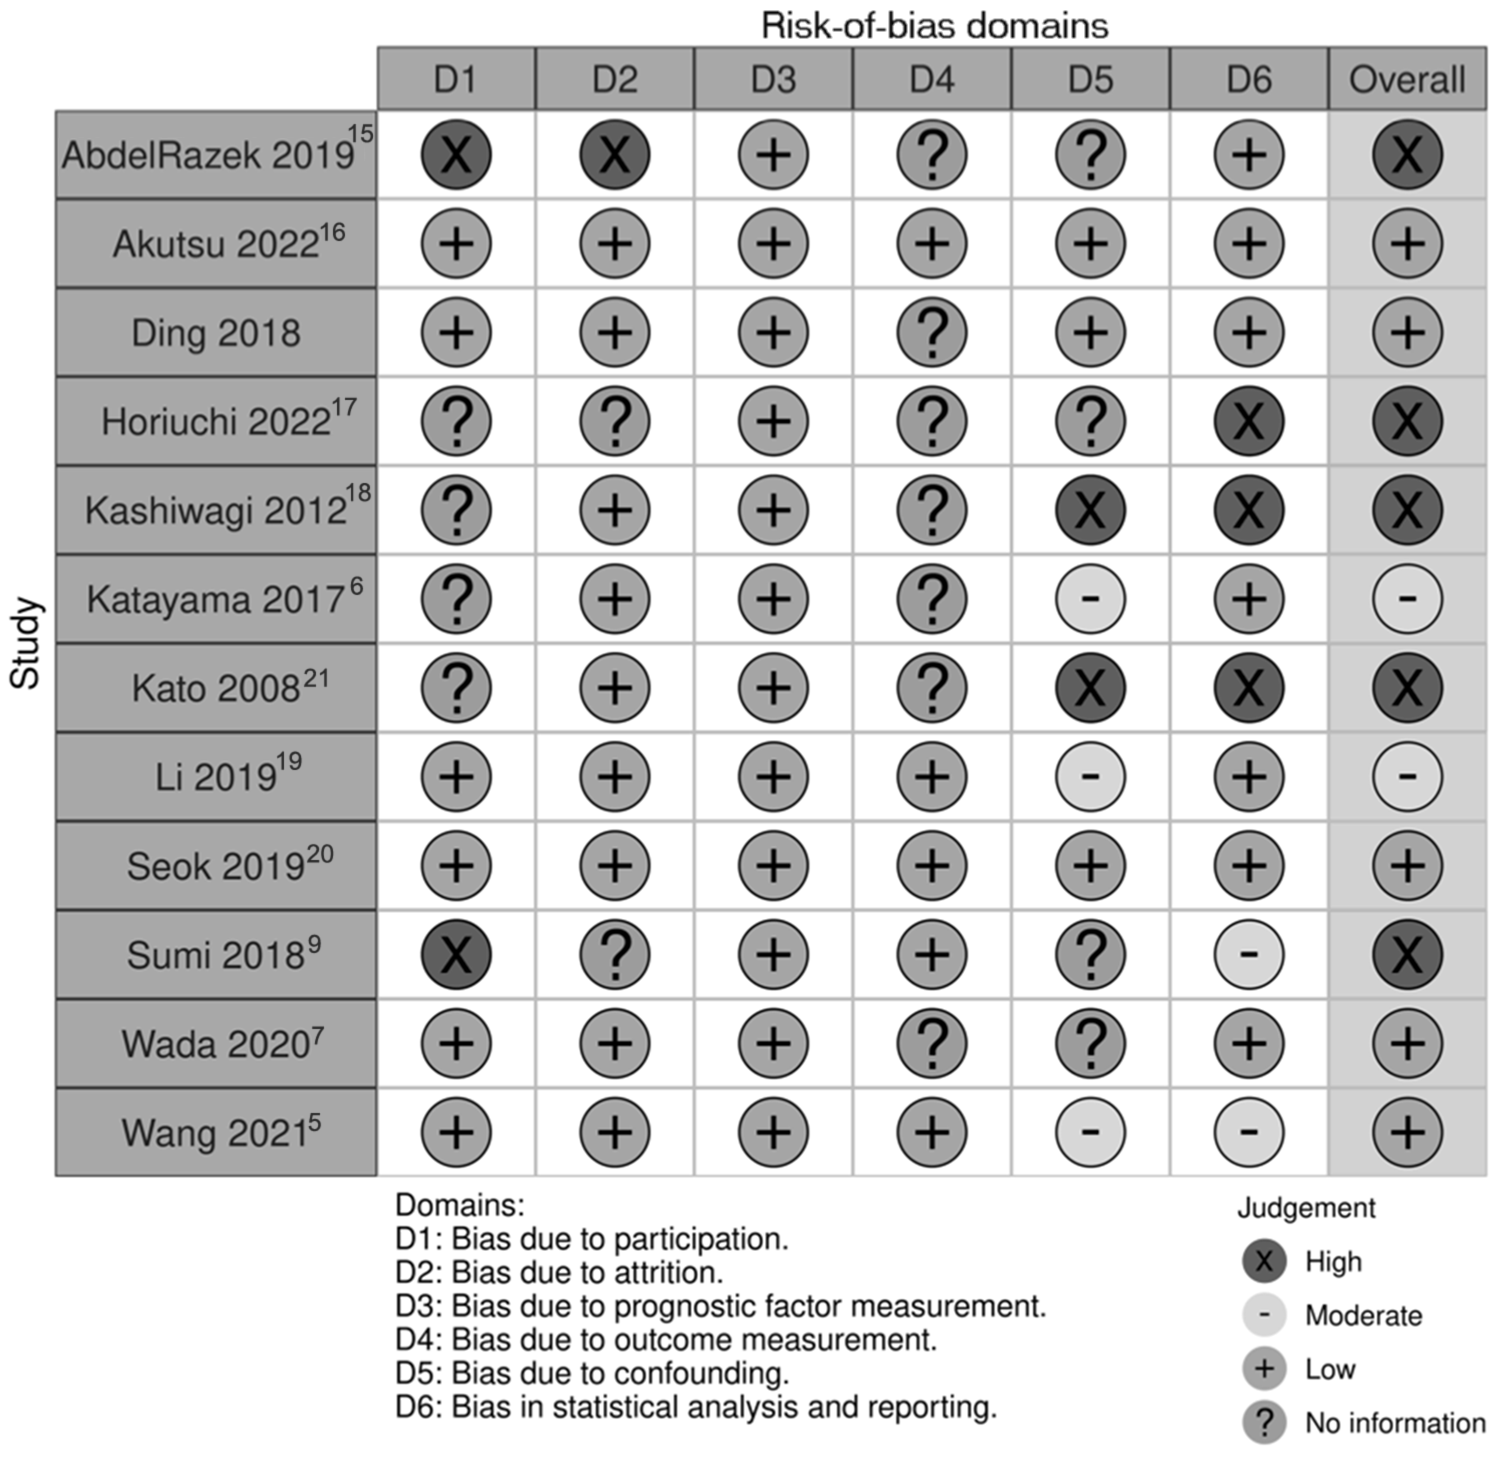
Risk-of-bias assessment was performed with the Quality in Prognostic Studies tool,Reference Hayden, van der Windt, Cartwright, Côté and Bombardier13 and graphed with the robvis toolReference McGuinness and Higgins22 (Figure 3). Risk of bias was high in five studies,Reference Sumi and Nakamura9, Reference Abdel Razek, Elkhamary and Nada15, Reference Horiuchi, Shimono, Tatekawa, Tsukamoto, Takita and Okazaki17, Reference Kashiwagi, Murakami, Chikugo, Tomita, Kawano and Nakanishi18, Reference Kato, Kanematsu, Mizuta, Ito and Hirose21 moderate in two studiesReference Katayama, Eida, Fujita, Hotokezaka, Sumi and Nakamura6, Reference Li, Lu, Zhang, Lai, Zhang and Ni19 and low in five studies.Reference Angang, Jia, Xia, Ping and Jiang3, Reference Wang, Yu, Li, Sun, Zhu and Wang5, Reference Wada, Yokota, Horikoshi, Starkey, Hattori and Hashiba7, Reference Akutsu, Horikoshi, Yokota, Wada, Motoori and Nasu16, Reference Seok, Hyun, Jeong, Ahn, Kim and Jung20 The generally high risk of bias can be attributed to the large amount of missing data in judging bias due to outcome measurementReference Angang, Jia, Xia, Ping and Jiang3, Reference Katayama, Eida, Fujita, Hotokezaka, Sumi and Nakamura6, Reference Wada, Yokota, Horikoshi, Starkey, Hattori and Hashiba7, Reference Abdel Razek, Elkhamary and Nada15, Reference Horiuchi, Shimono, Tatekawa, Tsukamoto, Takita and Okazaki17, Reference Kashiwagi, Murakami, Chikugo, Tomita, Kawano and Nakanishi18, Reference Kato, Kanematsu, Mizuta, Ito and Hirose21 and confounding.Reference Wada, Yokota, Horikoshi, Starkey, Hattori and Hashiba7, Reference Sumi and Nakamura9, Reference Abdel Razek, Elkhamary and Nada15, Reference Horiuchi, Shimono, Tatekawa, Tsukamoto, Takita and Okazaki17 Due to the retrospective nature of the included studies, study authors were not able to control for confounders. Because carcinoma ex pleomorphic adenoma was frequently part of a larger cohort of salivary gland tumours,Reference Sumi and Nakamura9, Reference Abdel Razek, Elkhamary and Nada15, Reference Horiuchi, Shimono, Tatekawa, Tsukamoto, Takita and Okazaki17 or study authors did not clearly specify how patients were identified for inclusion,Reference Katayama, Eida, Fujita, Hotokezaka, Sumi and Nakamura6, Reference Kashiwagi, Murakami, Chikugo, Tomita, Kawano and Nakanishi18, Reference Kato, Kanematsu, Mizuta, Ito and Hirose21 participant selection was an area with high risk of bias. Furthermore, it was not specified if there was consecutive inclusion of carcinoma ex pleomorphic adenoma patients into the study, hence increasing selection bias in the study. Prognostic factors were well reported, including details regarding radiology equipment and techniques.Reference Angang, Jia, Xia, Ping and Jiang3, Reference Wang, Yu, Li, Sun, Zhu and Wang5–Reference Wada, Yokota, Horikoshi, Starkey, Hattori and Hashiba7, Reference Sumi and Nakamura9, Reference Abdel Razek, Elkhamary and Nada15–Reference Kato, Kanematsu, Mizuta, Ito and Hirose21
Risk-of-bias assessment performed with the Quality in Prognostic Studies tool,Reference Hayden, van der Windt, Cartwright, Côté and Bombardier13 and graphed with the robvis tool.Reference McGuinness and Higgins22 Studies shown are identified by lead author.

Discussion
To our knowledge, this is the first systematic review summarising imaging characteristics in carcinoma ex pleomorphic adenoma. In considering the three imaging modalities reported in the literature, pre-operative MRI appeared to have the highest utility in predicting for carcinoma ex pleomorphic adenoma as opposed to benign tumours.Reference Geiger, Ismaila, Beadle, Caudell, Chau and Deschler2, Reference Katayama, Eida, Fujita, Hotokezaka, Sumi and Nakamura6, Reference Abdel Razek, Elkhamary and Nada15 In studies reporting on CT, this was used in addition to MRI in order to supplement MRI radiological findings and identify particular characteristics such as osseous change.Reference Horiuchi, Shimono, Tatekawa, Tsukamoto, Takita and Okazaki17, Reference Li, Lu, Zhang, Lai, Zhang and Ni19 Despite the accessibility of ultrasound as an imaging modality, only one study examined this modality, hence generalisable conclusions could not be determined.
Identifying radiological characteristics that may discriminate carcinoma ex pleomorphic adenoma from pleomorphic adenoma and other benign salivary gland tumours will strengthen the body of evidence guiding resection against surveillance imaging in salivary gland tumours. This will allow for increasingly nuanced discussions and decision-making to improve patient care. As in other salivary gland tumours, MRI appeared to be the imaging modality of greatest interest in carcinoma ex pleomorphic adenoma. In the current literature, there is common consensus that carcinoma ex pleomorphic adenoma demonstrates T1 and T2 heterogenous intensityReference Wang, Yu, Li, Sun, Zhu and Wang5, Reference Kato, Kanematsu, Mizuta, Ito and Hirose21 and lower apparent diffusion coefficient values,Reference Friedman, Patino and Abdel Razek23, Reference Maraghelli, Pietragalla, Cordopatri, Nardi, Peired and Maggiore24 although there is yet to be a common consensus in regards to the type of MRI signal demonstrated.Reference Friedman, Patino and Abdel Razek23, Reference Maraghelli, Pietragalla, Cordopatri, Nardi, Peired and Maggiore24 One resource suggests carcinoma ex pleomorphic adenoma demonstrates low T2 intensity,Reference Friedman, Patino and Abdel Razek23 whilst another suggests low T1 with hyperintense foci and high T2 intensity.Reference Maraghelli, Pietragalla, Cordopatri, Nardi, Peired and Maggiore24
Results from our systematic review suggest that most carcinoma ex pleomorphic adenomas demonstrate heterogenous intensity on T2 weighted MRI and lower mean apparent diffusion coefficient values on diffusion-weighted imaging than benign tumours. In addition to using apparent diffusion coefficient values for differentiating benign from malignant salivary gland tumours, Hepp et al. also indicated that apparent diffusion coefficient histograms containing apparent diffusion coefficient values may have higher levels of accuracy, and recommend using these histograms to enhance the accuracy of differentiating salivary gland tumours.Reference Hepp, Wuest, Heiss, May, Kopp and Wetzl25
Perineural invasion, although a known prognostic factor, was not well reported as a discrete data subset for radiological features in carcinoma ex pleomorphic adenoma. Only four studies reported on clinical perineural invasion in carcinoma ex pleomorphic adenoma,Reference Akutsu, Horikoshi, Yokota, Wada, Motoori and Nasu16, Reference Horiuchi, Shimono, Tatekawa, Tsukamoto, Takita and Okazaki17, Reference Seok, Hyun, Jeong, Ahn, Kim and Jung20, Reference Kato, Kanematsu, Mizuta, Ito and Hirose21 wherein 14.1 per cent (n = 10/71) of patients were clinically noted to have evidence of perineural invasion reported at presentation. Radiological evidence of this was not well reported. One of the included studies by Horiuchi et al. reported that any perineural invasion indicates higher bone involvement for a pooled group of malignant salivary gland tumours (odds ratio 3.98, p = 0.006), although only one of 15 carcinoma ex pleomorphic adenoma patients was positive.Reference Horiuchi, Shimono, Tatekawa, Tsukamoto, Takita and Okazaki17 Inferences can be drawn from a larger group of pooled 151 parotid gland tumours, in which 26 carcinoma ex pleomorphic adenoma patients (20 with facial nerve invasion, and 6 without) were included.Reference Cho, Lee, Choi, Lee, Choi and Nam8 Although discrete data were not reported for carcinoma ex pleomorphic adenoma, statistically significant radiological features predicting facial nerve invasion in both univariate and multivariate analysis were spiculated margins (p = 0.003), larger mean tumour size (p = 0.001), location in the course of the facial nerve (p = 0.014) and retromandibular vein involvement (p = 0.023).Reference Cho, Lee, Choi, Lee, Choi and Nam8 Future directions examining carcinoma ex pleomorphic adenoma characteristics could consider exploring these features as a particular area of focus in MRI characteristics of carcinoma ex pleomorphic adenoma.
Radiomic analysis is another emerging element in the radiological assessment of salivary gland tumours, particularly in differentiating benign from malignant tumours pre-operatively. Utilisation of predictive models based on MRI characteristics are already under development.Reference Zhang, Ai, Wong, Green, Qamar and So4, Reference He, Mao, Lu, Tan, Xiao and Tan26, Reference Piludu, Marzi, Ravanelli, Pellini, Covello and Terrenato27 However, due to the rarity of carcinoma ex pleomorphic adenoma, the wider body of radiomic and machine-learning data does not include carcinoma ex pleomorphic adenoma as part of its malignant salivary gland tumour subset.Reference Zhang, Ai, Wong, Green, Qamar and So4, Reference He, Mao, Lu, Tan, Xiao and Tan26, Reference Huang, Chen, She, Xing, Chen and Cao28
Two radiomic studies have been recently published in the literature, for which three carcinoma ex pleomorphic adenoma patients form part of the malignant salivary gland tumour subset.Reference Piludu, Marzi, Ravanelli, Pellini, Covello and Terrenato27, Reference Wen, Zhang, Zhu, Liu, Li and Huang29 Although discrete information pertaining to carcinoma ex pleomorphic adenoma is not available, both studies compare benign and malignant parotid tumours. Piludu et al.Reference Piludu, Marzi, Ravanelli, Pellini, Covello and Terrenato27 reported 80.4 per cent accuracy, 85.0 per cent sensitivity, and 94.1 per cent specificity in differentiating 37 benign and 32 malignant tumours in their radiomic model. They recommended utilisation of T2 weightage, apparent diffusion coefficient, and qualitative scores for tumour margins and contrast enhancements to improve accuracy.Reference Piludu, Marzi, Ravanelli, Pellini, Covello and Terrenato27 Wen et al.Reference Wen, Zhang, Zhu, Liu, Li and Huang29 performed a similar study comparing 88 benign and 42 malignant parotid tumours on apparent diffusion coefficient mapping with 3T scanners, demonstrating 73.17 per cent accuracy, 84.62 per cent sensitivity, and 67.86 per cent specificity. The authors noted that the lack of T2 and contrast-enhanced T1 imaging in training their radiomic model may have affected the diagnostic accuracy.Reference Wen, Zhang, Zhu, Liu, Li and Huang29
A limitation of our review is that our search strategy is limited to the English language literature. The majority of emerging data appears to be from Asian institutions (7 Japan, 3 China, 1 Korea), and carcinoma ex pleomorphic adenoma has been suggested to have a geographical variation in incidence.Reference Antony, Gopalan, Smith and Lam1 Hence, inclusion of non-English databases may identify additional articles to increase the strength of evidence. There were generally low levels of evidence (Centre for Evidence-based Medicine levels 3 and 4), with all studies being retrospective observational studies.
One of the challenges encountered during this review related to difficulty in separating CT and MRI findings in the included studies, thus precluding calculation of modality-specific diagnostic accuracy data.Reference Wang, Yu, Li, Sun, Zhu and Wang5 Additionally, there was limited synthesis of multiple features in improving diagnostic accuracy. One study demonstrated improved sensitivity of ultrasound in detecting invasive carcinoma ex pleomorphic adenoma by combining three sonographic features,Reference Angang, Jia, Xia, Ping and Jiang3 indicating this may be an area for future research. Furthermore, it is noted that although ultrasound is a readily available modality for assessing salivary gland tumours, only one ultrasound study was identified, raising the possibility of missing data in ultrasound assessment of carcinoma ex pleomorphic adenoma. Future studies could consider analysis of imaging modalities in combination, particularly as salivary gland tumours can be imaged with any of ultrasound, CT, or MRI, in routine clinical practice.Reference Geiger, Ismaila, Beadle, Caudell, Chau and Deschler2
Additionally, studies had heterogeneously defined characteristics and radiological features of interest. As such, there were insufficient radiological characteristics with comparable data for each modality, hence receiver operating characteristic curves to predict frankly invasive carcinoma ex pleomorphic adenoma could not be calculated as planned. Similarly, although Fisher’s exact test and chi-square were planned to be used in comparing poorer clinical outcomes against radiological features, there were insufficient studies with directly comparable data. Sensitivity analysis was planned to separate high- and low-quality studies. However, due to the low number of studies and heterogenous reporting of radiological features, this was not possible. Given the lack of standardised radiological characteristics, a meta-analysis could not be performed.
As the body of evidence surrounding carcinoma ex pleomorphic adenoma develops, potential pathognomonic signs that have been described in the literature, namely the corona and black ring signs,Reference Akutsu, Horikoshi, Yokota, Wada, Motoori and Nasu16 may warrant further investigation. An intrinsic limitation of systematic reviews is that our findings are guided by the existing literature. There is sparse literature pertaining to T1 findings, and hence a definite conclusion cannot be inferred for T1 signal. Akutsu et al. performed an analysis comparing radiological features in invasive and non-invasive carcinoma ex pleomorphic adenoma for particular radiological characteristics, identifying statistically significant relationships.Reference Akutsu, Horikoshi, Yokota, Wada, Motoori and Nasu16 Prospective collection of both clinical and radiological data similar to the study methods utilised in this study may be useful in further identifying the relationship of these two components. The small sample sizes reported in the literature limit the generalisability of conclusions. However, this is the inherent challenge when dealing with a rare tumour such as carcinoma ex pleomorphic adenoma. Prospective international collaborations, such as registry-based study designs could be considered for future research.
• Pre-operative imaging, particularly magnetic resonance imaging, is a key step in the evaluation of salivary gland tumours such as carcinoma ex pleomorphic adenoma as it can clarify malignant features such as perineural involvement, size, and margins
• Magnetic resonance imaging with high or heterogenous T2 signal, and lower mean apparent diffusion coefficient values, are associated with carcinoma ex pleomorphic adenoma
Conclusion
Magnetic resonance imaging has the greatest utility in pre-operative prediction for carcinoma ex pleomorphic adenoma. Within the limits of interpreting a heterogenous body of evidence, in addition to general radiologic features of malignancy such as irregularity and poorly demarcated borders, MRI features of lower mean apparent diffusion coefficient values and heterogenous T2 intensity are associated with, and may predict for, carcinoma ex pleomorphic adenoma.
Supplementary material
The supplementary material for this article can be found at https://doi.org/10.1017/S0022215124001841.
Acknowledgements
This manuscript was included as part of a Masters of Philosophy with the University of Sydney.
Funding statement
This research received no specific grant from any funding agency, commercial or not-for-profit sectors.
Competing interests
The authors declare none.