Introduction
As the pandemic of obesity spreads across the globe, of particular concern is the increase in obesity among women of reproductive age.Reference Chu, Kim and Bish 1 , Reference Heslehurst, Rankin, Wilkinson and Summerbell 2 Individuals exposed in utero to either maternal obesity or gestational diabetes mellitus have increased risk of developing type 2 diabetes mellitus, hypertension, obesity and other features of metabolic syndrome in later life.Reference Boney, Verma, Tucker and Vohr 3 , Reference Nelson, Matthews and Poston 4 The molecular mechanisms by which excessive maternal nutrition affects long-term health of the offspring remain to be fully understood.
Recently, we established a murine model of maternal obesity, using a diet rich in simple sugars as well as fat, which reflects a diet consumed by many women of reproductive age.Reference Henderson, Gregory, Irving and Swan 5 We have shown that maternal overnutrition leads to hyperphagia, development of increased adiposity and reduction in skeletal muscle mass in the offspring.Reference Samuelsson, Matthews and Argenton 6 Offspring of obese dams were also hyperinsulinaemic at 3 months of age, indicative of insulin resistance. Male offspring of obese dams displayed more pronounced phenotypic changes in relation to glucose homoeostasis than female offspring, and by 6 months of age showed substantial fasting hyperglycaemia.Reference Samuelsson, Matthews and Argenton 6 Insulin resistance observed in the offspring of obese dams at 3 months of age could be caused by molecular alterations in the insulin-signalling pathway and mitochondrial complex activities in the skeletal muscle.Reference Shelley, Martin-Gronert and Rowlerson 7 However, the liver also plays a major role in glucose and lipid homoeostasis. Most recently, we have reported that female offspring of obese dams develop a non-alcoholic fatty lipid disease (NAFLD)-like phenotype with evidence of raised liver triglycerides, steatohepatitis, hepatic fibrogenesis and sympathetic nervous system activation.Reference Oben, Mouralidarane and Samuelsson 8 In an earlier study, a similar phenotype had been described in offspring of mice fed a fat-rich diet without the development of obesity.Reference Bruce, Cagampang and Argenton 9
The liver has the ability to use, store and produce glucose, processes that are tightly regulated by circulating hormones such as insulin in order to maintain fuel homoeostasis. Insulin prevents hepatic glucose production by inhibiting glycogenolysis and gluconeogenesis. The failure of insulin to suppress hepatic glucose production is a key feature of insulin resistance and is a major factor contributing to hyperglycaemia in diabetic states. In addition, insulin resistance in the liver leads to impaired glycogen synthesis, enhanced lipogenesis and synthesis of inflammatory proteins.Reference Meshkani and Adeli 10
Insulin action in the liver is mediated by a complex network of molecules. Briefly, the activation of insulin receptor by insulin leads to phosphorylation of insulin receptor substrate (IRS) proteins and initiation of two major signalling cascades. The metabolic effects of insulin are mediated by the phosphatidylinositol-3-kinase (PI3K) pathway with its downstream substrates protein kinase B (PKB, also known as Akt) and atypical protein kinase C (PKC). Alterations in this pathway have been reported in the livers of insulin resistant ob/ob mice and non-diabetic, insulin-resistant high-fat fed mice.Reference Standaert, Sajan and Miura 11 The mitogenic effects of insulin are modulated by the mitogen-activated protein kinase (MAPK) pathway, which controls cell growth, differentiation and survival. Insulin can activate three members of this family: c-Jun N-terminal kinase (JNK), p38 MAPK and extracellular signal-regulated kinase (ERK), all of which have been implemented in the development of hepatic insulin resistance.Reference Hirosumi, Tuncman and Chang 12 – Reference Zheng, Zhang and Pendleton 15
Oxidative stress has emerged as an important factor in the pathogenesis of obesity and type 2 diabetes.Reference van Gaal, Zhang, Steijaert and Deleeuw 16 , Reference Evans, Goldfine, Maddux and Grodsky 17 High-fat feeding in rats has been shown to increase hepatic oxidative stress and reactive oxygen species (ROS) synthesis has been proposed as an initial event that precedes the onset of insulin resistance in mice fed a high-fat diet.Reference Milagro, Campión and Martínez 18 Cellular antioxidant enzyme defences play a major role in decreasing ROS within a cell and maintaining redox homoeostasis. Treatments with anti-oxidant enzymes aimed at reducing ROS levels can ameliorate insulin resistance.Reference Kumashiro, Tamura and Uchida 19
We hypothesize that liver-specific insulin signalling defects mediate the insulin resistance observed in the offspring of obese dams and that impaired anti-oxidant defense in the liver could contribute to these differences. The aim of this study, therefore, was to analyze the protein expression/phosphorylation of key insulin signalling molecules in both the metabolic and mitogenic insulin pathways and to measure the protein expression of antioxidant enzymes in the liver of male offspring of obese dams.
Materials and methods
Animals
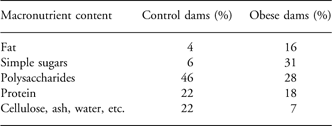
All studies were approved by the local Ethics Committee and were conducted according to the Home Office Animals (Scientific Procedures) Act 1986. The model has been described in detail previously.Reference Henderson, Gregory, Irving and Swan 5 Briefly, female C57BL/6J mice, proven breeders, were fed ad libitum either a standard control chow RM1 diet or a highly palatable energy-rich obesogenic diet and sweetened condensed milk (Nestle, UK) fortified with mineral and vitamin mix AIN93G (Table 1). Diets were purchased from Special Dietary Services, Witham, UK. Six weeks later, mice fed the obesogenic diet had significantly higher body fat in comparison to the controls. Both obese and control dams were then mated and day 1 of pregnancy was signified by the appearance of a plug. Dams were maintained on their respective experimental diets throughout pregnancy and lactation. After 48-h delivery, litters were reduced at random to six pups with an equal gender ratio where possible. At 21 days of age, all pups were weaned onto standard chow (RM1 diet). The animals were maintained on this diet throughout the study. At 3 months of age (adulthood), a single male offspring from n = 6 control litters and n = 6 obese litters was killed in the fed state by rising concentration of CO2. Body weight of the animals was recorded at post mortem, and the liver was removed, weighed and snap frozen in liquid nitrogen for molecular and biochemical analyses. All samples were stored at −80°C.
Macronutrient content of experimental diets fed to dams during gestation and lactation

Macronutrient content of consumed food is expressed as percentage by weigh.
Glucose measurements
Fed plasma glucose was measured by using a blood glucose analyzer (OneTouch Ultra, LifeScan Inc., USA).
Antibodies and reagents
Antibodies against IRS-1, phospho-IRS-1 (Ser307) [molecular weight (MW) of IRS proteins = 180 kDa], MnSOD (MW = 25 kDa) and PI3kinase p85α (MW = 85 kDa) were purchased from Upstate Biotechnology, Lake Placid, USA. Akt1, Akt2, phospho-Akt (Ser473) (MW of Akt proteins = 60 kDa), PI3K p110β (MW = 110 kDa) phospho-ERK1/2 (Thr202/Tyr204; ERK1 MW = 44 kDa, ERK2 MW = 42 kDA), phospho-p38 MAP-kinase (Thr180/Tyr182; MW = 43 kDa), JNK1 (MW = 46 kDa) and JNK2 (MW = 54 kDa) were obtained from Cell Signaling Technology, Beverly, USA. Antibodies against insulin receptor (IR)β (MW = 95 kDa), phospho-IRS1/2 (Tyr612), glycogen synthase kinase (GSK) 3α (MW = 51 kDa) and β (MW = 46 kDa) and PKCζ (MW = 78 kDa) were from Santa Cruz Biotechnology, Santa Cruz, USA while GLUT4 (MW = 45 kDa), catalase (MW = 60 kDa), glutathione peroxidase-1 (GPX-1; MW = 22 kDa), glutathione reductase (GR) (MW = 58 kDa), IRS2 and phospho-JNK (Thr183/Tyr185) were purchased from Abcam, Cambridge, UK. CuZnSOD (MW = 18 kDa) was obtained from R&D Systems, Abingdon, UK. All biochemical reagents unless stated otherwise were purchased from Sigma-Aldrich, UK.
Western blotting
Liver samples were homogenized in ice-cold lysis buffer [50 mmol/l HEPES (pH 8), 150 mmol/l sodium chloride, 1% Triton X100, 1 mmol/l sodium orthovanadate, 30 mmol/l sodium fluoride, 10 mmol/l sodium pyrophosphate, 10 mmol/l EDTA and a protease inhibitor cocktail (set III, Calbiochem Novabiochem Biosciences, Nottingham, UK)]. The total protein concentration of the lysates was measured using a copper/bicinchoninic assay (Sigma-Aldrich, UK). Protein content of liver tissue did not differ between the two groups. Samples were standardized to a common concentration of 1 mg/ml in Laemmli buffer. Twenty micrograms of total protein were subjected to sodium dodecyl sulfate polyacrylamide gel electrophoresis (SDS-PAGE) along with protein markers (high-range molecular weight markers, Amersham Biosciences, Buckinghamshire, UK). The separated proteins were transferred onto a polyvinylidene difluoride membrane (Immobilon-P, Millipore, Billerica, MA, USA). One of two protocols was then followed for blocking and antibody incubation depending on the protein being studied.
Protocol 1
This protocol was used for antibodies purchased from Cell Signaling Technology, Beverly, USA. Membranes were blocked [5% non-fat dehydrated milk, 1 × TBS (Tris buffered saline), 0.1% Tween 20] for 1 h at room temperature and incubation with antibodies was then carried out overnight. Antibodies were diluted in 1 × TBS, 0.1% Tween 20 containing either 5% non-fat dehydrated milk or 5% bovine serum albumin as instructed in the protocol. Three 5 min washes with TBS/T (1 × TBS, 0.1% Tween 20) were then carried out, after which membranes were incubated with horseradish peroxidase-conjugated secondary antibodies to rabbit or mouse immunoglobins (Jackson ImmunoResearch, Stratech, UK) diluted in blocking buffer. A further three 5 min washes with TBS/T were then carried out.
Protocol 2
Membranes were blocked (1% non-fat dehydrated milk, 1 × TBS, 0.1% Tween 20) overnight at 4°C. Antibodies against IRβ, PKCζ and GLUT4 were diluted in phosphate-buffered saline (PBS) wash buffer (1% non-fat dehydrated milk and 0.1% Tween 20). Membranes were incubated with primary antibodies for 1 h at room temperature. Membranes were then subjected for 35 min to a TBSE wash (1 × TBS, 0.1% SDS, 0.5 μM EDTA, 1% Triton X-100 and 24 mM sodium deoxycholate), followed by two 5-min washes with PBS wash buffer. Horseradish peroxidase-conjugated secondary antibodies to rabbit immunoglobins (Jackson ImmunoResearch, Stratech, UK) were then diluted in PBS wash and membranes were incubated with secondary antibody for 1 h at room temperature. Membranes were then washed as for primary antibodies.
Antibody binding was detected by using Super Signal West Pico Chemiluminescent substrate (Thermo Scientific, UK). All the antibodies were validated with mouse tissue using manufacturer-suggested positive controls and concentrations of antibodies prior to the commencement of the experiments. Audioradiographs of western blots were scanned and protein expression was quantified densitometrically using AlphaEase software (AlphaInnotech, San Leandro, USA). In order to ensure the linearity of the signal, 20 μg and 10 μg of one sample was loaded onto each gel.
Statistical analysis
Data were analyzed from one male per litter. ‘n’ refers to the number of litters per group. ‘n’ = 6 for all the parameters studied, except for phosphorylated protein data where n = 4 per group. All data between groups were analyzed by unpaired Student’s t-test using Prism 5 (GraphPad, La Jolla, USA) statistical package. Protein expression data are presented as mean percentage expression of control offspring ± s.e.m. For all data sets, P < 0.05 was considered statistically significant.
Results
Body weight, liver weight and blood analysis
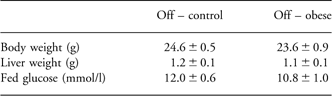
There was no difference in body weight between offspring of control and obese dams at 3 months of age (Table 2). This is consistent with previous data suggesting that significant divergence of body weight of male offspring of obese dams starts after this time point.Reference Henderson, Gregory, Irving and Swan 5 Liver weight also did not differ between the two groups (Table 2). Fed plasma glucose was comparable between the groups (Table 2).
Body weight, liver weight and fed glucose in 3-month-old male offspring of obese dams
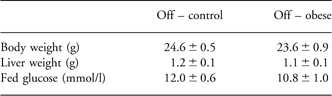
Off, offspring.
Values are presented as mean control ± s.e.m., n = 6 per group.
Protein expression and phosphorylation of IR and IRS proteins
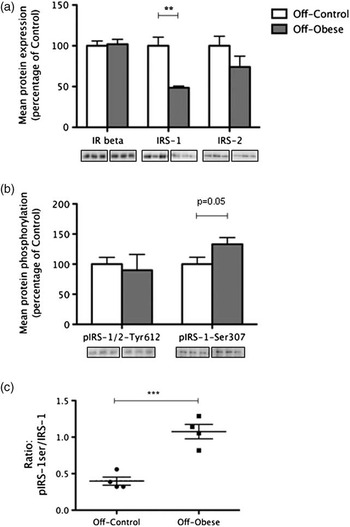
Maternal obesity did not affect hepatic expression of IRβ in 3-month-old male offspring (Fig. 1b). However, the expression of IRS1 was significantly reduced in the offspring of obese dams (52% reduction compared with controls, P = 0.003), whereas the expression of IRS2 was not significantly altered between the groups (Fig. 1a). There was no significant difference in the phosphorylation of IRS1/2 at Tyrosine residue 612, but the phosphorylation of IRS1 at Serine 307 position tended to be increased in the offspring of obese dams (51% increase compared with controls, P = 0.05; Fig. 1b. The finding of diminished hepatic IRS1 expression and increased phosphorylation of IRS1 Ser 307 residue is consistent with our previous findings in female offspring of obese dams.Reference Shelley, Martin-Gronert and Rowlerson 7 In this study, the ratio of phosphorylated IRS1 at Ser 307 to total IRS1 was increased in the male offspring of obese dams (270% increase compared with controls, P < 0.001; Fig. 1c).
The effect of maternal obesity on expression and phosphorylation of hepatic IR and IRS proteins in 3-month-old male offspring. (a) Protein expression of IRβ and IRS1/2. (b) Phosphorylation of IRS1 at Serine 307 and IRS1/2 at Tyr 612. (c) Ratio of phosphorylated IRS1 at Ser 307 to total IRS1. Bars represent mean expression/phosphorylation values for control offspring (white) and offspring of obese dams (gray) ± s.e.m., expressed as percentage of mean control. Representative blots are located below the corresponding bar graphs. **P < 0.01, ***P < 0.001, when compared with control. IR, insulin receptor; IRS, insulin receptor substrate.

Expression and phosphorylation of proteins downstream of IR (metabolic pathway)
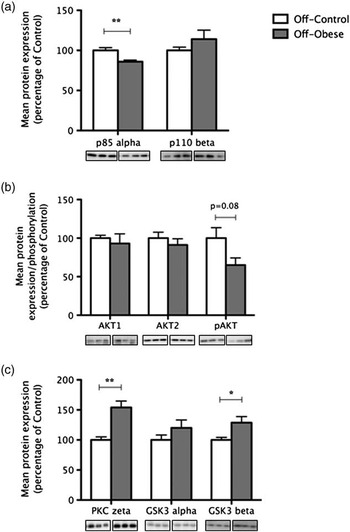
Expression of the p85α regulatory subunit of PI3K was significantly decreased in the offspring of obese dams (15% reduction when compared with controls, P = 0.005), whereas expression of the catalytic subunit p110β was comparable between the two groups (Fig. 2a). Maternal obesity did not affect expression of Akt1 or Akt2 in the offspring. However, there was a tendency for phosphorylation of Akt at Serine 473 to be diminished in the offspring of obese dams (39% reduction when compared with controls, P = 0.08; Fig. 2b). The expression of PKCζ was significantly increased in the offspring of obese dams (44% increase compared with controls, P < 0.001; Fig. 2c). These animals also had increased levels of GSK3β (28% increase compared with controls, P < 0.05), whereas the expression of GSK3α was not changed between the two groups.
The effect of maternal obesity on expression and phosphorylation of key proteins involved in conveying metabolic effects of insulin action, downstream of insulin receptor in the liver of 3-month-old male offspring. (a) Protein expression of PI3 K subunits: regulatory p85α and catalytic p110β. (b) Protein expression of Akt1 and Akt2 and phosphorylation of Akt at Serine 473. (c) Protein expression of PKCζ and GSK3s. Bars represent mean expression/phosphorylation values for control offspring (white) and offspring of obese dams (gray) ± s.e.m., expressed as percentage of mean control. Representative blots are located below the corresponding bar graphs. **P < 0.01, when compared with control. PKC, protein kinase C; GSK, glycogen synthase kinase; PI3K, phosphatidylinositol-3-kinase.

Expression and phosphorylation of proteins downstream of IR (mitogenic pathway)
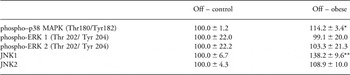
Maternal obesity resulted in a significant increase in the phosphorylation of p38 MAPK at the Thr180/Tyr182 position in the offspring (14% increase compared with controls, P = 0.004; Table 3). Phosphorylation of ERK1 (Thr 202/ Tyr 204) and ERK2 (Thr 202/Tyr 204) was comparable between the offspring of control dams and obese dams (Table 3). The expression of JNK1 (p46) was significantly increased in the offspring of obese dams (38% increase when compared with controls, P = 0.03), whereas there was no effect of maternal obesity on the expression of JNK2 (p54) (Table 3).
Effect of maternal obesity on the expression/phosphorylation of proteins involved in conveying mitogenic effects of insulin action in the livers of 3-month-old male offspring

Off, offspring; MAPK, mitogen-activated protein kinase; ERK, extracellular signal-regulated kinase; JNK, c-Jun N-terminal kinase.
Values are presented as mean control ± s.e.m., n = 6 per group for JNK1/2, n = 4 for phosphorylated proteins. *P < 0.01, **P < 0.05, when compared with control.
Expression of antioxidant enzymes
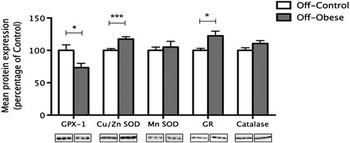
Maternal obesity led to a significant reduction in the expression of GPX-1 in the offspring (23% decrease compared with controls, P < 0.05; Fig. 3). However, expression of Cu/ZNSOD was significantly increased in the offspring of obese dams (18% increase compared with controls, P < 0.001; Fig. 3). There was no difference in the expression of MnSOD between the two groups. Maternal obesity caused a significant increase in the expression of GR in the offspring (22% increase compared with controls, P < 0.05; Fig. 3). There was no difference in the expression of catalase between the two experimental groups (Fig. 3).
The effect of maternal obesity on expression of hepatic antioxidant enzymes in 3-month-old male offspring. Bars represent mean expression/phosphorylation values for control offspring (white) and offspring of obese dams (gray) ± s.e.m., expressed as percentage of mean control. Representative blots are located below the corresponding bar graphs. *P < 0.05, ***P < 0.001, when compared with control. GPX, glutathione peroxidase; SOD, superoxide dimutase; GR, glutathione reductase.

Discussion
In this study, we explored the effects of maternal obesity during pregnancy and lactation on hepatic protein expression in adult male offspring. We studied both the metabolic and mitogenic pathways of insulin action in the liver of the male offspring of obese dams. The liver plays a central role in coordinating carbohydrate, lipid and protein metabolism, and hepatic insulin resistance is a hallmark of type 2 diabetes. It is therefore central to understanding the mechanisms underlying the effect of maternal obesity on whole body insulin resistance in the offspring.
Insulin exerts its action by binding to receptors in the plasma membrane of insulin-sensitive tissues. We did not observe any differences in the expression of IR in the male offspring of obese dams when compared with controls. This is consistent with findings in human type 2 diabetes suggesting that insulin resistance may be due to a post-receptor defect. IRS proteins play a key role in transducing the insulin signal. IRS1 expression was significantly decreased in the offspring of obese dams when compared with the controls, whereas there was no difference in the expression of IRS2. IRS1 has been shown to be the principal mediator of hepatic insulin action especially during excessive overnutrition.Reference Kubota, Kubota and Itoh 20 IRS1 knockout mice fed a high-fat diet developed severe glucose intolerance and diabetes. Our finding is consistent with reports of hepatic downregulation of IRS1 in diabetic animals.Reference Standaert, Sajan and Miura 11
Another key finding in almost all cases of insulin resistance is a reduction in PI3K activity.Reference Kerouz, Horsch, Pons and Kahn 21 Here, we show significantly decreased expression of the PI3K p85α subunit, whereas the expression of p110β was not altered between the offspring of control and obese dams. However, despite the lack of change in expression of the catalytic subunit of PI3K, the observation that serine phosphorylation of Akt tended to be reduced in the offspring of obese dams implied that PI3K activity could be impaired. Akt1 and Akt2 expression was not affected by maternal obesity.
One possible mechanism for the reduction of IRS-PI3K activity and subsequent insulin resistance involves stress kinase-induced serine phosphorylation of IRS proteins, which leads to a diminished ability of IRS proteins to interact with PI3K and activate it.Reference Gual, Le Marchand-Brustel and Tanti 22 In our study, serine phosphorylation of IRS1 at 307 residue was increased in the offspring of obese dams. Increased Ser phosphorylation at this site and equivalent site Ser312 of IRS1 has been shown in animal models of insulin resistance and in skeletal muscle of insulin-resistant humans.Reference Werner, Lee, Hansen, Yuan and Shoelson 23 , Reference Morino, Petersen and Dufour 24 In addition, the ratio of phosphorylated IRS1 at Ser 307 to total IRS1 was increased in the male offspring of obese dams indicating that a higher proportion of IRS1 substrate is serine phosphorylated and thus less active. No differences in the tyrosine phosphorylation of IRS1, a stimulatory signal, were observed. The findings in male offspring of obese dams are in accordance with our recent study in females showing that maternal diet-induced obesity led to a reduction in total hepatic IRS-1 levels with increased Ser307 phosphorylation of IRS-1 at 12 weeks of age.Reference Oben, Mouralidarane and Samuelsson 8 This could indicate that maternal obesity exerts its effects on hepatic insulin signalling in both genders of offspring via a similar mechanism.
In this study, PKCζ expression was significantly increased in the male offspring of obese dams. This is consistent with the findings of raised PKCζ in experimental animal models and human forms of obesity and type 2 diabetesReference Considine, Nyce and Allen 25 , Reference Farese, Sajan and Standaert 26 as well as in the offspring of high-fat fed dams.Reference Buckley, Keserü and Briody 27 , Reference Guo, Copps and Dong 28 Atypical PKCs are key mediators for insulin-induced upregulation of the expression of sterol regulatory element binding protein-1c (SREBP-1c), a transcription factor that activates a number of genes, including fatty acid synthase and acetyl-coenzyme A carboxylase, that control lipid synthesis in the liver. Impaired regulation of fatty acid synthesis by SREBP-1c leading to the increased accumulation of fatty acids in hepatocytes has been shown in patients with NAFLD.Reference Kohjima, Higuchi and Kato 29
GSK3 can impair hepatic insulin signalling by phosphorylation and inhibition of glycogen synthase activity and IRS1. Levels of GSK3 are elevated in type 2 diabetes and obesity.Reference Eldar-Finkelman, Schreyer, Shinohara, LeBoeuf and Krebs 30 In this study, the expression of GSK3α was no different between the two groups. However, the expression of GSK3β was increased in the offspring of obese dams.
The mitogenic and growth-regulating actions of insulin occur via MAPKs – a family of serine-threonine protein kinases that include ERKs, p38 MAPKs and JNKs. Both ERK and p38 are responsive to growth factors, whereas p38 is also activated by stress and inflammatory cues. There were no differences in the expression of either isoform ERK1 or ERK2. This is consistent with the findings in humans suggesting that ERK1/2 signalling is maintained in diabetes.Reference Cusi, Maezono and Osman 31
JNK has been implicated in the development of obesity, insulin resistance and NAFLD. JNK1 can impair insulin signalling by increasing serine phosphorylation of IRS1.Reference Aguirre, Uchida, Yenush, Davis and White 32 We observed an increase in the expression of JNK1 but not JNK2 in the offspring of obese dams. Animals genetically deficient in JNK1 are protected from developing insulin resistance, diabetes, steatosis and liver injury, whereas experimental induction of JNK1 leads to the development of these conditions.Reference Hirosumi, Tuncman and Chang 12 , Reference Singh, Wang and Xiang 33 Moreover, JNK1-deficient animals fed a high-fat diet fail to develop excessive weight gain, insulin resistance or steatohepatitis.Reference Singh, Wang and Xiang 33
p38 MAPK phosphorylation has been reported to be enhanced in the livers of ob/ob diabetic mice and high-fat diet-fed rats.Reference Li, Liu, Sigmon, McCort and Ren 13 , Reference Gum, Gaede and Heindel 14 Consistent with these findings, we observed an increase in the phosphorylation of p38 in the offspring of obese dams. Activated p38 can phosphorylate a variety of downstream substrates including tumor necrosis factor-α (TNFα) and cyclic adenosine monophosphate (cAMP) response element binding protein (CREB).Reference Tan, Rouse and Zhang 34 , Reference Solomon, Odunusi and Carrigan 35 Activation of TNFα has been associated with insulin resistance and inflammatory responses in type 2 diabetic individuals.Reference Hotamisligil 36
Oxidative stress and pathways involved in ROS production have recently been proposed to be initial key triggers of high-fat diet-induced insulin resistance, obesity and NAFLD.Reference Matsuzawa-Nagata, Takamura and Ando 37 , Reference Videla, Rodrigo and Orellana 38 Studies have shown that markers of oxidative stress are associated with obesity, insulin resistance and diabetes.Reference Urakawa, Katsuki and Sumida 39 Superoxide dismutase (SOD), which converts O2 .− to H2O2, is the first line of antioxidant defences. The over-expression of CuZnSOD in the liver of db/db mice has been shown to reduce hepatic ROS production and decrease blood glucose concentration.Reference Kumashiro, Tamura and Uchida 19 Our data showed that maternal obesity resulted in significantly increased offspring hepatic CuZnSOD levels but not MnSOD expression. This suggests that there is either more oxidative damage occurring or that increased CuZnSOD is preventing the damage.
Catalase and GPX1 break down H2O2 into H2O and O2. Catalase expression was not altered in offspring of obese dams while GPX1 levels were decreased. Knockout of GPX1 has been shown to render mice susceptible to acute oxidative stress.Reference Cheng, Fu, Porres, Ross and Lei 40 In addition, GPX1 levels have been shown to be decreased in streptozotocin-induced diabetes.Reference Kinalski, Sledziewski, Telejko, Zarzycki and Kinalska 41 GPX1 requires glutathione (GSH) as an electron donor and GR converts oxidized GSH back into GSH. GR expression was increased in the offspring of obese dams. This again may represent a compensatory response to increased oxidative stress or enhanced GR levels may protect against excessive ROS production.
Other mechanisms have been implicated in the aetiology of hepatic insulin resistance in this model. It has been proposed that increased sympathetic drive as evidenced by increased renal norepinephrine and liver α1- and β1-adrenergic receptor over-expression could provide a primary insult.Reference Oben, Mouralidarane and Samuelsson 8 It is possible that defects in hepatic mitochondrial electron transport chain enzyme complex activities (I, II/III and IV) could contribute to an increase in oxidative stress, as has been observed following maternal high-fat feeding.Reference Bruce, Cagampang and Argenton 9 At 12 weeks of age, the offspring of obese dams demonstrate increased adiposity.Reference Samuelsson, Matthews and Argenton 6 Therefore, this could further contribute to the development of insulin resistance. The temporal relationship between the disease phenotypes of oxidative stress, insulin resistance, increased adiposity and fatty liver remain to be addressed, and could be determined by studying the offspring of obese dams at a younger age.
With the global surge of obesity and type 2-diabetes, the number of obese pregnant women is also on the increase. As maternal obesity can have detrimental effects on the child’s long-term health, it is of great importance to understand the mechanisms underlying this association. Here, we show that maternal diet-induced obesity is associated with hepatic insulin resistance in the offspring. To our knowledge, this is the first study showing defects in both the metabolic and mitogenic modes of insulin action in the liver of the offspring of obese dams. It remains to be determined whether changes in mitochondrial function, ROS production and/or antioxidant defence is seen prior to the changes in protein expression and phosphorylation of key insulin signalling molecules.
Acknowledgements
The authors thank Adrian Wayman and Delia Hawkes at the Metabolic Research Laboratories, Institute of Metabolic Sciences, University of Cambridge, for their expert technical assistance. This study was supported in part by the British Heart Foundation (M.S. Martin-Gronert and S.E. Ozanne), the Biotechnology and Biological Science Research Council (D.S. Fernandez-Twinn) and Tommy Charity (L. Poston).
Statement of Interest
None.