Psychotic disorders are impairing, often chronic illnesses associated with increased disability and mortality (Brown, Inskip, & Barraclough, Reference Brown, Inskip and Barraclough2000; Kotov et al., Reference Kotov, Fochtmann, Li, Tanenberg-Karant, Constantino, Rubinstein and Carlson2017; Theodoridou, Rössler, Preedy, & Watson, Reference Theodoridou, Rössler, Preedy and Watson2010; Velthorst et al., Reference Velthorst, Fett, Reichenberg, Perlman, van Os, Bromet and Kotov2017). While neurobiological correlates of acute illness are often the focus of study, there is a paucity of studies examining the degree to which such correlates may relate to changes in symptoms and functioning over time. Afflicted individuals' trajectories of illness vary, characterized by the improving or worsening negative symptoms, positive symptoms (reality distortion (hallucinations and delusions) and disorganization), and cognitive impairment (Carpenter & Kirkpatrick, Reference Carpenter and Kirkpatrick1988; Fett et al., Reference Fett, Velthorst, Reichenberg, Ruggero, Callahan, Fochtmann and Kotov2019; Garver & Christensen, Reference Garver and Christensen2000; Jonas et al., Reference Jonas, Wenxuan, Callahan, Ruggero, Clouson, Reichenberg and Kotov2022; Kendler et al., Reference Kendler, Karkowski-Shuman, O'Neill, Straub, MacLean and Walsh1997). Investigating the temporal sequence of relationships between such illness factors and neurobiological correlates is critical, as understanding whether symptom exacerbation follows or precedes neurobiological changes may both provide insight into the mechanisms of such symptom progression as well as speak to the utility of neurobiological constructs in predicting future symptom changes. In the first long-term study in established psychotic illness, we examined the stability and predictive utility of mismatch negativity (MMN), which has been shown to predict first-onset of psychosis (Bodatsch et al., Reference Bodatsch, Ruhrmann, Wagner, Müller, Schultze-Lutter, Frommann and Klosterkötter2011; Hamilton, Boos, & Mathalon, Reference Hamilton, Boos and Mathalon2020; Higuchi et al., Reference Higuchi, Sumiyoshi, Seo, Miyanishi, Kawasaki and Suzuki2013; Lavoie et al., Reference Lavoie, Jack, Griffiths, Ando, Amminger, Couroupis and Nelson2018; Perez et al., Reference Perez, Woods, Roach, Ford, McGlashan, Srihari and Mathalon2014; Shaikh et al., Reference Shaikh, Valmaggia, Broome, Dutt, Lappin, Day and Bramon2012; Tateno et al., Reference Tateno, Higuchi, Nakajima, Sasabayashi, Nakamura, Ueno and Sumiyoshi2021) but is relatively understudied in later course psychotic disorders. Such an examination will aid not only in understanding the longitudinal relationships between neurobiological constructs and clinical changes, but also allow for potential prediction and prevention of relapse and rehospitalization.
The MMN is an event-related potential elicited by the presentation of a rare stimulus deviating from expectations set through the more frequent presentation of a standard stimulus (Näätänen, Reference Näätänen1995). Reduced MMN amplitude is a robust finding in psychotic disorders (Donaldson et al., Reference Donaldson, Novak, Foti, Marder, Perlman, Kotov and Mohanty2020; Erickson et al., Reference Erickson, Albrecht, Ruffle, Fleming, Corlett and Gold2017; Erickson, Ruffle, & Gold, Reference Erickson, Ruffle and Gold2016; Umbricht & Krljes, Reference Umbricht and Krljes2005) and is associated with psychotic symptoms (particularly auditory hallucinations; Donaldson et al., Reference Donaldson, Novak, Foti, Marder, Perlman, Kotov and Mohanty2020, Reference Donaldson, Larsen, Jonas, Tramazzo, Perlman, Foti and Kotov2021; Fisher et al., Reference Fisher, Grant, Smith, Borracci, Labelle and Knott2011; Fisher, Labelle, & Knott, Reference Fisher, Labelle and Knott2008, Reference Fisher, Labelle and Knott2012; Light et al., Reference Light, Swerdlow, Thomas, Calkins, Green, Greenwood and Nuechterlein2015), negative symptoms (Baldeweg, Klugman, Gruzelier, & Hirsch, Reference Baldeweg, Klugman, Gruzelier and Hirsch2004; Donaldson et al. Reference Donaldson, Larsen, Jonas, Tramazzo, Perlman, Foti and Kotov2021; Javitt, Shelley, & Ritter, Reference Javitt, Shelley and Ritter2000; Sehatpour et al. Reference Sehatpour, Avissar, Kantrowitz, Corcoran, De Baun, Patel and Silipo2020), cognitive deficits (Baldeweg et al., Reference Baldeweg, Klugman, Gruzelier and Hirsch2004; Donaldson et al., Reference Donaldson, Novak, Foti, Marder, Perlman, Kotov and Mohanty2020, Reference Donaldson, Larsen, Jonas, Tramazzo, Perlman, Foti and Kotov2021; Hermens et al., Reference Hermens, Ward, Hodge, Kaur, Naismith and Hickie2010; Kaur et al., Reference Kaur, Battisti, Ward, Ahmed, Hickie and Hermens2011; Näätänen et al., Reference Näätänen, Kujala, Kreegipuu, Carlson, Escera, Baldeweg and Ponton2011), and poor functioning (Donaldson et al., Reference Donaldson, Novak, Foti, Marder, Perlman, Kotov and Mohanty2020; Kim et al., Reference Kim, Kim, Lee, Byun, Shin, Park and Kwon2014; Light & Braff, Reference Light and Braff2005a, Reference Light and Braff2005b; Wynn, Sugar, Horan, Kern, & Green, Reference Wynn, Sugar, Horan, Kern and Green2010). In light of these effects, some have named the MMN a potential ‘break-through biomarker’ of psychosis symptoms, allowing for treating, understanding, and predicting symptoms over time (Light & Näätänen, Reference Light and Näätänen2013; Näätänen, Shiga, Asano, & Yabe, Reference Näätänen, Shiga, Asano and Yabe2015). However, while MMN shows fair reliability and stability in healthy participants (Roach et al., Reference Roach, Carrión, Hamilton, Bachman, Belger, Duncan and Addington2020a, Reference Roach, Hamilton, Bachman, Belger, Carrión, Duncan and Niznikiewicz2020b), its reliability and predictive utility in psychotic disorders over longer periods of follow-up remain unclear. A measure that fluctuates day to day (low temporal stability) will likely not be useful in predicting course, as it may depend on state factors. Conversely, a measure that is completely static over time with no variability (high temporal stability) may be most useful in predicting overall illness trajectories (i.e. a stable v. variable course). Elucidating the degree to which MMN is stable relative to symptoms with which it is often associated, as well as clarifying the utility of MMN in predicting clinical outcomes, may help to inform models of illness course and allow us to better understand ways in which reduced MMN indexes impairments over time.
Much of what we know about the predictive relationships MMN amplitude may bear with symptoms comes from studies of its utility in predicting first onset of psychosis. While literature is mixed, many report that reduced MMN predicts first onset of psychosis over up to two years (Bodatsch et al., Reference Bodatsch, Ruhrmann, Wagner, Müller, Schultze-Lutter, Frommann and Klosterkötter2011; Higuchi et al., Reference Higuchi, Sumiyoshi, Seo, Miyanishi, Kawasaki and Suzuki2013; Lavoie et al., Reference Lavoie, Jack, Griffiths, Ando, Amminger, Couroupis and Nelson2018; Perez et al., Reference Perez, Woods, Roach, Ford, McGlashan, Srihari and Mathalon2014; Shaikh et al., Reference Shaikh, Valmaggia, Broome, Dutt, Lappin, Day and Bramon2012; Tateno et al., Reference Tateno, Higuchi, Nakajima, Sasabayashi, Nakamura, Ueno and Sumiyoshi2021). Studies suggest that both biological and cognitive mechanisms contributing to psychosis differ markedly across phases of illness (Haarsma et al., Reference Haarsma, Knolle, Griffin, Taverne, Mada and Goodyer2020). Yet, longitudinal studies of MMN in patients with chronic psychotic illness are sparse and limited in span, reporting on effects over 1–2 years or less. Some have suggested that MMN in psychotic disorders may decline in amplitude and be associated with subsequent functional impairment (Kaur et al., Reference Kaur, Lagopoulos, Lee, Ward, Naismith, Hickie and Hermens2013; Salisbury, Kuroki, Kasai, Shenton, & McCarley, Reference Salisbury, Kuroki, Kasai, Shenton and McCarley2007; Shinozaki et al., Reference Shinozaki, Yabe, Sato, Hiruma, Sutoh, Nashida and Kaneko2002) or change in symptom burden (Shinozaki et al., Reference Shinozaki, Yabe, Sato, Hiruma, Sutoh, Nashida and Kaneko2002), while others suggest it may remain stable and reduced compared to healthy participants (Light et al., Reference Light, Swerdlow, Rissling, Radant, Sugar, Sprock and Braff2012; Light & Braff, Reference Light and Braff2005a, Reference Light and Braff2005b). Of these, studies that report stability of MMN over time are variable, with some finding no significant relationships between MMN across timepoints (r = 0.14; Kaur et al., Reference Kaur, Lagopoulos, Lee, Ward, Naismith, Hickie and Hermens2013) and others finding significant stability (ICCs > 0.80; Light & Braff, Reference Light and Braff2005a, Reference Light and Braff2005b; Light et al. Reference Light, Swerdlow, Rissling, Radant, Sugar, Sprock and Braff2012). Thus, it may be that MMN reductions vary across chronic illness (i.e. early v. middle v. late course). It is also possible that reductions are already maximal once the disorder is in the chronic stage. Psychotic illness is often episodic, and recurrence of symptoms and declines in functioning often precede relapse to a floridly symptomatic state, rehospitalization, and cascading effects such as loss of housing, accelerated cognitive decline, medication nonadherence, and increased familial burden of care (Chi et al., Reference Chi, Hsiao, Chen, Lee, Tsai, Lee and Yang2016; Csernansky & Schuchart, Reference Csernansky and Schuchart2002; Harvey, Loewenstein, & Czaja, Reference Harvey, Loewenstein and Czaja2013; Morriss, Vinjamuri, Faizal, Bolton, & McCarthy, Reference Morriss, Vinjamuri, Faizal, Bolton and McCarthy2013; Novick et al., Reference Novick, Haro, Suarez, Perez, Dittmann and Haddad2010; Olfson, Mechanic, Hansell, Boyer, & Walkup, Reference Olfson, Mechanic, Hansell, Boyer and Walkup1999). An understanding of factors preceding or driving such recurrence may provide more opportunities for outpatient intervention, reducing rates of rehospitalization and other negative outcomes.
Finally, while little is known about whether worsening of psychotic illness may follow MMN reduction, even fewer studies have examined longitudinally the factors predicting MMN reduction in psychotic disorders. Several studies have demonstrated that MMN is reduced following administration of N-methyl-D-aspartate receptor (NMDAR) antagonists, such as ketamine and psilocybin, which also produce psychotic-like symptoms (Rosburg & Kreitschmann-Andermahr, Reference Rosburg and Kreitschmann-Andermahr2016; Umbricht, Koller, Vollenweider, & Schmid, Reference Umbricht, Koller, Vollenweider and Schmid2002), suggesting perhaps a role for NMDAR dysfunction in the biological causes of MMN reduction. A similar role has been suggested for the involvement of NMDAR dysfunction in the development of psychotic illness (Cannon, Reference Cannon2015). Understanding the circumstances under which MMN worsens may help elucidate the mechanisms driving this reduction, and thus yield additional insight into the mechanisms driving associated symptoms and impairments.
The present study will examine the stability of MMN amplitude over a period of five years in cases with diverse psychotic disorders and never-psychotic comparison participants. Through this examination, we aim to elucidate the extent to which MMN amplitude reflects a stable neural deficit, and thus evaluate the degree to which it may have promise as a predictor of future clinical states. We seek to extend prior findings to a five-year interval in later-stage illness, and anticipate that MMN will show good temporal reliability and will remain reduced in psychotic disorders compared to never psychotic participants. In addition, in line with prior work in first onset studies, we anticipate that MMN amplitude reductions will predict worsening cognitive dysfunction, greater illness severity, impairments in everyday functioning, and auditory hallucinations. Finally, as an exploratory aim, we examine clinical, cognitive, and functional characteristics that may predict change in MMN amplitude over time. Overall, in employing this bi-directional, longitudinal approach, we hope to elucidate the sequence in which these relationships between clinical factors and MMN amplitude may play out over time.
Method
Participants
Study participants were individuals with established psychotic disorders (cases; N = 132, including schizophrenia-spectrum, mood disorders with psychosis, and other psychotic disorders), and zip-code- and demographically-matched comparison participants who were excluded only for a past history of psychosis (‘never-psychotic’, NP; N = 170). Participants were drawn from the Suffolk County Mental Health Project (Bromet et al., Reference Bromet, Kotov, Fochtmann, Carlson, Tanenberg-Karant, Ruggero and Chang2011), an epidemiologic study of first-admission psychosis. This study was approved by the Stony Brook University Institutional Review Board. Authors assert that all procedures contributing to this work comply with the ethical standards of the relevant national and institutional committees on human experimentation and with the Helsinki Declaration of 1975, as revised in 2008. The follow-up 20-years after first hospitalization for cases served as timepoint one (T1) for the present analyses, and the 25-year follow-up served as timepoint two (T2). Only participants with usable EEG data at both timepoints were included (see online Supplement for data exclusions). MMN in cases and NP at T1 in a partially overlapping sample has been reported (Donaldson et al., Reference Donaldson, Novak, Foti, Marder, Perlman, Kotov and Mohanty2020).
Measures
Diagnosis was determined through the consensus of study psychiatrists using the structured clinical interview for DSM-IV (SCID-IV; First, Spitzer, Gibbon, and Williams, Reference First, Spitzer, Gibbon and Williams2001). Psychotic symptoms were assessed using the Scale for the Assessment of Positive Symptoms (SAPS; Andreasen, Reference Andreasen1984), negative symptoms using the Scale for the Assessment of Negative Symptoms (SANS; Andreasen, Reference Andreasen1989), both rated from 0 (none) to 5 (severe). As most hallucinations occur in the auditory modality (McCarthy-Jones et al., Reference McCarthy-Jones, Smailes, Corvin, Gill, Morris, Dinan and Dudley2017), and relationships between auditory MMN and psychotic symptoms are often constricted to this symptom, auditory hallucinations were also examined using the SAPS (Andreasen, Reference Andreasen1984), rated from 0 (none) to 5 (severe). Illness severity was rated by trained clinical interviewers using the Global Assessment of Functioning (GAF; Hall, Reference Hall1995), from 1 (highest severity of symptoms or dysfunction) to 90 (no symptoms and excellent functioning). Everyday functioning was evaluated by clinical interviewers and rated using the Quality of Life Scale interviewer rating of impairment (QLS; Heinrichs, Hanlon, and Carpenter, Reference Heinrichs, Hanlon and Carpenter1984) from 1 (most impairment) to 6 (least impairment). See online Supplement for measure reliability.
Cognitive functioning was assessed via a neuropsychological testing battery in which participants completed the Controlled Oral Word Association Test (Ruff, Light, Parker, & Levin, Reference Ruff, Light, Parker and Levin1996), Verbal Paired Associates and Visual Reconstruction from the Wechsler Memory Scale-Revised (Wechsler, Reference Wechsler2012), Symbol-Digit Modalities, Letter-Number Sequencing, and Vocabulary from the Wechsler Adult Intelligence Scale-R (Silverstein, Reference Silverstein1982), Trails A and B (Reitan, Reference Reitan1955), and the Stroop Test (Trenerry, Crosson, DeBoe, & Leber, Reference Trenerry, Crosson, DeBoe and Leber1989). A composite score converted to the IQ scale has been created in prior studies using a one-factor latent variable model (described by Jonas et al., Reference Jonas, Wenxuan, Callahan, Ruggero, Clouson, Reichenberg and Kotov2022) and was used to reflect overall cognitive ability.
Task
The MMN task consisted of 2458 tones presented at an interval of 500 ms, at 78 dB and 633 Hz, with 10 ms rise/fall. Auditory stimuli were presented while participants completed an unrelated visual task (Mathalon, Roach, & Ford, Reference Mathalon, Roach and Ford2010). 80% of tones were presented for 50 ms at 633 Hz (‘standard’ tones), while 10% were presented for 100 ms at 633 Hz to elicit the duration-MMN (MMN-D) and 10% were presented for 50 ms at 1000 Hz to elicit the frequency-MMN (MMN-F).
Psychophysiological Data
An ActiveTwo BioSemi system was used to acquire continuous EEG (BioSemi, Amsterdam, Netherlands). An extension of the international 10/20 system was used to place 34 scalp electrodes. The sampling rate was 1024 Hz, digitized at 24-bit resolution and referenced to a common mode sense active electrode forming a monopolar channel. Horizontal and vertical electrooculogram were recorded by electrodes placed above and below and at the outer canthi of each eye.
Brain Vision Analyzer was used for offline data analyses (Brain Products, Munich, Germany). Data were referenced to linked mastoids and band-pass filtered from 0.1 to 30 Hz. Eye movements were removed using the Gratton-Coles ocular correction algorithm (Gratton, Coles, & Donchin, Reference Gratton, Coles and Donchin1983), and artifact rejection was applied trial-wise based on a 50 + mV step between trials or 75 mV difference within trials. A 200-ms pre-stimulus window was used for baseline correction. ERPs were stimulus-locked to onset of tones, and difference waves (deviant minus standard) were computed at electrode Fz, where the MMN is often maximal and where it has been scored in previous studies with this cohort (Donaldson et al., Reference Donaldson, Novak, Foti, Marder, Perlman, Kotov and Mohanty2020, Reference Donaldson, Larsen, Jonas, Tramazzo, Perlman, Foti and Kotov2021; Duncan et al., Reference Duncan, Barry, Connolly, Fischer, Michie, Näätänen and Van Petten2009; Sinkkonen & Tervaniemi, Reference Sinkkonen and Tervaniemi2000). The MMN occurred on average 25 ms later at T2; this was addressed by utilizing semi-automatic peak detection from the difference wave to score MMN-D and MMN-F for each subject as the 50 ms area under the peak.
Analyses
Analyses were completed using IBM SPSS (Version 26.0, IBM, Armonk, NY) and the R programming environment (Team, 2022) using ggplot2 (Wickham, Reference Wickham2011), readxl (Wickham et al., Reference Wickham, Bryan, Kalicinski, Valery, Leitienne, Colbert and Bryan2019), and lavaan (Rosseel, Reference Rosseel2012) packages. All analyses described below were completed separately for MMN-D and MMN-F.
Sample characteristics
Differences between cases and NP in demographic variables were queried using χ2 and independent samples t test models. 56.8% of cases were using antipsychotic medications and impacts of medication on MMN were examined.
Timepoint and group effects
Bivariate Pearson correlations were used to examine stability in MMN amplitude and clinical outcomes between T1 and T2. Paired t tests were used to query differences between T1 and T2 scores on each measure. Next, group differences were examined at each timepoint using t tests and one-way ANOVAs. In the full sample, differences were explored between cases and NP participants, while amongst cases, differences in amplitude at each timepoint were examined based on psychotic disorder diagnosis (schizophrenia-spectrum v. mood disorders v. other psychosis).
Correlations
Correlations were first computed at each timepoint between MMN amplitude and clinical variables at that timepoint. Next, we examined lagged associations between MMN and clinical variables: MMN at T1 with clinical variables at T2 and clinical variables at T1 with MMN at T2. A false discovery rate of 0.10 was used to confirm that findings were robust to effects of multiple comparisons using the Benjamini-Hochberg procedure (Benjamini & Hochberg, Reference Benjamini and Hochberg1995).
Prediction models
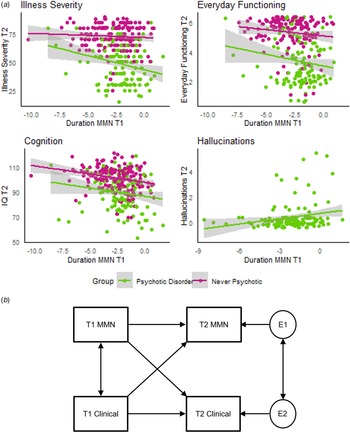
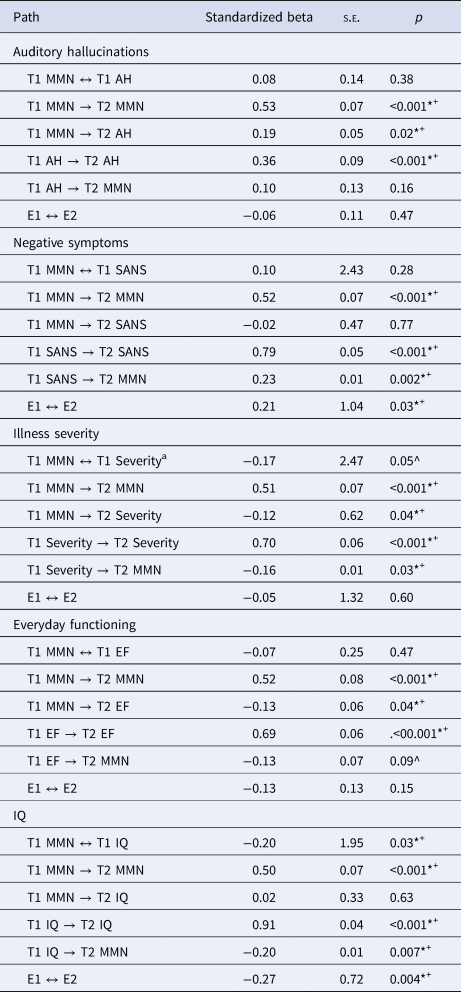
Where lagged correlations were significant, structural equation models were fit for each clinical variable of interest. Cross-lagged models were employed to simultaneously test the prediction of clinical variables by MMN and the prediction of MMN by clinical variables. Specifically, a path model was specified wherein T2 MMN and clinical variables were jointly predicted by T1 MMN and clinical variables. This model is depicted in Fig. 1b. To evaluate the utility of MMN in predicting clinical outcomes in psychosis, prediction analyses were completed in cases.
Predictive relationships. Panel A: Scatterplot of relationships between mismatch negativity (MMN) amplitude at timepoint one (T1) and clinical outcomes at timepoint two (T2) in cases with psychotic disorders and never-psychotic comparison participants. MMN amplitude is depicted in microvolts. Everyday functioning and Hallucinations are depicted graphically with an added random jitter between −0.4 and 0.4 in order to better visualize the spread of scores on Likert-type items. Hallucinations are depicted in psychotic disorders only due to a lack of variance in never psychotic participants. Illness Severity was coded such that lower scores indicate greater severity. Panel B: Graphical representation of the cross-lagged panel model estimated in structural equation models. T1, timepoint one; T2, timepoint 2; MMN, mismatch negativity; E, error/residual. Clinical refers to each of the clinical variables estimated in structural equation models presented in Table 3.

Results
Sample characteristics
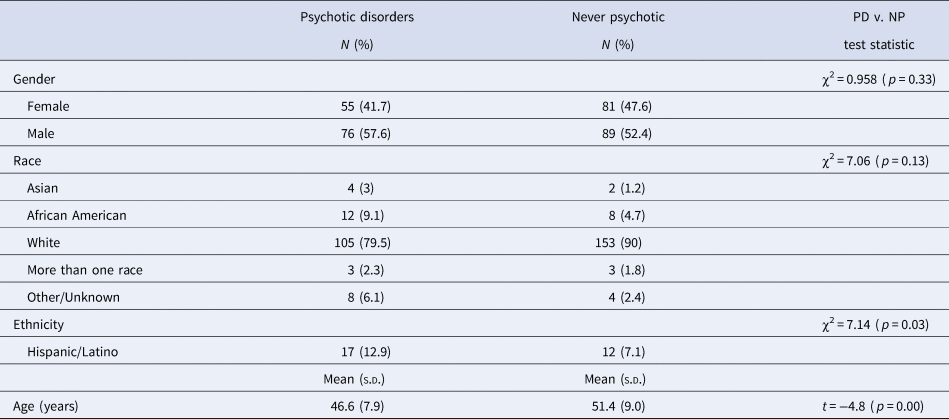
Demographic and medication information is presented in Table 1. Cases and NP differed modestly on age and ethnicity; impact of their inclusion on prediction models is described below. Groups did not differ on gender or race.
Sample characteristics at T1

PD, psychotic disorders; NP, never psychotic; s.d., standard deviation.
Timepoint and group effects
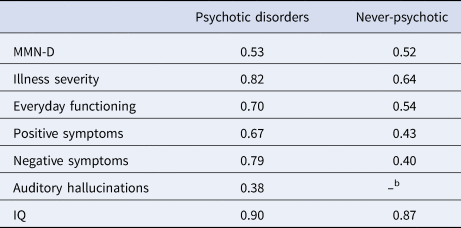
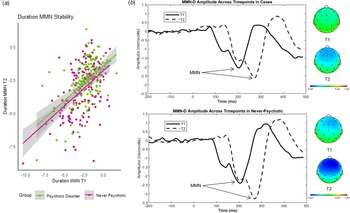
MMN-D exhibited good temporal stability, with significant correlations between amplitude at T1 and at T2 in cases (r = 0.53, p < 0.001) and NP (r = 0.52, p < 0.001). Relative to MMN-D, MMN-F exhibited comparatively poor stability, both in cases and NP participants. Stability estimates of all study variables are presented in Table 2; scatterplots of MMN-D amplitude stability are shown in Fig. 2; MMN-F stability is shown in online Supplementary Fig. S1. Descriptive statistics for all study variables, as well as T1 v. T2 comparisons, are displayed in online Supplemental Table S1.
Five-year stabilitya

a Pearson correlations between T1 and T2 scores.
b Auditory hallucinations lacked variance in the never-psychotic group necessary to calculate stability.
Note: all correlations are significant at p < 0.001.
Duration mismatch negativity T1 – T2. Panel A: Scatterplot of test-retest correlations for duration mismatch negativity (MMN-D) amplitude between timepoint one (T1) and timepoint two (T2) in psychotic disorders and never-psychotic comparison participants. Amplitude is depicted in microvolts, time is depicted in milliseconds (ms). Panel B: Waveforms (left) depicting duration mismatch negativity (MMN-D) amplitude in microvolts in cases (top) and never-psychotic comparison participants (bottom) at T1 (timepoint one; solid line) and T2 (timepoint two; dashed line) at electrode Fz. Topographies (right) depict amplitude across electrode sites in the 50 ms window where MMN is maximal. Note that average latency of the MMN response is 25 ms later at T2; head-maps are thus depicting different time windows in order to illustrate topography of maximal MMN amplitude at each timepoint.

MMN-D waveforms and topographies are presented in Fig. 2. At each timepoint, MMN-D was significantly lower in cases than NP (T1: d = 0.41, p = 0.003, T2: d = 0.34, p = 0.001). Notably, in no instance did MMN-D amplitude amongst cases differ based on psychotic disorder diagnosis (T1: F (2,127) = 0.647, p = 0.525, T2: F (2,127) = 1.41, p = 0.248). In addition, MMN amplitude did not differ significantly in cases on v. off antipsychotic medication (p = 0.09). Thus, all cases were treated as a single group in subsequent analyses. In addition to exhibiting poor stability across study waves, MMN-F did not differ significantly between cases and NP at T1 (F (1,300) = 1.20, p = 0.274). Thus, subsequent analyses focused on MMN-D. Results for MMN-F are included in online Supplement.
Correlations
Concurrent correlations between MMN and clinical variables at T1 and T2 are presented in online Supplemental Table S2. Lagged correlations with MMN-D are depicted in online Supplemental Table S3. In cases, MMN-D at T1 was associated with illness severity, everyday functioning, and auditory hallucinations at T2. Conversely, illness severity, negative symptoms, and IQ at T1 were associated with MMN-D at T2. All significant lagged correlations survived correction for multiple comparisons at a false discovery rate of 0.10. Scatterplots of associations between T1 MMN-D and T2 clinical variables are presented in Fig. 1a. Lagged correlations with MMN-F are included in online Supplemental Table S4.
Prediction models
The cross-lagged model presented in Fig. 1b was specified for each clinical variable of interest. Results in cases are displayed in Table 3. Across these models, T1 MMN was a significant predictor of T2 auditory hallucinations, everyday functioning, and illness severity, while T2 MMN was predicted by T1 IQ, illness severity, and negative symptoms. The inclusion of age and ethnicity as predictors did not impact these findings.
Cross lagged panel models

T1, Timepoint one; T2, Timepoint two; MMN, mismatch negativity; AH, auditory hallucinations; SANS, Scale for the Assessment of Negative Symptoms total negative symptom score; GAF, Global Assessment of Functioning; E1 & E2, Error terms one and two represented in Fig. 1b.
a Illness Severity was coded such that lower scores indicate greater severity.
*Significant at the level of p < 0.05. ^Approaching significance. + Path significant at p < 0.05 after controlling for age and ethnicity.
Discussion
Psychotic illness is extremely impairing, yet our understanding of the sequence with which illness progression relates to common neurobiological correlates is lacking. MMN shows success as a predictor in first episode psychosis and has robust clinical relationships cross-sectionally, and thus is an understudied but promising candidate for prediction later in illness. The present study addresses this important gap to further our understanding of the stability and predictive utility of MMN over time. In particular, we demonstrate that MMN is stable for up to five years, both in psychotic disorders and never-psychotic participants. We further demonstrate that reduced MMN in psychotic disorders remains stable across this interval, with significant differences between cases and never-psychotic participants at both timepoints and no differences amongst diagnostic groups. Finally, we shed light on the particular, bidirectional predictive relationships that exist amongst MMN and clinical features in psychotic disorders over five years. Of note, effects in the present study were unique to MMN-D. Consistent with prior reports (Michie et al., Reference Michie, Budd, Todd, Rock, Wichmann, Box and Jablensky2000), this suggests that tasks eliciting the MMN-D may have most utility in this population and underscores the potential importance of neural mechanisms supporting duration, but not pitch, deviance detection as etiological mechanisms in psychosis.
Stability is an important metric in establishing reliable neural markers of illness; however, many measures underperform in this regard (Elliott et al., Reference Elliott, Knodt, Ireland, Morris, Poulton, Ramrakha and Hariri2020). Research on the identification of reliable neural measures has focused on EEG-based measures because they are easily recorded, accessible, and cost-effective (McLoughlin, Makeig, & Tsuang, Reference McLoughlin, Makeig and Tsuang2014). Relationships between MMN amplitude across timepoints spanning five years suggests that it reflects a temporally stable neural marker that is suitable for use as a predictor of future psychosis symptoms, as it is not likely to fluctuate in a purely state-like manner. While the MMN appears to be less stable than clinical measures examined in the present study, stability measures for this ERP replicate prior studies in healthy individuals (Roach et al., Reference Roach, Carrión, Hamilton, Bachman, Belger, Duncan and Addington2020a) and in schizophrenia over shorter intervals (Light et al., Reference Light, Swerdlow, Rissling, Radant, Sugar, Sprock and Braff2012; Light & Braff, Reference Light and Braff2005a, Reference Light and Braff2005b), and extends these findings to a long period of follow up of individuals with diverse psychotic disorders. Though there are not, to our knowledge, established benchmarks for ERP stability in psychosis, stability estimates in the present study are consistent to those reported in work with other ERPs commonly implicated in psychosis (Foti et al., Reference Foti, Perlman, Hajcak, Mohanty, Jackson and Kotov2016; Weinberg & Hajcak, Reference Weinberg and Hajcak2011).
Our finding that MMN amplitude is predictive of auditory hallucinations five years later echoes cross-sectional relationships (Donaldson et al., Reference Donaldson, Novak, Foti, Marder, Perlman, Kotov and Mohanty2020, Reference Donaldson, Larsen, Jonas, Tramazzo, Perlman, Foti and Kotov2021; Fisher et al., Reference Fisher, Grant, Smith, Borracci, Labelle and Knott2011; Fisher, Labelle, & Knott, Reference Fisher, Labelle and Knott2012), and is consistent with studies showing MMN predicts first onset psychosis (Bodatsch et al., Reference Bodatsch, Ruhrmann, Wagner, Müller, Schultze-Lutter, Frommann and Klosterkötter2011; Higuchi et al., Reference Higuchi, Sumiyoshi, Seo, Miyanishi, Kawasaki and Suzuki2013; Lavoie et al., Reference Lavoie, Jack, Griffiths, Ando, Amminger, Couroupis and Nelson2018; Tateno et al., Reference Tateno, Higuchi, Nakajima, Sasabayashi, Nakamura, Ueno and Sumiyoshi2021), which is often characterized by the emergence of perceptual symptoms (Mbewe et al., Reference Mbewe, Haworth, Welham, Mubanga, Chazulwa, Zulu and McGrath2006; Rajapakse, Garcia-Rosales, Weerawardene, Cotton, & Fraser, Reference Rajapakse, Garcia-Rosales, Weerawardene, Cotton and Fraser2011; Tandon, Nasrallah, & Keshavan, Reference Tandon, Nasrallah and Keshavan2009). Research posits the MMN as a neural representation of prediction error (PE), a neural signal theorized to arise in response to expectancy violations (Garrido et al., Reference Garrido, Friston, Kiebel, Stephan, Baldeweg and Kilner2008; Garrido, Kilner, Stephan, & Friston, Reference Garrido, Kilner, Stephan and Friston2009; Wacongne, Reference Wacongne2016). Findings are thus also consistent with evidence linking auditory hallucinations to reduced PE in response to sensory input (Friston, Reference Friston2005; Nazimek, Hunter, & Woodruff, Reference Nazimek, Hunter and Woodruff2012; Sterzer et al., Reference Sterzer, Adams, Fletcher, Frith, Lawrie, Muckli and Corlett2018), and support the notion that aberrant PE in psychotic illness may be implicated in the development and maintenance of such symptoms over time, starting potentially prior to formal illness onset and contributing to first onset, and contributing to worsening symptom episodes later in illness trajectories. To our knowledge, this is the first empirical evaluation of such effects on this time scale in mid-course psychotic disorders. Such findings further our understanding of the links between neurobiological factors and the emergence of associated clinical symptoms, implicating neural mechanisms of predictive signaling as important in the maintenance of perceptual symptoms over time. Furthermore, these present findings suggest that MMN may be a useful tool in forecasting the emergence or worsening of perceptual symptoms, at which time increased monitoring or outpatient attention may be warranted.
MMN amplitude in the present study was also a significant predictor of worsening illness severity and functioning over five years. This is consistent with cross-sectional work reporting relationships between MMN and global, everyday, and social functioning (Donaldson et al., Reference Donaldson, Novak, Foti, Marder, Perlman, Kotov and Mohanty2020; Kim et al., Reference Kim, Kim, Lee, Byun, Shin, Park and Kwon2014; Light & Braff, Reference Light and Braff2005a, Reference Light and Braff2005b; Wynn et al., Reference Wynn, Sugar, Horan, Kern and Green2010). These effects may imply a link between reduced PE and subsequent poor functioning. It may be the case that aberrations in predictive processing lead directly to poor functioning: for instance, a failure to update expectations regarding ones' environment in response to new sensory information may lead to less effective decision making. It is also possible that reduction in PE is a mechanism primarily of psychotic symptom development (Friston, Reference Friston2005; Nazimek et al., Reference Nazimek, Hunter and Woodruff2012; Sterzer et al., Reference Sterzer, Adams, Fletcher, Frith, Lawrie, Muckli and Corlett2018), which in turn leads to poor functioning. Additional research in this area is needed in order to tease apart the particular relationships amongst these biological and clinical phenomena, as well as to evaluate the practical utility of such information.
Finally, in addition to examining its utility as a predictor, the present study sought to elucidate the clinical circumstances preceding reduced MMN amplitude. In particular, negative symptoms, cognition, and illness severity were predictive of MMN five years later. These findings would suggest that, while MMN is predictive of future auditory hallucinations and illness severity, individuals in whom this effect may be observed may present with increased negative symptoms, cognitive deficits, and greater illness severity. This is consistent with associations between poor cognitive functioning and global functioning (Lepage, Bodnar, & Bowie, Reference Lepage, Bodnar and Bowie2014; McGurk & Meltzer, Reference McGurk and Meltzer2000; Nuechterlein, Ventura, Subotnik, & Bartzokis, Reference Nuechterlein, Ventura, Subotnik and Bartzokis2014) as well as negative symptoms (Addington, Addington, & Maticka-Tyndale, Reference Addington, Addington and Maticka-Tyndale1991; Heydebrand et al., Reference Heydebrand, Weiser, Rabinowitz, Hoff, DeLisi and Csernansky2004; O'Leary et al., Reference O'Leary, Flaum, Kesler, Flashman, Arndt and Andreasen2000). Indeed, MMN amplitude relies on the formation of expectations that are violated by deviant tones, and many theories of MMN generation emphasize the role of cognitive processes such as working memory in predictive processes (Javitt, Doneshka, Grochowski, & Ritter, Reference Javitt, Doneshka, Grochowski and Ritter1995). Biased cognition is presumed to lead to misperception and/or misinterpretation of events, which then may give rise to symptoms of reality distortion (Sheffield, Karcher, & Barch, Reference Sheffield, Karcher and Barch2018). The present findings lend some preliminary support to this idea as it may play out over a five-year period, illustrated in online Supplementary Fig. S2, wherein patients may first experience cognitive decline, associated negative symptoms, and increased severity, subsequently reduced MMN, and ultimately an exacerbation of psychotic symptoms and increased severity and functional impairments. Notably, this model represents a hypothesized pathway through which MMN deficits and associated dysfunction may occur, and warrants additional study with more timepoints of data. Though preliminary, this model may be consistent with the potential emergence of cognitive symptoms much earlier in illness than both reliable neural deficits and formal psychotic symptoms, such as work suggesting childhood cognitive impairment may precede formal psychotic illness (Reichenberg et al., Reference Reichenberg, Caspi, Harrington, Houts, Keefe, Murray and Moffitt2010). Such a pathway would carry implications for our understanding of the course and etiology of psychotic illness, and represents a future direction for further study.
Strengths of this study include our large, mixed diagnosis sample of individuals with psychotic disorders, allowing for the examination of changes in specific symptoms which do not respect diagnostic boundaries and which negatively impact the lives of those experiencing them chronically. In addition, our use of two timepoints of EEG spanning five years reflects the longest period of follow up to our knowledge. Within this, our bidirectional examination of predictive relationships allows us to speak to the predictive utility of MMN over greater periods of time in mid-course psychotic illness than previous studies, and to examine predictors of MMN worsening and consequences linked to poor MMN. A limitation is the relatively low variance in hallucinations, which is common even in chronically ill samples. We were able to detect hypothesized links between auditory MMN and auditory hallucinations, nevertheless. Future studies may build upon the present results by recruiting individuals based on presence of particular symptoms. It is also notable that effect sizes in the present study are small. This is expectable in brain – behavior relationships, as research suggests that even significant variability in neural measures commonly relates only to a fraction of variance in clinical phenotypes (Patrick et al., Reference Patrick, Venables, Yancey, Hicks, Nelson and Kramer2013; Paulus & Thompson, Reference Paulus and Thompson2019). Effects of this size are nevertheless shown to be useful in furthering our understanding of the etiology of these symptoms (Funder & Ozer, Reference Funder and Ozer2019), though it is important to note that observed predictive effects of MMN amplitude are likely several of many factors which may precede the worsening of symptoms and functioning. Another limitation is the lack data from more than two timepoints, which would allow a more direct examination of state- v. trait-like properties of MMN and its predictive power, and a more detailed characterization of MMN trajectories. In addition, there is a latency shift between T1 and T2. Studies suggest that ERP latency, including of the MMN, may increase with age (Bertoli, Smurzynski, & Probst, Reference Bertoli, Smurzynski and Probst2002; Cooper, Todd, McGill, & Michie, Reference Cooper, Todd, McGill and Michie2006; Horváth et al., Reference Horváth, Czigler, Birkás, Winkler and Gervai2009; McEvoy, Pellouchoud, Smith, & Gevins, Reference McEvoy, Pellouchoud, Smith and Gevins2001; Polich, Reference Polich1997). Thus, the somewhat later latency at T2 was not unexpected. Further exploration of this effect was outside the scope of the present study, but may represent an important area for future research. Finally, though MMN deficits appear to be most robust in psychotic illness, there is mixed evidence for reduced MMN in other clinical conditions (Näätänen et al., Reference Näätänen, Kujala, Escera, Baldeweg, Kreegipuu, Carlson and Ponton2012). However, amongst axis I disorders, MMN proves useful in differentiating psychosis from potential rule-out diagnoses, such as Alzheimer's or dementia (Baldeweg & Hirsch, Reference Baldeweg and Hirsch2015; Näätänen et al., Reference Näätänen, Kujala, Escera, Baldeweg, Kreegipuu, Carlson and Ponton2012). NP subjects in the present study were not excluded for non-psychotic psychopathology. Thus, results demonstrate reduced MMN relative to a representative, rather than ‘psychiatrically healthy’, population. Future research with varying psychiatric illness may further clarify this point.
In sum, duration MMN appears to reflect a stable neural deficit in psychotic disorders over up to five years, and emerged as a significant predictor of illness severity, everyday functioning, and auditory hallucinations in cases with psychotic disorders. MMN tends to decline in individuals with greater negative symptoms, cognitive deficits, and illness severity. This suggests a pathway of dysfunction that informs illness course and which will be important for future study. Objective markers of such mechanisms allowing us to predict these symptom changes may provide more opportunities for outpatient intervention, reducing rehospitalization and other negative outcomes.
Supplementary material
The supplementary material for this article can be found at https://doi.org/10.1017/S0033291722003075
Acknowledgements
The authors gratefully acknowledge Dr. Evelyn Bromet, cohort founder, as well as extend to her our thanks for comments on an earlier version of the manuscript. Special thanks to the support of the participants and mental health community of Suffolk County for contributing their time and energy to this project. Authors are additionally indebted to dedicated efforts of study coordinators, research assistants, interviewers, and psychiatrists.
Financial support
This project was supported by the National Institute of Mental Health (grant numbers MH094398 & MH110434 to R.K. and MH125455 to K.R.D.). The content is solely the responsibility of the authors and does not necessarily represent the official views of the National Institutes of Health.
Conflict of interest
None.