
Introduction
Group III nitride semiconductors, including GaN, InN, and AlN, have been recognized in both theory and practice as one of the most useful materials in electronic devices, such as light-emitting diodes (LEDs) and power-electronic devices.[Reference Toyoura, Tsujimura, Goto, Hachiya, Hagiwara and Ito1–Reference Oshima and Fujita3] However, fewer studies about group II nitride semiconductors have been published than about group III nitrides.[Reference Toyoura, Tsujimura, Goto, Hachiya, Hagiwara and Ito1–Reference Oshima and Fujita3] Our present study focuses on group II semiconductors, i.e., zinc nitride (Zn3N2) thin films, composed of inexpensive and earth-abundant Zn and N elements. Zn3N2 has a cubic anti-bixbyite crystal structure[Reference Partin, Williams and O'Keefee4] and is highly transparent in the visible to near-infrared regions because it has a wide band gap and large refractive index. Therefore, Zn3N2 can be utilized as a transparent electrode in solar cells or GaN-LEDs.
Futsuhara et al. reported that synthetic polycrystalline Zn3N2 films exhibit a high electron mobility of ~100 cm2/Vs with the n-type character at room temperature.[Reference Futsuhara, Yoshioka and Takai5]The highest reported mobility is 395 cm2/Vs.[Reference Wu, Tiedje, Alimohammadi, Bahrami-Yekta, Masnadi-Shirazi and Wang6] Cao et al. explained that such a high mobility is attributed to the small effective electron mass of Zn3N2.[Reference Cao, Yamaguchi, Ninomiya and Yamada7, Reference Cao, Sato, Ninomiya and Yamada8] However, several studies showed that the optical band gap of Zn3N2 films varies from 1.1 to 3.2 eV.[Reference Kuriyama, Takahashi and Sunohara9–Reference Long, Dai, Yu, Huang and Han12] Such a large inconsistency in the optical band gap has been explained by the presence of vacancies and interstitial nitrogen defects introduced in the band gap during film growth.[Reference Long, Dai, Yu, Huang and Han12] Theoretical calculations recently suggested that it can be attributed to the influence of the Burstein–Moss (BM) effect and choice of absorption spectra range used for the Tauc plots.[Reference Kumagai, Harada, Akamatsu, Matsuzaki and Oba13–Reference Moss15]
In practice, oxygen is easily incorporated into Zn3N2 films during synthesis.[Reference Moss15] This is attributed to the low reactivity of nitrogen species during sputtering.[Reference Ayouchi, Casteleiro, Santos and Schwarz10] Oxygen from the residual gas such as water vapor in the sputtering chamber more easily reacts with zinc. The existence of oxygen impurities affects the electrical and optical properties of Zn3N2 films, which can act as electron donors. Therefore, it is of key importance for the fabrication of Zn3N2 films with good functionality to determine the method to control the oxygen content. To overcome this problem and enhance the nitrogen reactivity, another approach is needed. One effective approach is to use other inert sputtering gases, such as He and Ne, which is expected to improve the electron temperature of the sputtering gas and enhance the reactivity of nitrogen species.
In this study, we investigated the influence of the sputtering process on structural, electrical, and optical properties by changing the type of the sputtering gas for reactive RF magnetron sputtering. We discuss the correlation between the fabrication process and film properties.
Experimental details
The Zn3N2 films were deposited on synthesized quartz glass substrates at 473 K using reactive RF magnetron sputtering and a zinc metal target (3 inch in diameter). The base pressure was <5 × 10⁻⁴ Pa, and the total pressure was maintained at 2.0 Pa. The power supply was 50 W. The distance between the target and substrate was 60 mm. The maximum vertical magnetic field strength at the magnetron target surface was set to 1000 G. To study the influence of the sputtering process on the film properties, the sputtering gas was changed from Ar, Ne to He. Nitrogen was used as the reactive gas and the N2 flow ratio [N2/(N2 + G sg)] was 20%, 40%, 60%, 80%, and 100%, where G sg is the sputtering gas flow. All the gases are used with the purity of 99.999%.
The film thickness was measured using a surface profiler (Sloan DEKTAK3). The structural properties were analyzed by x-ray diffraction (XRD) measurements using Cu Kα1 radiation at 40 kV and 20 mA (Shimadzu XRD-6000). More precise structural analyses were carried out by transmission electron microscopy (TEM, JEOL, JEM-4010, 400 kV). Planar and cross-sectional samples were prepared by mechanical thinning followed by argon ion milling with the precisely controlled incident angle and energy, which were optimized to prevent damaging the thin samples. The resistivity R, Hall mobility μ, and carrier density n were measured at room temperature using the four-point probe method and Hall effect measurement in van der Pauw geometry with a 0.32 T magnet (Bio-Rad HL5500PC). The transmittance (T) and reflectance (R) of the films were measured using an optical spectrophotometer (UV-3150, Shimadzu) in the spectral range of 200–2500 nm. The chemical states of the films were analyzed by x-ray photoelectron spectroscopy (XPS; AXIS-ULTRA, Kratos Analytical). The total energy resolution was set to 0.48 eV. All obtained spectra were calibrated to a Zn 2p peak.
Results and discussion
Structural properties
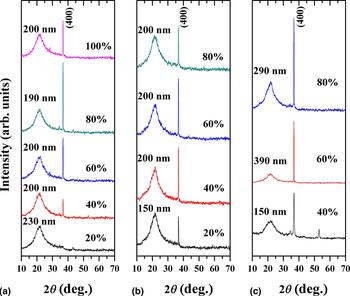
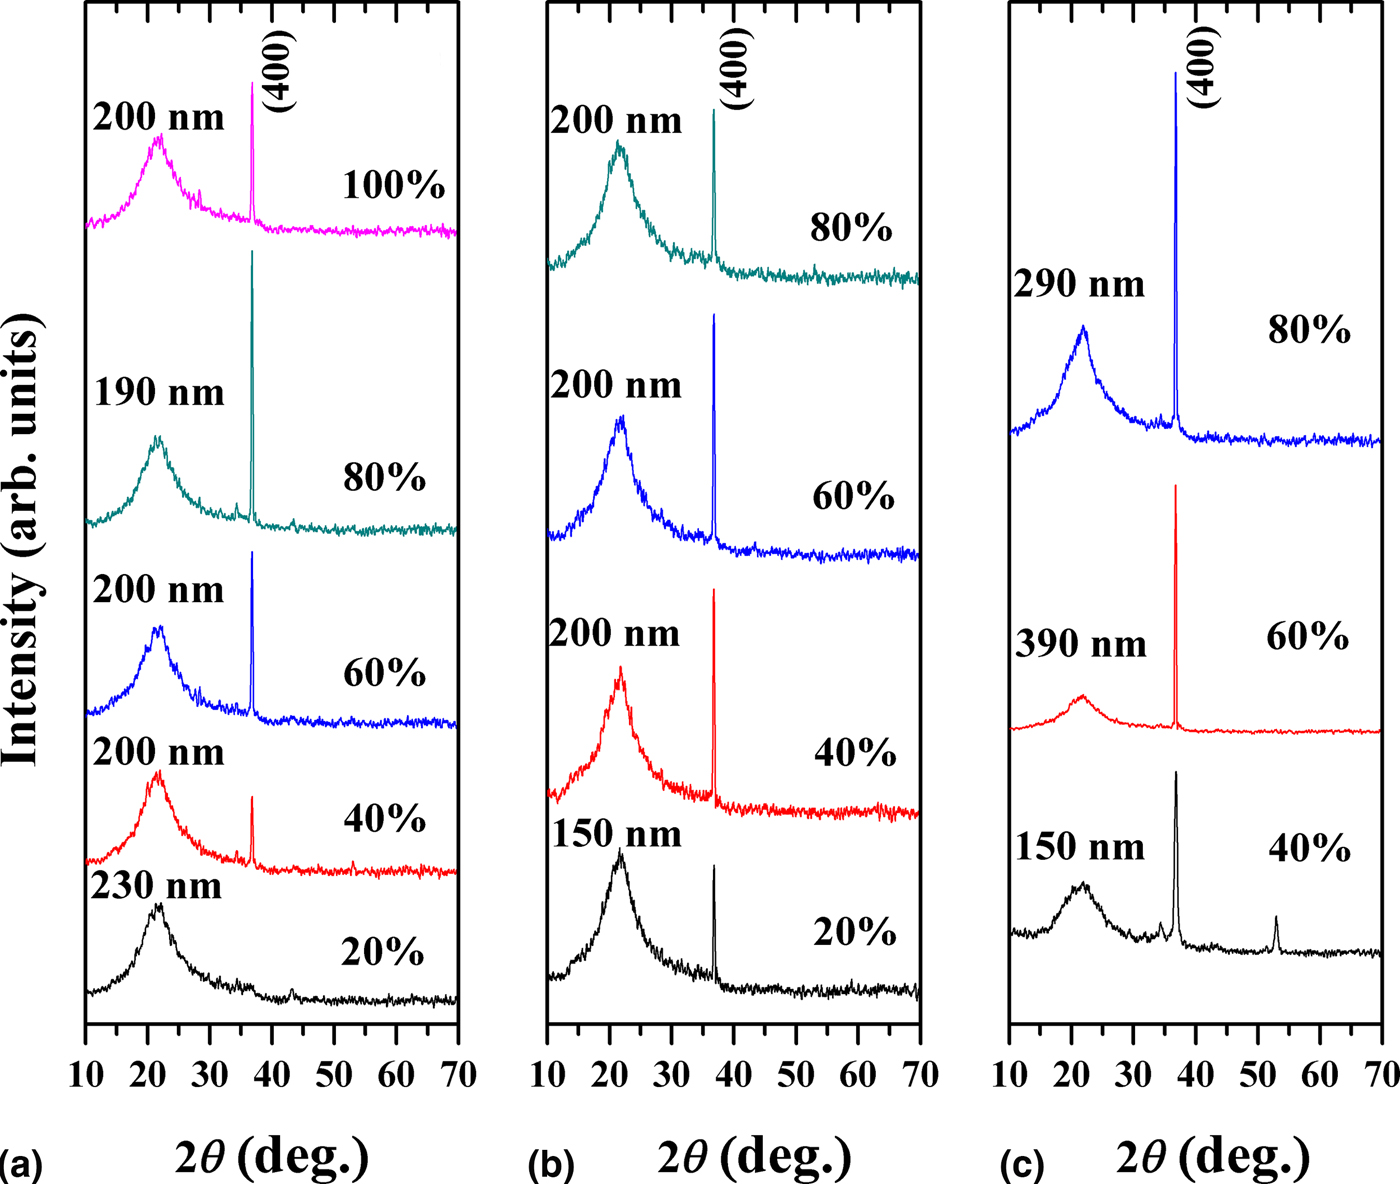
The XRD patterns show that the Zn3N2 films were successfully fabricated by reactive sputtering in Fig. 1. The peak at 2θ ≈ 36.8 is from the diffraction of the Zn3N2 (400) plane,[16] which matches the standard diffraction peaks well, implying that the films have polycrystalline structures with a strong preferential orientation of the a-axis. Diffraction from zinc metal or other zinc nitrides/oxides could not be detected.
XRD patterns of (a) Zn3N2 films deposited using Ar sputtering gas, (b) Zn3N2 films deposited using Ne sputtering gas, and (c) Zn3N2 films deposited using He sputtering gas. Film thickness is listed on the left side.
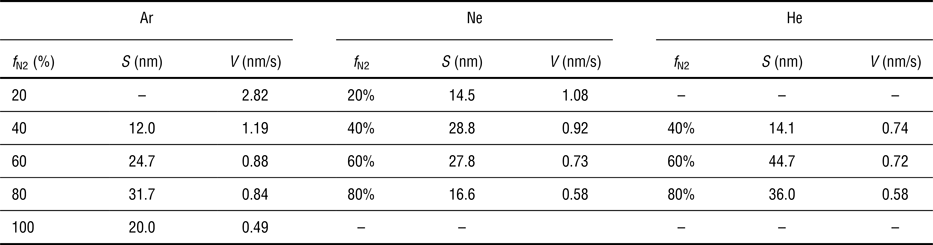
The mean crystallite size of the Zn3N2 films in the direction normal to the surface was evaluated using the Scherrer formula in Table 1. The Zn3N2 films deposited using He sputtering gas have maximum grain sizes. This can be explained qualitatively from two aspects: (1) improved the reactivity of nitrogen species; (2) the low deposition rate under He sputtering gas. Compared with Ar and Ne, He has the largest ionization energy and smallest ionic radius. This produces a large discharge impedance and a high electron temperature during sputtering. A high electron temperature means that more electrons with an energy larger than the nitrogen dissociation energy are produced, and then lead to more nitrogen species by electron–nitrogen collision processes. This improves the reactivity of the nitrogen species. XPS analysis shows that the nitrogen concentration in Zn3N2 films deposited by using He is higher than ones deposited by using Ar or Ne (in Table 2). On the other hand, the deposition rates are relatively low for Zn3N2 films deposited by using He, compared with those deposited by using Ar or Ne as shown in Table 1. A relatively low deposition rate means a long time for sputtered species to diffuse laterally on the film surface, and this leads to an improve crystallinity for Zn3N2 films. It is worthy to note that the deposition rate generally depends on the sputtering yield, the mean free path of the sputtered particles, and the sticking factor of the sputtered particles onto the film surface.[Reference Chapman17] Here the sputtering yield is considered to mainly affect the deposition rate because other sputtering conditions including the distance between the target and the substrates are the same for the Zn3N2 films deposited by using the different inert gases. The low deposition rate for Zn3N2 films deposited by using He can be explained by the low sputtering yield because the relatively light He atoms are used to sputter the heavy Zn atoms.
Calculated grain size (S) and deposition rates (V) of Zn3N2 films as a function of the N2 flow ratios (f N2) deposited using different inert gases.

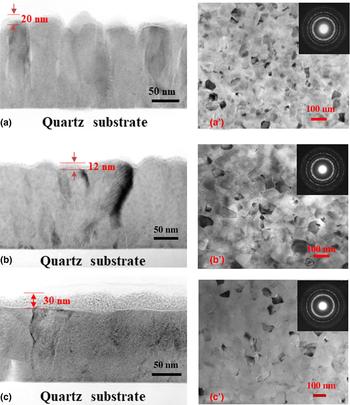
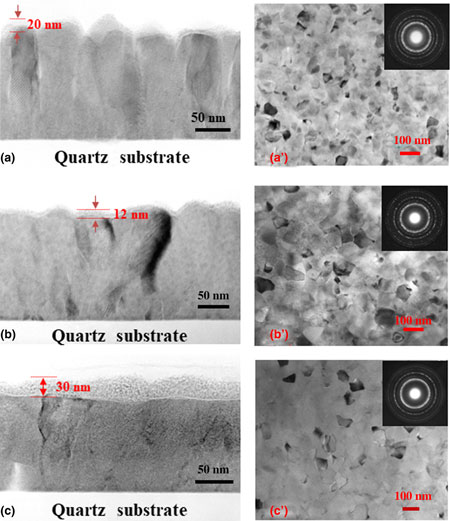
Figure 2 shows bright-field cross-sectional and plane images for the Zn3N2 film deposited using different sputtering gases with an N2 flow ratio of 40%. The cross-sectional views clearly indicate that the Zn3N2 crystallites grow from the interface between the film and the substrate and have the typical characteristics of columnar growth. Moreover, Zn3N2 film deposited using He sputtering gas show a relatively porous structure compared with those deposited using Ar or Ne sputtering gas. Amorphous layers were observed on the surface of all films, which is due to the oxidization of the film surface. In fact, the Zn3N2 film has been reported to be unstable and easily dissolved to ZnO in air.[Reference Zong, Ma, Xue, Zhuang, Zhang, Xiao, Ma and Ji18]
Bright-field cross-sectional TEM images (a) and plane TEM images (a′) of the Zn3N2 film deposited using Ar sputtering gas with an N2 flow ratio of 40%. Similarly, (b) and (b′) are the cross-sectional bright-field TEM images and plane TEM images for the Zn3N2 film deposited using Ne sputtering gas with an N2 flow ratio of 40%, respectively. (c) and (c′) are the cross-sectional bright-field TEM images and plane TEM images for the Zn3N2 film deposited using He sputtering gas with an N2 flow ratio of 40%, respectively. The insets in the plane TEM images are the corresponding electron diffraction patterns.
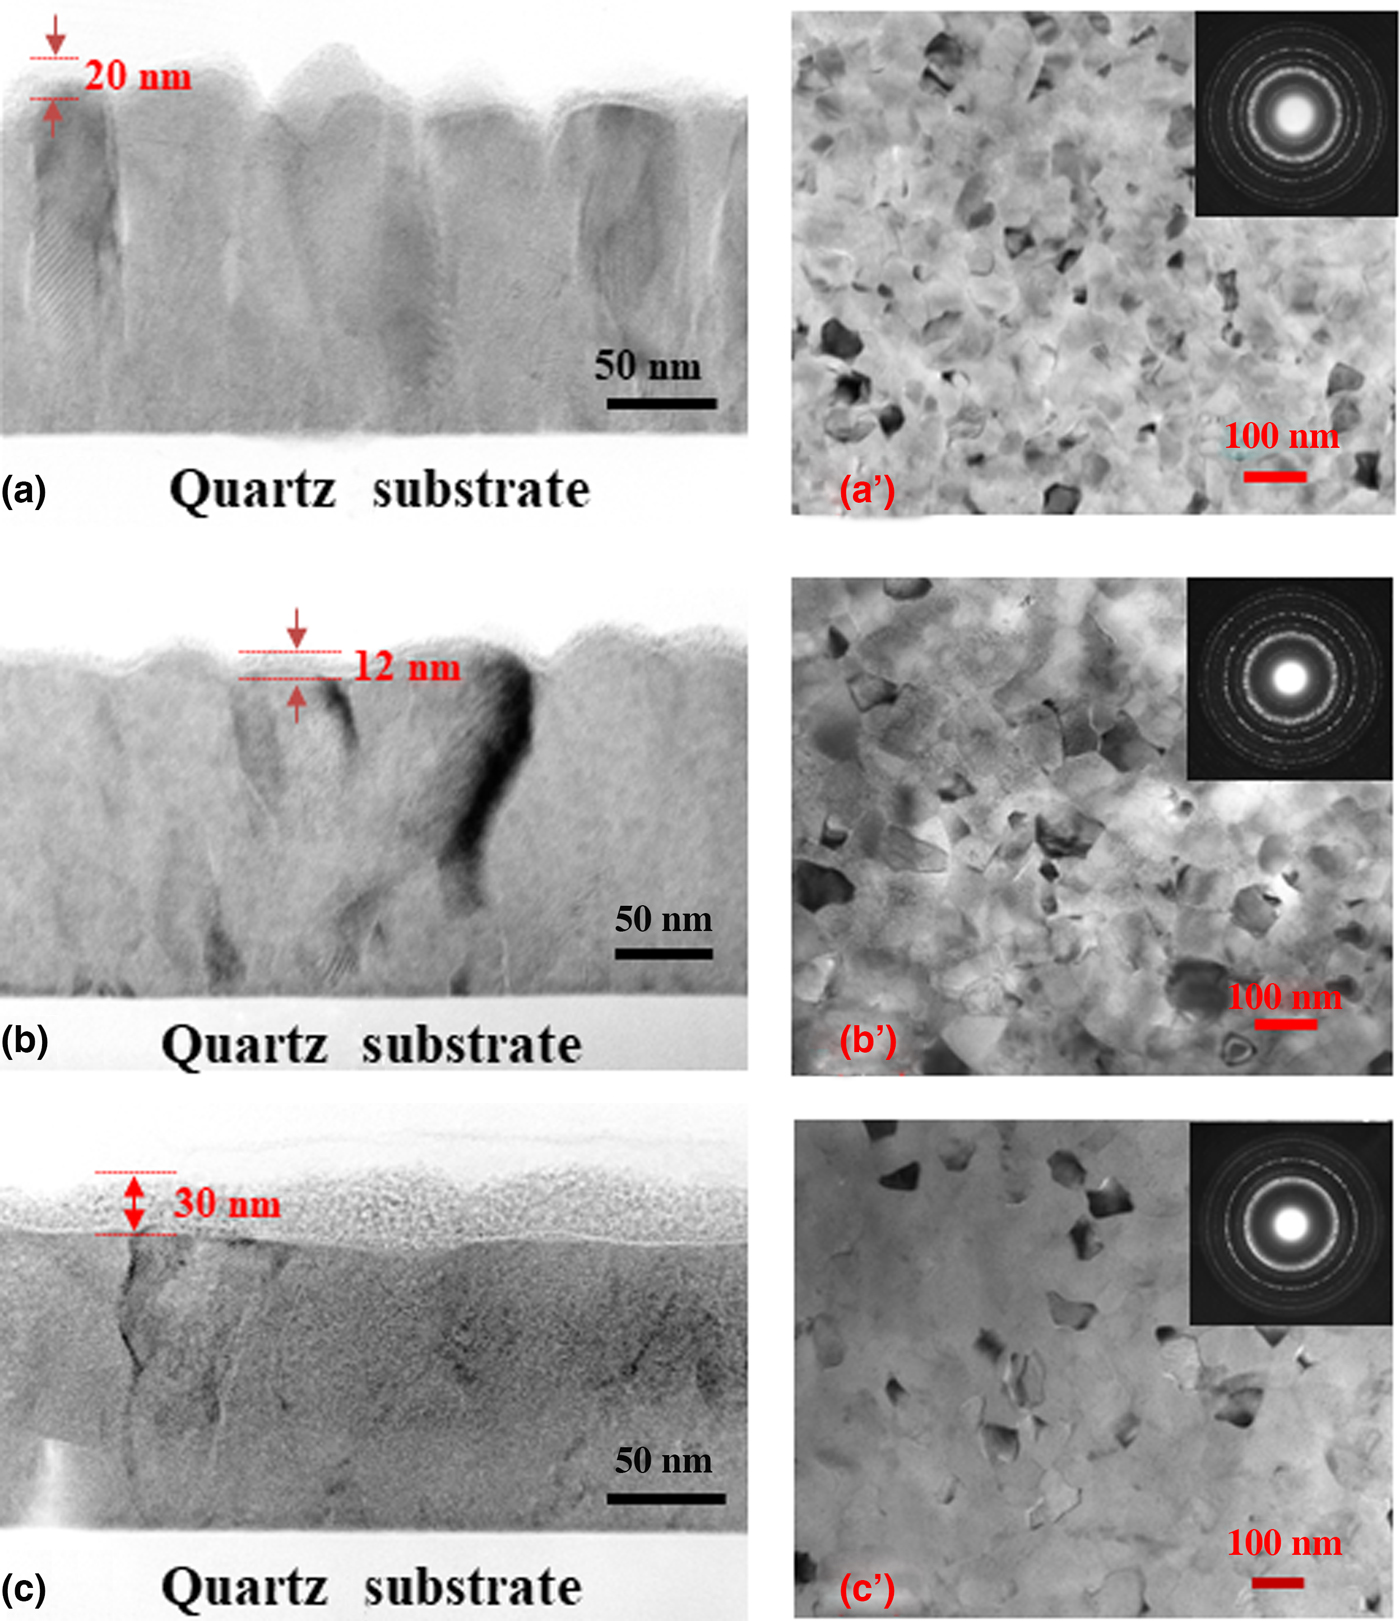
Polycrystalline structures with randomly oriented crystal grains can be clearly observed on the right side of Fig. 2. The electron diffraction patterns of all plane views are shown in the insets of Fig. 2. The lattice spacing estimated from the diffraction rings is consistent with the Zn3N2 crystal lattice spacing (JCPDS 35-0762).[16] Based on the plane view, the Zn3N2 film deposited using He has a larger lateral grain size than that deposited using Ar or Ne sputtering gas. This might be due to the enhanced reactivity of the nitrogen species after the introduction of He sputtering gas, and/or due to the relatively low deposition rate, which will lead to a long lateral diffusion time for sputtered particles on the film surface as discussed above.
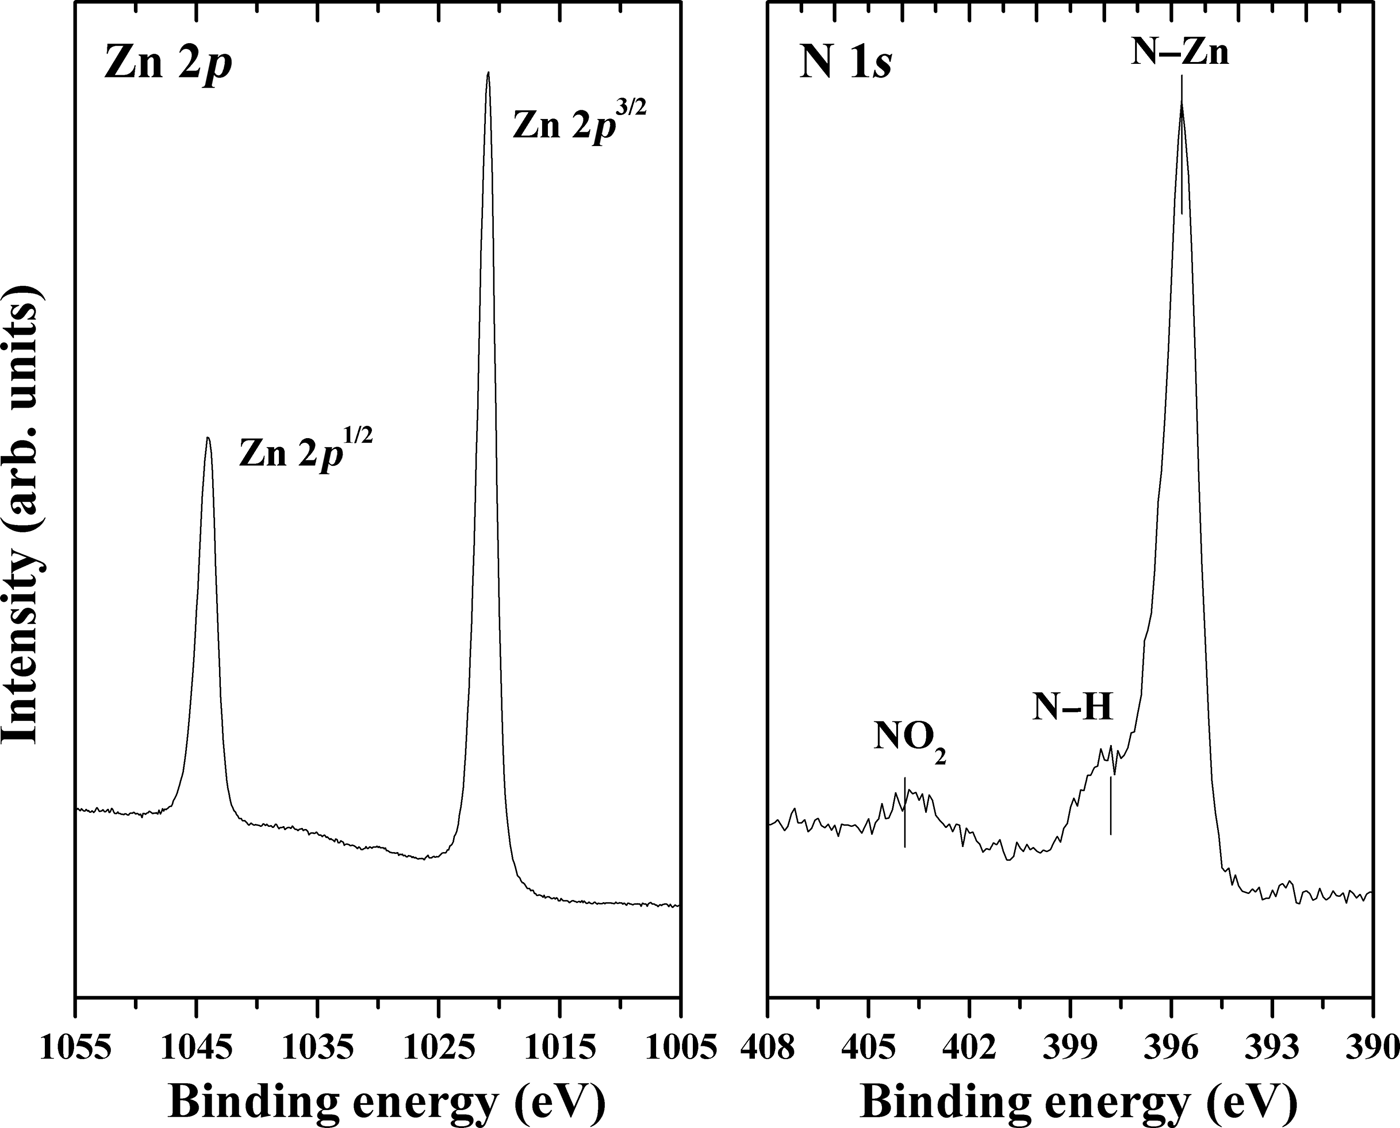
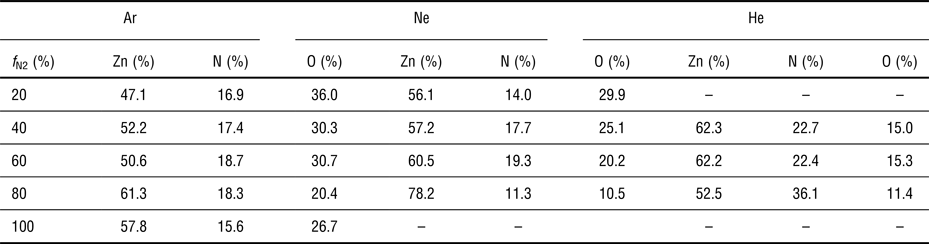
To further confirm the chemical state (chemical composition and valance state) of the Zn3N2 film, XPS analysis was carried out. The full spectra of XPS survey scanning of the as-deposited Zn3N2 films show Zn 2p, N 1s, and O 1s peaks and several adventitious carbon species peaks on the surface. To decrease the surface contaminants, the film surface was etched with Ar+ ions until no C 1s peaks were observed. Figure 3 shows XPS spectra typical for Zn 2p and N 1s. The Zn 2p core level peak is split into two components (Zn 2p 3/2 and Zn 3p 1/2) due to spin–orbit coupling. The major peak located at 1021.8 eV corresponds to Zn 3p 3/2 and the other peak located at 1044.8 eV corresponds to Zn 3p 1/2, which are attributed to Zn–O bonds. The N 1s peak located at ~395.8 eV is attributed to N–Zn bonds[Reference Cao, Sato, Ninomiya and Yamada8] and the shoulder near the N–Zn bond is attributed to the N–H bond, which may be due to residual gas in the sputtering chamber. The peak located at ~403.4 eV, which is due to NO2, was still observed after surface cleaning with Ar+ ions. Table 2 shows that the concentration of constitutional elements (Zn, N, and O) in Zn3N2 thin films deposited at various nitrogen flow ratios using different inert gases, and it is observed that the nitrogen concentration is improved in the Zn3N2 thin films, when the sputtering gas was changed from Ar, Ne to He. This suggests that the utilization of the inert gas (Ne or He) is an effective approach to improve the reactivity of nitrogen species.
Typical Zn 2p and N 1s spectra detected by XPS for Zn3N2 films deposited using different sputtering gases. Here we etched the samples using Ar+ sputtering for 4 min with a 4 kV acceleration voltage.

Concentration of constitutional elements in Zn3N2 films as a function of the N2 flow ratios (f N2) deposited using different inert gases, which was determined by XPS analysis. Here the samples were etched using Ar+ sputtering for 4 min with a 4 kV acceleration voltage.

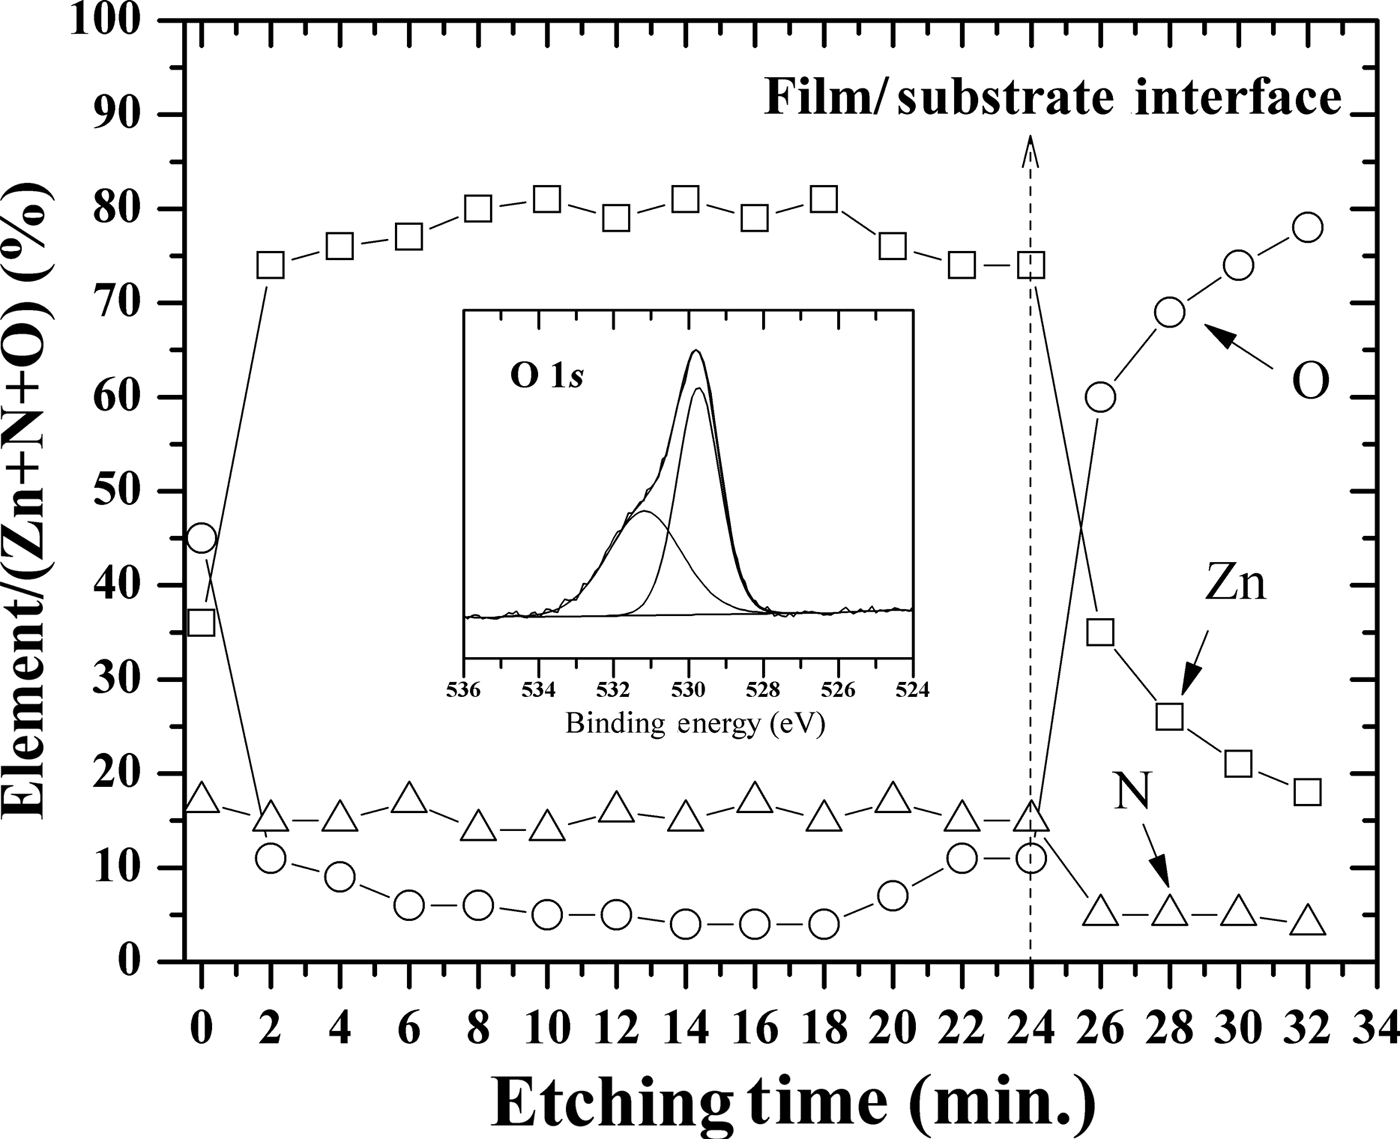
The cross-sectional TEM images in Fig. 2 show that the Zn3N2 film has a surface layer, which might be due to the reaction of Zn with oxygen in the air. The full spectra of XPS survey scanning of the Zn3N2 films show oxygen peaks (not shown here). The depth profiles of the O 1s XPS spectra of the Zn3N2 films were analyzed using Ar+ etching on the film surface. The O 1s XPS spectra of the Zn3N2 film surface are shown in the inset of Fig. 4; the spectrum was calibrated using the Zn 2p electron peak at 1021.8 eV. The shoulder of the main peak is attributed to the influence of the –OH bond.[Reference Kusayanagi, Uchida, Oka, Jia, Nakamura and Shigesato19] Based on the depth profile, the oxygen content is high close to the film surface (~45%) and rapidly decreases below 10% after etching for 2 min. The oxygen content close to the film surface is due to the oxidization reaction with oxygen in the air. The observed oxygen contents that increase with increasing etching time are due to residual gas such as water vapor in the sputtering chamber.
Depth profiles of the elements ([Element]/[Zn + N + O]) in the Zn3N2 film. The inset shows the O 1s spectrum close to the film surface, which was calibrated using Zn 2p at 1021.8 eV.

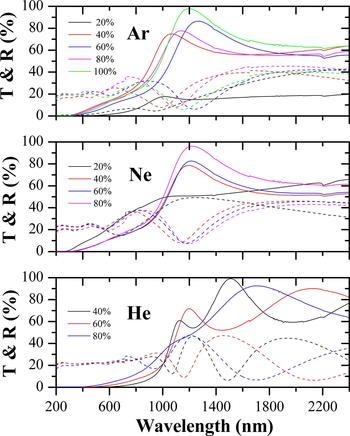
Figure 5 shows the optical transmittance and reflectance of the Zn3N2 films. All films exhibit a relatively low transparency in the visible region due to the small band gap.[Reference Kumagai, Harada, Akamatsu, Matsuzaki and Oba13] The transmittance decreases in the near-infrared region (at ~1100 nm) and the reflectance increases. These behaviors can be explained in with the variation in the plasma oscillation in the near-infrared region, which is a well-known characteristic of highly degenerated TCO films.[Reference Burstein14, Reference Moss15] The maximum transmittance was observed in Zn3N2 films deposited using Ar or Ne sputtering gas with maximum N2 flow ratio (because of the interference due to the different film thicknesses, the transmittance cannot be directly compared with that of Zn3N2 films deposited using He sputtering gas). This implies that the introduction of more N2 gas can improve the reactivity of the nitrogen species.
Transmittance and reflectance spectra of Zn3N2 films deposited using different nitrogen flow ratios using Ar, Ne, or He sputtering gas.
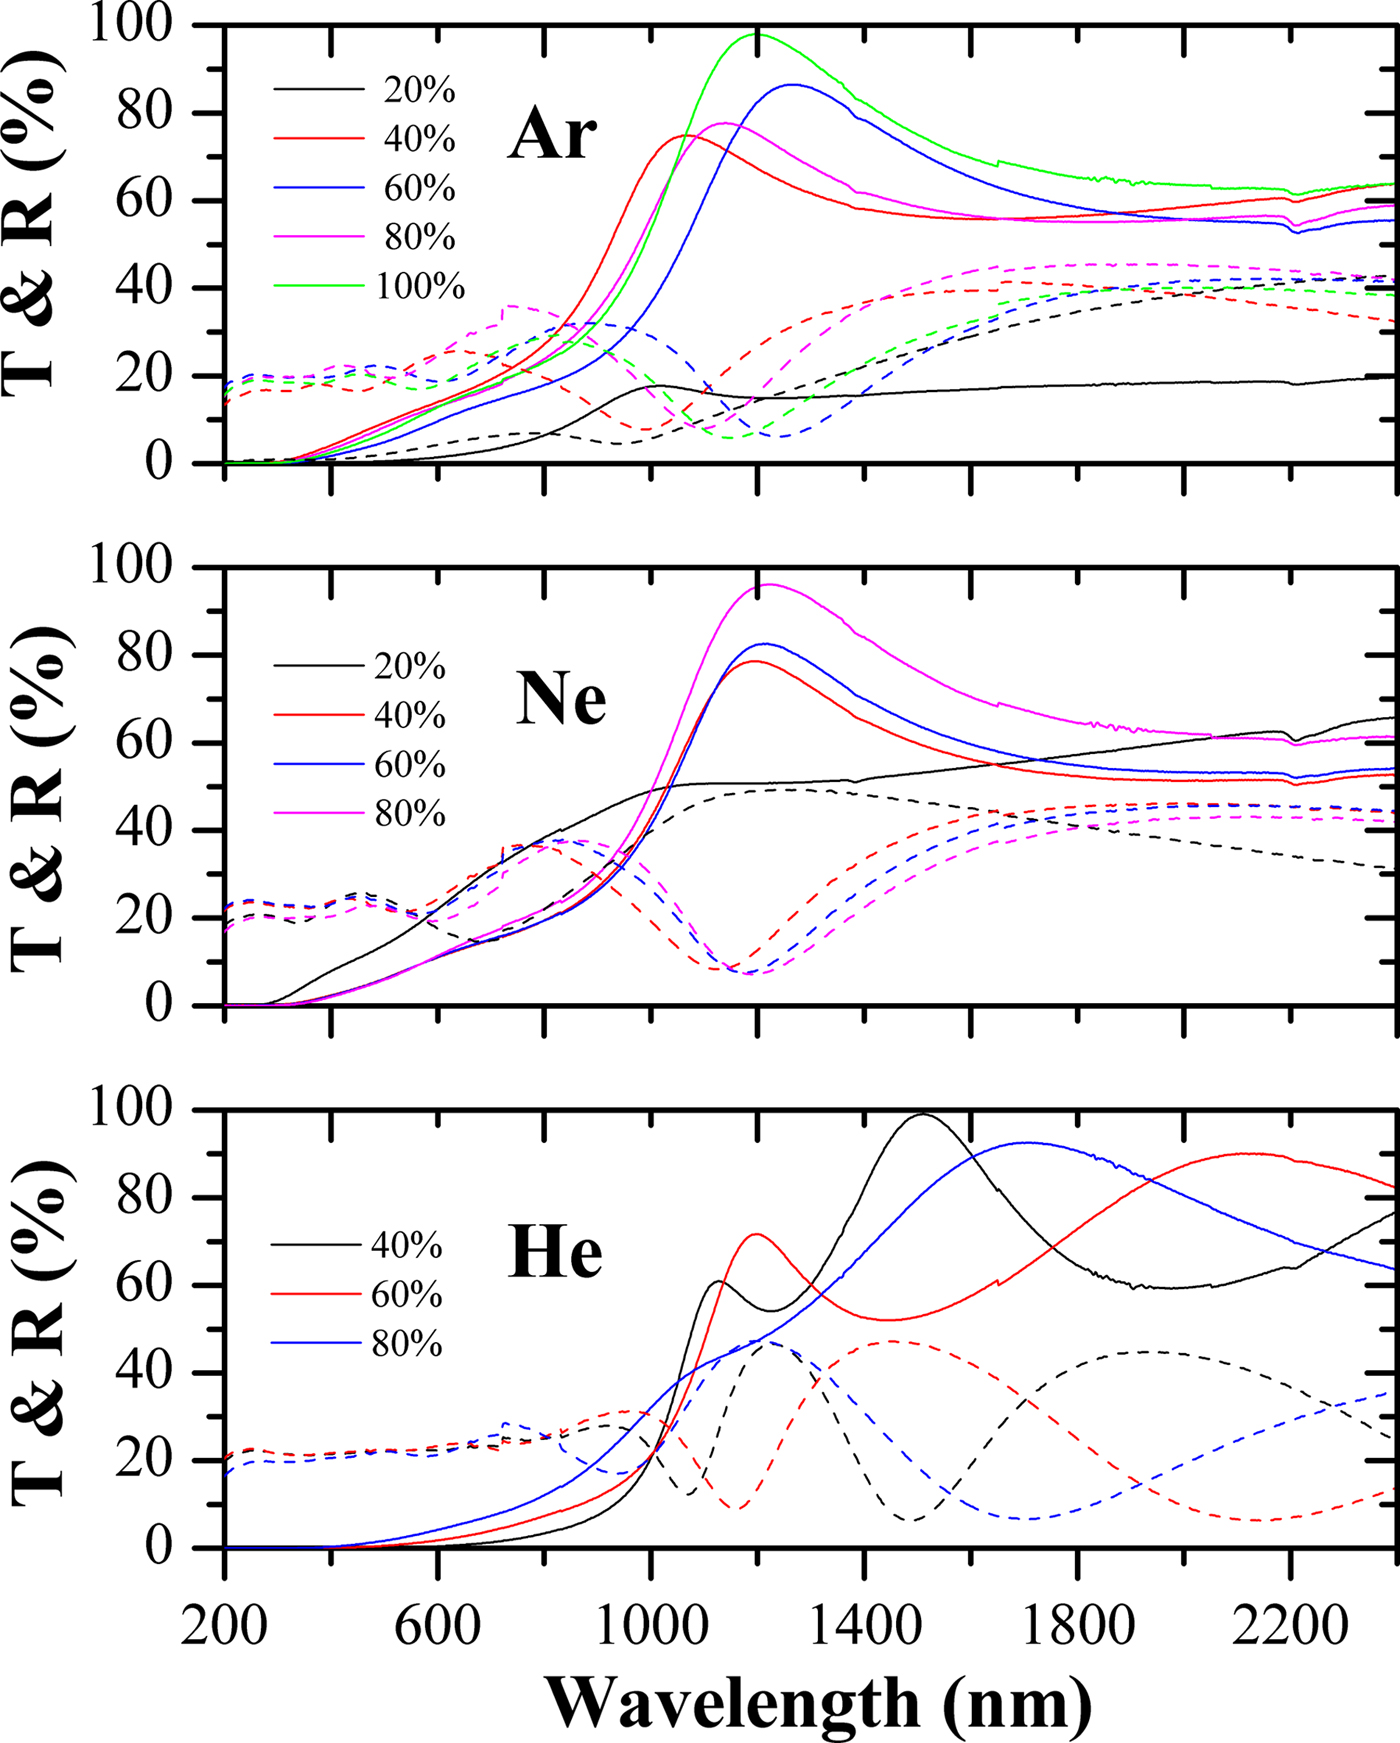
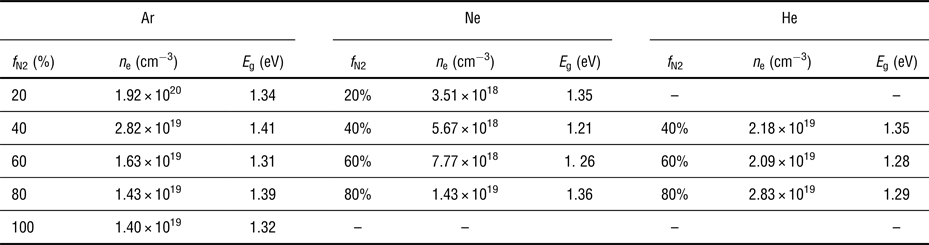
We estimated optical band gap (E g) values using the Tauc plot and the well-established relation αhυ = A(hυ −E g)k, where α is the absorption coefficient, A is a constant, hυ is the photon energy, and k relates to the type of the electron band–band transition. Zinc nitride has been reported to have a direct-type band structure based on first principle calculations;[Reference Kumagai, Harada, Akamatsu, Matsuzaki and Oba13] k = 1/2 is used in the present Tauc plots. The α values were calculated using the transmittance and reflectance spectra shown in Fig. 5. The calculated E g is listed in Table 3. The E g of the Zn3N2 films changed from ~1.2 to ~1.5 eV depending on the N2 flow ratio and type of sputtering gas. It should be noted that E g does not increase with increasing carrier density. This cannot be explained with the BM effect. The possible reason is the formation of other reduced zinc nitrides. In fact, the surface of the Zn3N2 film deposited at an N2 flow ratio of 20% is similar to the polished metal surface.
Optical band gap and carrier density as a function of the N2 flow ratios (f N2) for Zn3N2 films deposited using different sputtering gases.

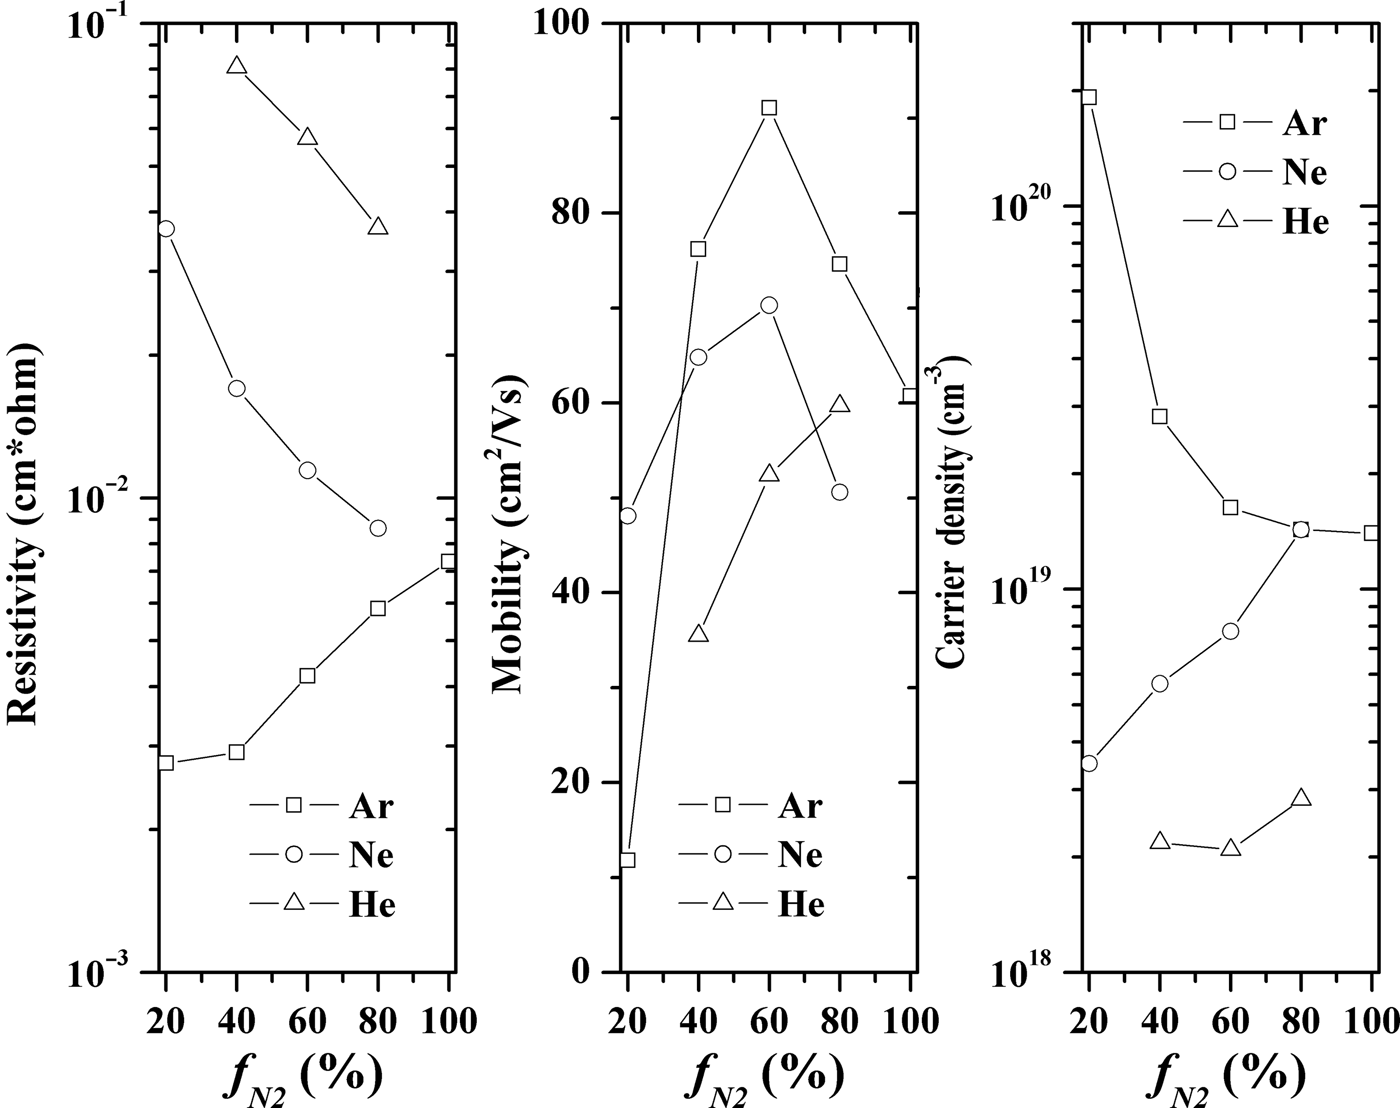
The electrical properties of the Zn3N2 films are shown in Fig. 6. With increasing N2 flow ratio, the resistivity of the film deposited using Ar sputtering gas increases and that of the film deposited using Ne and He sputtering gas decreases. The Hall measurements show that the carrier density of the Zn3N2 film deposited using Ar sputtering gas decreases with increasing N2 flow ratio. It is notably higher than that of films deposited using Ne or He sputtering gas, which may be attributed to the decrease of nitrogen vacancy in those films deposited using Ne or He sputtering gas due to the improved reactivity of the nitrogen species. The maximum Hall mobility of Zn3N2 film deposited using Ar sputtering gas is 91.1 cm2/Vs when the N2 flow ratio is 60%. Such a high mobility might be due to the small electron effective mass of the Zn3N2 film.[Reference Cao, Yamaguchi, Ninomiya and Yamada7]
Electrical resistivity, Hall mobility, and carrier density as a function of the N2 flow ratios (f N2) during the sputtering of Zn3N2 films deposited using Ar, Ne, or He sputtering gas.

To understand the carrier transport phenomenon, we studied the carrier transport behavior of Zn3N2 films. Due to the high-carrier density, ionized impurity scattering is considered to be the dominant scattering mechanism. The calculated mobility μ I based on the ionized impurity scattering mechanism can be described by the following Brooks–Herring equation,[Reference Jia, Oka, Kusayanagi, Nakatom and Shigesato20]
 $$\mu _{\rm I} = \displaystyle{{24\pi ^3 {\rm (\epsilon} _{\rm 0} {\rm \epsilon} _{\rm r} )^2 {\hbar}^3 n} \over {e^3 m^{*2} g(x)Z^2 n_{\rm I}}}, $$
where ε 0 and ε r are the dielectric constant of free space and relative permittivity, respectively (ε r = 5.3 was selected);[Reference Cao, Sato, Ninomiya and Yamada8] e is the elementary charge;  $\hbar $ is the Planck constant; and Z and n I are the charge and density of the ionized scattering centers, respectively. An effective electron mass m* = 0.30 was used in the present analysis. The screen function g(x) is given by:
 $$g(x) = \ln \left( {1 + \displaystyle{4 \over x}} \right) - \left( {1 + \displaystyle{x \over 4}} \right)^{ - 1} $$
with
 $$x = {4e^2 m^* \over 4\pi \epsilon_0\epsilon_r{\hbar}^2 (3\pi^5)^{1/3} n^{1/3}}. $$
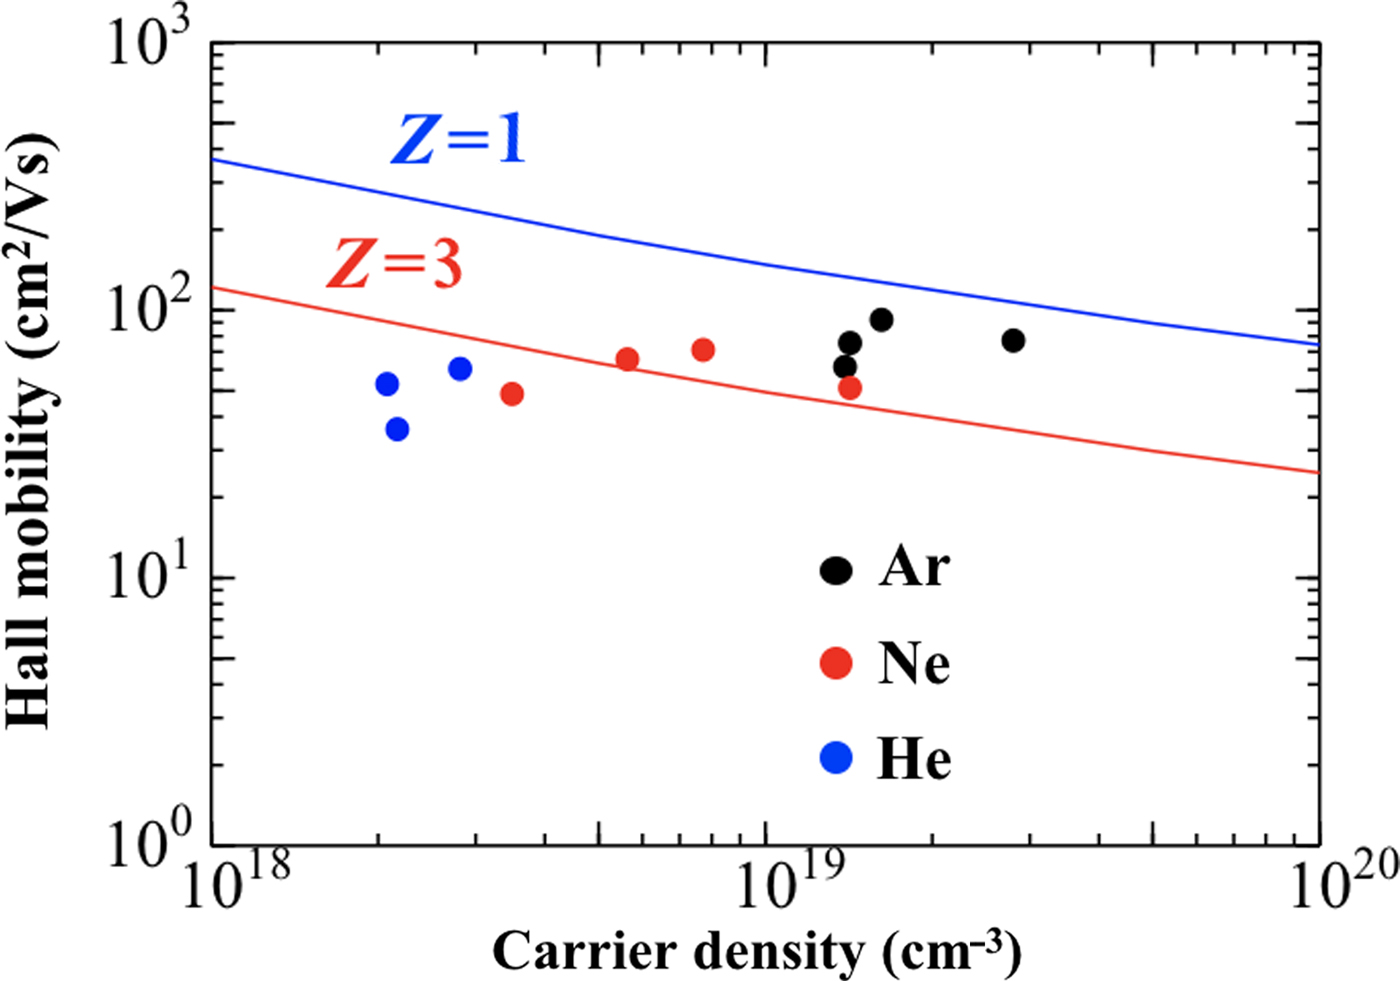
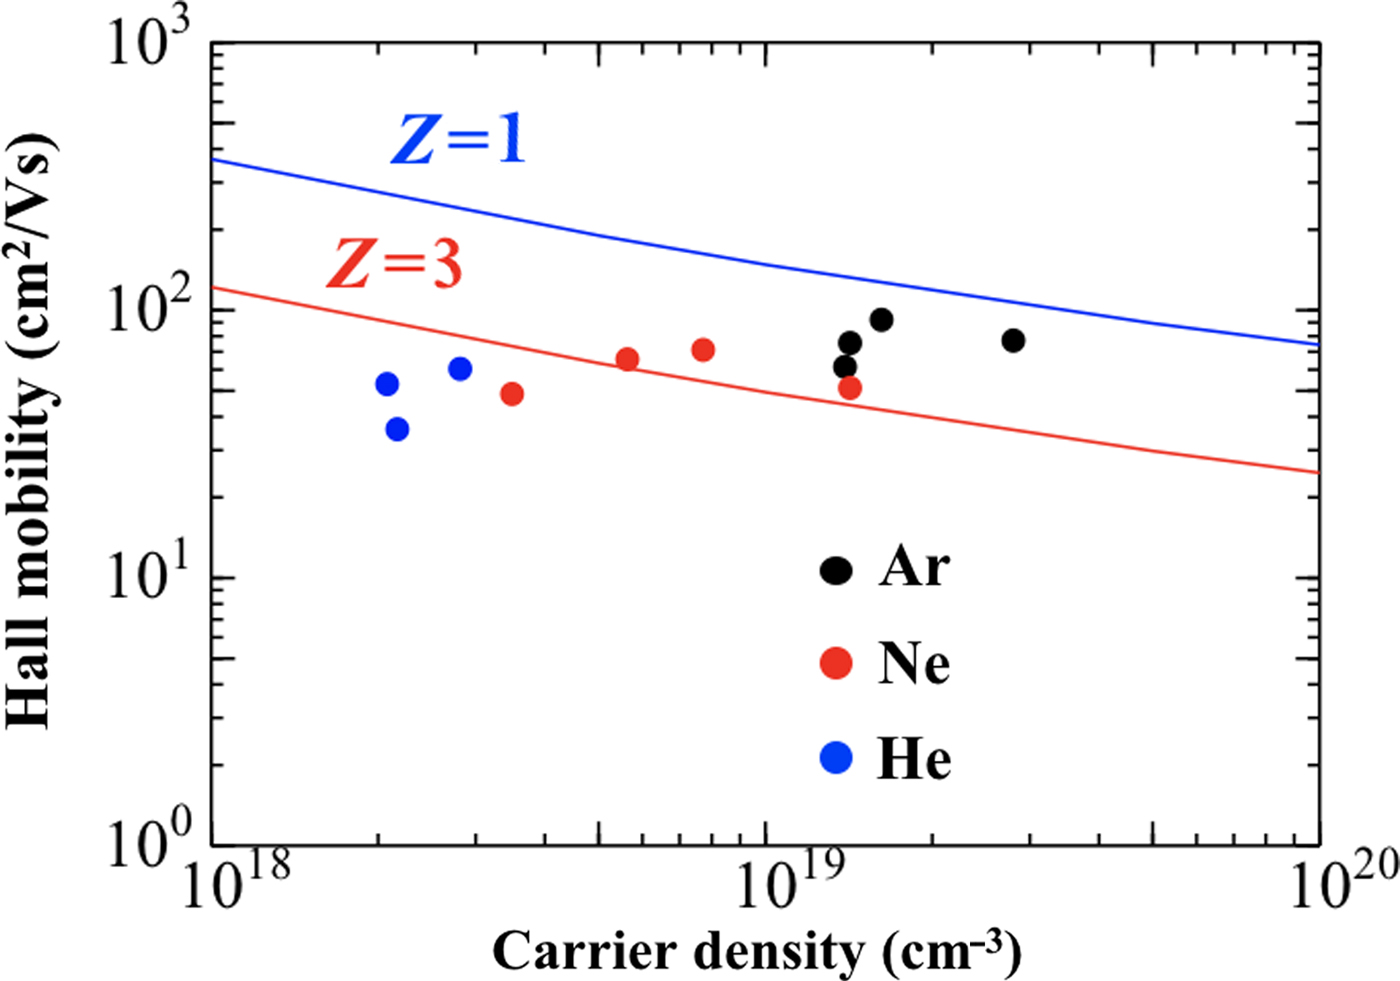
The parameter μ I calculated using the equations above is plotted in Fig. 7. The measured mobility values for Zn3N2 films deposited using Ar sputtering gas are close to the calculated Z = 1 curve, where Z = 1 can be considered as the result of oxygen substitution into nitrogen sites. On the other hand, the measured mobility values of Zn3N2 films deposited using Ne sputtering gas is located close to the Z = 3 curve, which implies the existence of nitrogen vacancies in these films. The mobility of Zn3N2 films deposited using He sputtering gas differs from the calculated curves, and this suggests that some other scattering centers are dominant in these films, such as the lattice vibration or dislocation, due to the improved reactivity of the nitrogen species. Here, we preclude the influence of the grain boundary scattering on the Zn3N2 films deposited using He sputtering gas, because these films have larger grain size than those deposited using Ar or He as shown in Fig. 2 and Table 1.
Hall mobility as a function of the carrier density. The solid lines represent the ionized impurity scattering calculated using the Brooks–Herring equation.
Conclusions
We investigated the influence of the sputtering process on structural, optical, and electrical properties of Zn3N2 films deposited by reactive magnetron sputtering. The reactivity of the nitrogen species can be improved by changing the type of sputtering gas. Compared with Ar or Ne sputtering gas, polycrystalline Zn3N2 films deposited using He sputtering gas have a larger grain size. The maximum mobility was 91.1 cm2/Vs when the Zn3N2 film was deposited using Ar sputtering gas with an N2 flow ratio of 60%. The carrier density of the Zn3N2 films deposited using Ar sputtering gas was notably higher than that of films deposited using Ne or He sputtering gas. The optical band gap of the Zn3N2 films changed from ~1.2 to ~1.5 eV depending on the N2 flow ratio and type of sputtering gas. The optical band gap does not increase with increasing carrier density, which cannot be explained by the BM effect and might be due to the formation of other reduced zinc nitrides.