INTRODUCTION
The deposition of nutrients in animal urine and faeces plays a central role in nutrient cycling in grazed pasture systems (Haynes & Williams Reference Haynes and Williams1993). Urine and dung are deposited by grazing animals, causing high nutrient loading to a relatively small proportion of the total grazed area. Such depositions often cause a typical striking ‘mosaic’ effect in grazed pastures, whereby regions of the sward affected by urine and dung are easily identifiable as being areas of tall, dense and dark green pasture (Ledgard et al. Reference Ledgard, Steele and Saunders1982; Steele Reference Steele and Lynch1982). The plant growth response in these excretal areas is a result of the nutrient loading from the excreta, and these areas are often termed as being urine or dung ‘patches’.
In terms of excretal nutrient deposition, nitrogen (N), which is largely excreted in urine, is of particular importance. The literature suggests that a typical dairy cow urination event deposits 2·0 litres of urine (Doak Reference Doak1952; Whitehead Reference Whitehead1970; Frame Reference Frame1971; Robertson Reference Robertson1972) onto an area of 0·2 m2 (Haynes & Williams Reference Haynes and Williams1993). Dairy cows are estimated to urinate 10–12 times per day (Jarvis et al. Reference Jarvis, Scholefield, Pain and Bacon1995). Under such conditions, nitrogen loading in the dairy cow urine patch is high, in the region of 1000 kg N/ha (Di & Cameron Reference Di and Cameron2002a). Pasture N uptake from the urine patch would be expected to be between 300 and 700 kg N/ha/yr (During & McNaught Reference During and McNaught1961; Ball et al. Reference Ball, Keeney, Theobald and Nes1979; Ball & Ryden Reference Ball and Ryden1984; Di et al. Reference Di, Cameron, Moore and Smith1998; Ledgard Reference Ledgard2001; Moir et al. Reference Moir, Cameron and Di2007). Therefore, because the N-loading rate in the urine patch exceeds plant N demands, surplus soil N results (Saarijärvi & Virkajärvi Reference Saarijärvi and Virkajärvi2009). This surplus N is present as nitrate (NO3−) following nitrification (Haynes & Williams Reference Haynes and Williams1992), and represents the key point source of N loss from grazed pasture systems (Fraser et al. Reference Fraser, Cameron and Sherlock1994; Silva et al. Reference Silva, Cameron, Di and Hendry1999). Much current research is focused upon the quantification and mitigation of N loss from dairy cow urine patches (e.g. Fraser et al. Reference Fraser, Cameron and Sherlock1994; Ledgard et al. Reference Ledgard, Penno and Sprosen1999; Silva et al. Reference Silva, Cameron, Di and Hendry1999; Di & Cameron Reference Di and Cameron2002b, Reference Di and Cameron2004, Reference Di and Cameron2008; Pakrou & Dillon Reference Pakrou and Dillon2004) and this requires accurate data on urine patch coverage of the grazed area.
Nitrogen models are valuable tools used in the estimation of nitrogen losses and management of N in grazed pasture systems (e.g. Di & Cameron Reference Di and Cameron2000). The reliability of outputs from these models, however, depends on two key pieces of input data: (1) the measurement, and therefore quantification, of soil N losses (urine N) under various farm management and climatic conditions; and (2) a reliable estimate of the area of land that receives urine depositions on an annual basis, including the spatial and temporal variability of depositions. To this end, considerable data on the former have been published in recent years (e.g. Fraser et al. Reference Fraser, Cameron and Sherlock1994; Ledgard et al. Reference Ledgard, Penno and Sprosen1999; Silva et al. Reference Silva, Cameron, Di and Hendry1999; Di & Cameron Reference Di and Cameron2002a, Reference Di and Cameron2003, Reference Di and Cameron2004, Reference Di and Cameron2005, Reference Di and Cameron2007, Reference Di and Cameron2008). However, quantitative research examining the proportional area coverage of urine patches in grazed pastures is scarce. Limited information on urine patch size and pasture response duration (Lotero et al. Reference Lotero, Woodhouse and Petersen1966) and the frequency of cow urination (White et al. Reference White, Sheffield, Washburn, King and Green2001; Aland et al. Reference Aland, Lidfors and Ekesbo2002; Oudshoorn et al. Reference Oudshoorn, Kristensen and Nadimi2008) is available in the literature.
Historically, the assessment of annual urine patch coverage in grazed pastures has been a difficult task. Measurements included time-consuming, costly visual monitoring of cows in the field (White et al. Reference White, Sheffield, Washburn, King and Green2001) or limited pasture response observations. Petersen et al. (Reference Petersen, Lucas and Woodhouse1956) tested several theoretical mathematical relationships in order to describe the distribution of faeces on a pasture stocked with free-grazing cattle. MacLusky (Reference MacLusky1960) estimated that the surface area affected by cow urinations was 0·68 m2/cow/day, which equates to a very low annual coverage value of <0·1 of the paddock area. Richards & Wolton (Reference Richards and Wolton1976) conducted more detailed calculations, based in part on the work of Petersen et al. (Reference Petersen, Lucas and Woodhouse1956). Assuming that urine patch overlapping occurs, they used a negative binomial function and calculated that 0·23 of a paddock might be covered annually. Williams (Reference Williams1988) estimated the density of excreta deposition using the formula of Petersen et al. (Reference Petersen, Lucas and Woodhouse1956) and Richards & Wolton (Reference Richards and Wolton1976), and also estimated that 0·23 of pasture would be covered in excreta (i.e. dung and urine) in 1 year. Whitehead (Reference Whitehead2000) calculated a urine coverage area of 0·21 for dairy cattle grazing at an intensity of 700 cow days/ha/yr. In the most comprehensive study to date in this field of research, White et al. (Reference White, Sheffield, Washburn, King and Green2001) measured the frequency and location of urinations and defecations of dairy cows in a 1-year study. Taking an average area coverage for urine and faeces based on literature values, they calculated an area coverage of excreta of about 0·1 of the total paddock area for a stocking density of 2·48 cows/ha.
In a preliminary study, Moir et al. (Reference Moir, Fertsak, Cameron and Di2006) presented a new methodology to overcome these measurement issues, by using a real-time kinematic global positioning system (RTK-GPS) to record the location of animal urine and dung patches in the field. Accurate positional and temporal urine and dung patch deposition measurements were made, incorporating urine and dung patch size (radius). This paper presents a 4-year dataset examining field urine depositions by dairy cattle in an intensively grazed dairy pasture system, using the methodology of Moir et al. (Reference Moir, Fertsak, Cameron and Di2006). The objective of this study was to quantify the spatial annual area coverage, diversity and distribution of dairy cow urine depositions to an intensively stocked grazed pasture system.
MATERIALS AND METHODS
Site location and farming system
This research was conducted from 2003 to 2007 on the Lincoln University Dairy Farm (LUDF), 15 km South West of Christchurch, New Zealand (43°38′S, 172°26′E; 17 m asl). The mean annual maximum and minimum temperatures measured on the farm are, respectively, 17 and 4°C, with an average annual rainfall of 666 mm. Full details of the farming system are given in Moir et al. (Reference Moir, Cameron and Di2007) and Van Bysterveldt et al. (Reference Van Bysterveldt, Moir and Metherell2006), but are briefly summarized here. The farm is 161 ha (effective) in area with an average stocking density of 3·6 cows/ha (mean value; 2003–07), and is spray irrigated from November to March. Pastures are based on perennial ryegrass (Lolium perenne L. cultivars ‘Bronsyn’ and ‘Impact’)/white clover (Trifolium repens, cultivars ‘Aran’ and ‘Sustain’), in a mean (annual) ratio of 0·8:0·2. Livestock are Holstein–Friesian based, producing 430 kg of milk solids (MS)/cow or 1711 kgMS/ha/yr. The cows graze outdoors all year round, on a pasture only diet, grown on-farm. A proportion (0·7) of the herd of 578 cows graze off-farm for a 4-week period between the winter months of June and July. All paddocks are fertilized with 200 kg of N, 45 kg P and 75 kg S/ha/yr. Fertilizer P and S (S-fortified single superphosphate) are applied as split dressings in October and March, while N (urea) is applied in eight equal split dressings from late July to late April. The livestock graze all paddocks rotationally on a 21-day grazing round all year. On average, the cows graze each paddock for 24 h before moving to a new paddock, grazing down to a residual of 1450 kg dry matter (DM)/ha.
Grazing events and stocking density
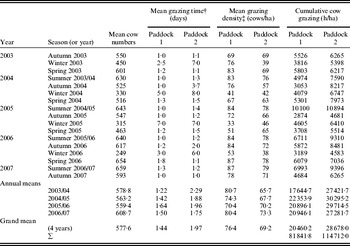
On average, the dairy herd grazed the trial paddocks 11 times per annum over the duration of the study. The mean herd size was 578 cows, with the ‘whole-farm’ stocking density (cows/ha) steadily increasing from 2003 to 2007 (Table 1), reflecting that the farm was in a development phase following conversion from a sheep farm. Paddock 1 had slightly higher grazing densities than paddock 2, due to the smaller area of paddock 1.

The mean number of days the cows took to graze a paddock was 1·4 and 2·0 for paddocks 1 and 2, respectively. In contrast to other seasons, winter grazing characteristically involved a single grazing in late winter/early spring (July/August), over several days.
Stocking or grazing intensity, as measured by cow grazing h/ha, varied considerably between seasons and between years in both paddocks. The values ranged from 2075 (paddock 1, autumn 2005) to 10 894 (paddock 2, summer 2004/05) cow grazing h/ha. The total annual cow grazing h/ha was highest in 2004/05 and lowest in 2003/04 (Table 1). With a 4-year total value of 114 712 cow grazing h/ha, paddock 2 had 40% more cow grazing h/ha than paddock 1 (81 841 cow grazing h/ha).
Measurements
The trial commenced in May 2003. Twelve 10×10 m (100 m2) plots were established in two paddocks of differing DM production levels; ‘paddock 1’, 7·4 ha and ‘paddock 2’, 8·3 ha in the area. DM yields are in the range of 11–13 and 16–18 T DM/ha/yr for paddocks 1 and 2, respectively. Care was taken to position the plots within ‘typical’ grazing areas, away from fence lines, water troughs, etc. which would be likely to add bias to the data. Plot locations were recorded using survey-grade GPS so that the exact location could be returned to for repeated measurements. The time period prior to or between each measurement is referred to in this paper as the ‘urine deposition period’. All plots were grazed as part of the normal grazing rotation of the farm.
Measurements consisted of the recording of all animal urine and dung patches deposited within the boundaries of each plot. Urine and dung patch measurements were based on visual identification. Fresh dung patches were easily identified, and skilled observers could identify older dung patches (those several months old) as areas with higher or darker-green pasture, with a small bare area with organic debris in the centre. Urine patches were identified as being areas of lush, dense pasture growth, typical of a large pasture nitrogen growth response. On rare occasions urine ‘scorching’ occurred (see Richards & Wolton Reference Richards and Wolton1975; Keuning Reference Keuning, Prins and Arnold1980), stunting pasture growth for several weeks. The ongoing measurement of both urine and dung patches allowed for a more accurate assessment of urine depositions, so that old dung patches would not be mistaken for urine patches and vice versa. As the focus of the present study is urine patch deposition, the dung patch data are not presented here.
Once identified, the exact location of each urine patch was recorded using a GPS. A survey grade Trimble Geomatics Office™ RTK GPS (Trimble, CA, USA; TNL 5700 rover, plus base unit) was used, which gave a very high point accuracy of ±0·01 m. To make the measurement, the GPS pole was placed in the centre of the urine patch and the location recorded in the data logger. In addition, the mean radius of the urine patch was measured, and recorded as a corresponding code in the data logger. This measurement was made by clamping a ruler horizontally to the base of the GPS pole, and rotating the pole to measure the mean patch radius. The edge of the urine patch was determined visually while rotating the pole, so that the measured radius best represented the radius of the patch and encompassed the patch surface area. Measurements were made by the same observers.
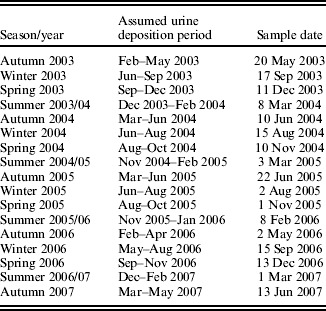
All plot urine and dung patch measurements were repeated at approximately 12 week intervals. This sampling interval was based on information from the literature that suggested a mean urine patch pasture growth response period of 3 months (Norman & Green Reference Norman and Green1958; During & McNaught Reference During and McNaught1961; Ledgard et al. Reference Ledgard, Steele and Saunders1982; Haynes & Williams Reference Haynes and Williams1993). Although this period of response may also be climate and soil-type specific to some degree, there is, as yet, no data in the literature to support such a hypothesis. Therefore, a 12-week sampling period was used as it was likely that observed urine patches had been deposited in the previous 3 months and not before. This sampling strategy also allowed for a ‘seasonal’ comparison, to examine seasonal variation of urine deposition. The time period prior to or between each measurement is referred to in the present paper as the ‘urine deposition period’. Sampling dates for all plots are presented in Table 2.
Urine patch observation sampling dates, season and the assumed period in which urine patches were deposited
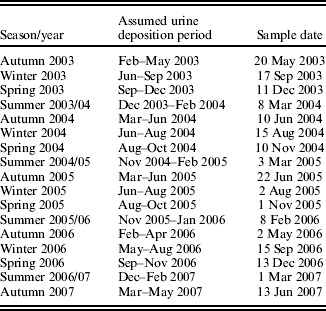
All measurements were taken at least 14 days after the paddock was last grazed. This allowed for sufficient pasture regrowth before sampling, especially in the high N response urine patches. Urine patches were therefore easily observed in the field at the time of sampling due to the high pasture mass of the urine patch compared to other areas of the sward.
The stocking intensities (cow grazing h/ha) presented take into account the actual time that the cows spent grazing in these paddocks. One calendar day was defined as being equal to 20 cow grazing h, because the cows typically spend 4 h of the day off paddock, being milked or walking between the milking parlour and the paddocks.
Data analysis
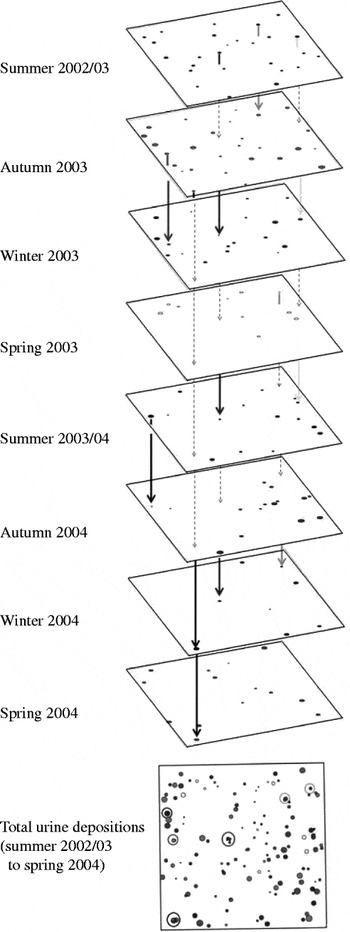
The field GPS data were downloaded and ground-truth corrections made using Trimble Geomatics Office (Trimble 2003), where necessary. For the geographic information system (GIS) data analysis, ArcGIS 8.0 (ESRI 2002) and ArcView 3.2a (ESRI 1996) were used, as well as the additional extension Nearest Features 3.7a (Jenness Reference Jenness2004) for ArcView. The data were analysed on an individual sampling event basis, for each plot. Location co-ordinates were established for urine patches, including patch radius. The data output was then summarized in terms of: (i) the mean radius and area of urine patches, (ii) the number of urine patch observations in each plot per sampling event (data not shown) and (iii) area of the plot affected by urine deposition at each sampling event. During data analysis, it was assumed that if the centre of a urine patch was within ±0·1 m of another patch through time (sampling events), it was deemed as having resulted from the same urination event. Therefore, urine patches observed at more than one sampling event were removed from the current observation dataset, as each observation dataset was defined as being ‘fresh’ urine patches deposited in the previous 3 months. This analysis used GIS to examine the links between field urine patch depositions through time (‘layers’), where each sampling event for a plot represented a single ‘layer’ (see Fig. 1). Therefore, this particular data analysis provided information on the temporal duration of pasture growth response to urine depositions.
A graphical representation of the analysis of the spatial distribution of deposited urine patches for one field plot, and of the GIS process used to determine if urine patch response areas appeared in more than one sampling observation period. Arrows through layers (GIS layers) represent the same urine patch being observed across one or more sampling events.

The variability of urine patch coverage between plots, seasons and years was statistically analysed by conducting an analysis of variance (ANOVA) in GenStat 11.0 (Lawes Agricultural Trust, Rothamsted, UK). The model included year, season and year×season interaction as fixed effects, whereas plot was included as a random effect. The degree of spatial randomness of urine depositions was statistically assessed using the ‘Nearest Neighbour’ statistical analysis in ArcGIS.
RESULTS
Urine patch size
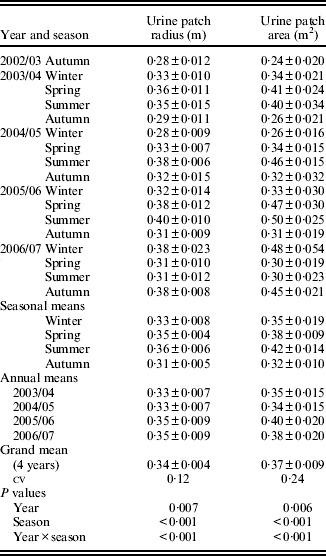
Mean seasonal and annual urine patch radius and area measurement data are presented in Table 3. Individual radius values ranged from 0·10 to 0·60 m, although most urine patches were consistently in the range of 0·32–0·35 m.
Mean urine patch radius (m) and surface area (m2) on a seasonal and annual basis for all observations (±1 s.e.m.)

The surface area of individual urine patches ranged from 0·03 to 1·1 m2. Mean annual areas ranged from 0·34 to 0·40 m2 (4-year mean 0·37±0·009 m2), with little variation between years (Table 3).
Mean patch diameters and areas were consistent over time, but did vary between seasons and between years. Urine patch areas tended to be slightly smaller for winter- and autumn-deposited urine and largest when deposited in the spring or summer (Table 3; P<0·001). Urine patches were also slightly, but significantly (P=0·006), larger in area for the 2005/06 and 2006/07 seasons when compared with the 2003/04 and 2004/05 seasons. There was a significant year×season interaction (P<0·001), indicating that the seasonal trends of urine patch area were variable from year to year.
Number of urine patches and area coverage
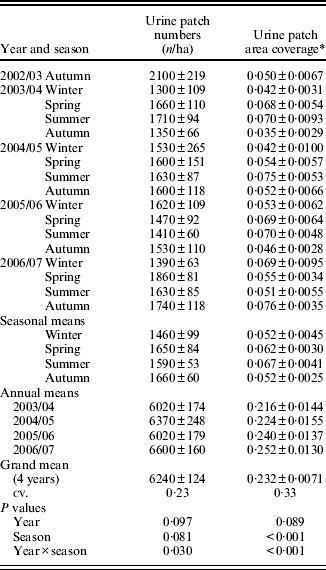
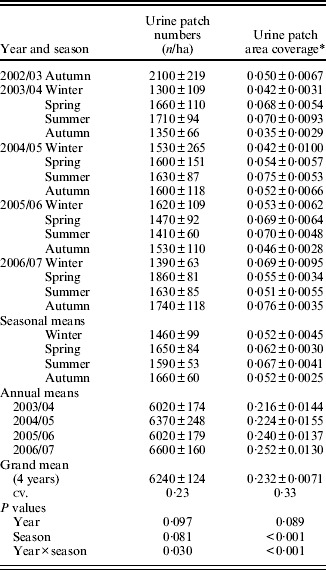
Urine patch numbers ranged from 700 to 3900 patches/ha at any one sampling. Annual mean urine patch numbers/ha were highest in 2006/07 (6600±160 patches/ha) and lowest in 2003/04 and 2005/06 (Table 4; 6020±174 patches/ha). Mean seasonal urine patch numbers/ha were lowest in the winter of 2003 (1300±109 patches/ha) and highest in the spring of 2006 (1860±81 patches/ha).
Mean urine patch numbers and mean urine patch area coverage per ha on a seasonal and annual basis for all observations (±1 s.e.m.) numbers
* Refers to proportional area covered.
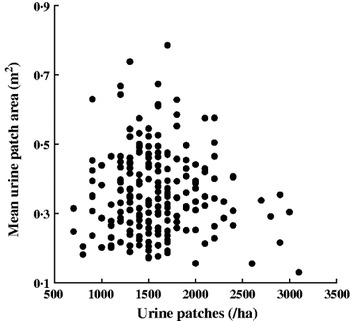
The 4-year mean of the number of urine patches/ha observable at any one time was 1560±31, with a cv. of 0·23. On a within-season basis, values ranged from 1460±99 patches/ha in winter to 1660±60 patches/ha in autumn. The number of urine patches/ha was unrelated to the area of the urine patches (Fig. 2). Mean total urine patches/ha/yr ranged from 5600 to 8400. The effects of year and season were not significant at P<0·05, but significant at P<0·10. There was a significant year×season interaction effect (P=0·03). Using specific contrasts, there were significantly (P<0·05) lower patch numbers in winter compared to other seasons, and higher numbers in 2006/07 compared to other years.
The relationship between the mean numbers of observable urine patches/ha and mean urine patch area.

Area coverage varied significantly (P<0·001) between seasons, with the highest coverage in spring and summer and lower coverage in winter and autumn (Table 4). For any one observation event, the total area covered by urine patches ranged from 0·0015 to 0·136. Mean seasonal coverage ranged from 0·043±0·0031 (winter 2003) to 0·076±0·0035 (autumn 2007) and annual mean coverage from 0·216±0·0144 (2003/04) to 0·252±0·0130 (2006/07). The mean annual coverage value for a single seasonal observation was 0·058±0·0018 (cv. 0·33). A significant year × season interaction effect was also observed (P<0·001).
The total mean coverage varied between the years and was not significant at P<0·05, but was significant at P<0·1. Annual coverage increased steadily from 2003/04 to 2006/07. The average annual coverage of pasture by deposited urine was 0·232±0·008 (Table 4). The range of annual coverage for the 4-year measurement period was 0·196–0·299. A trend of increasing annual coverage by urine patches was observed however, whereby the mean annual coverage value was significantly higher for specific contrasts at P<0·05, those being 2006/07 coverage >2003/04 and 2004/05 and 2005/06>2003/04.
Relationships between stocking intensity and urine area coverage
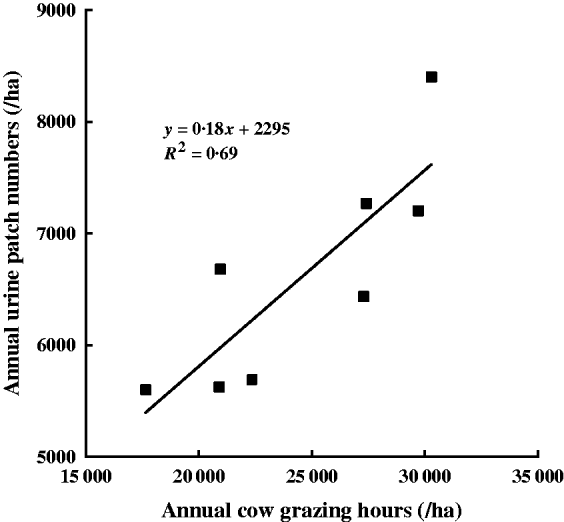
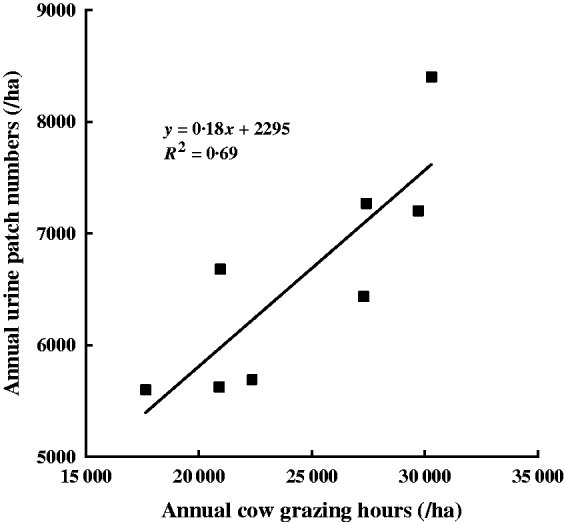
The relationship between total annual cow grazing h/ha and mean annual urine patch numbers/ha for all years is presented in Fig. 3. A strong, positive linear relationship (R 2=0·69) was found between this index of grazing intensity and the mean annual number of urine patches observed at each sampling date. The slope of this relationship indicated that, within the stocking densities observed in this study, an increase of 10 000 cow grazing h/ha would result in an increase of 1800 urine patches/ha/yr.
The relationship between total annual cow grazing h/ha and annual urine patch numbers/ha for all years. n=8, P=0·01.
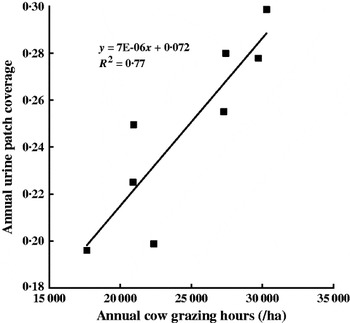
A very strong (R 2=0·77) linear relationship was found between total annual cow grazing h/ha and annual urine patch coverage (Fig. 4). The clear positive linear relationship indicated that increasing annual grazing intensity, as measured by cow grazing h/ha/yr, had a direct effect on area coverage by urine patches. The slope of the relationship showed that an increase in annual grazing intensity of 10 000 cow grazing h/ha/yr resulted in an annual increase in urine patch coverage of 0·07.
The relationship between total annual cow grazing h/ha and mean annual urine patch area coverage (proportion) for all years. n=8, P=0·004.

Response duration and spatial distribution of patches
A spatial GIS analysis of data revealed that the urine depositions in the present trial were random. No obvious congregation effects such as stock camping were observed. During GIS data analysis, numbers of urine patches appearing in more than 1 GIS ‘layer’ (i.e. at more than 1 field sampling date) were low. Of the total >3000 urine patch observations made in this study, only 192 urine patches were deemed to be urine patches observed across seasons (sampling dates). These patches, demonstrating a long duration of pasture growth response to urine deposition, were removed from the dataset for the purposes on analysing data from subsequent sampling dates.
Using the ‘Nearest Neighbour’ function in ArcGIS, all data were statistically analysed in order to assess the degree of randomness or clustering of urine patches on a spatial basis. The result of this statistical analysis indicated that across all plots and all years of this study, urine patches were randomly deposited. The Nearest Neighbour statistical analysis indicated that urine patches were randomly (P=0·27) deposited, rather than being clustered (non-random). The observed mean distance between urine patches was 0·31 m for the 4-year dataset.
DISCUSSION
Stocking density
At a mean whole farm stocking density of 3·6 cows/ha, the LUDF is at the high end of the range of stocking densities on New Zealand dairy farms. Therefore, it also follows that the grazing densities reported in the present study will be high. Although cow numbers entering the paddock to graze were almost identical for the two experimental paddocks, the grazing intensities and therefore effective stocking densities were quite different (Table 1).
The total cow grazing h/ha in paddock 2 (114 702) was 40% higher than those measured for paddock 1 (81 841) for the 4-year duration of the trial. This difference was a direct effect of the number of days that the cows spent grazing the paddocks, which in turn is driven by the overall productivity of the paddocks, in terms of DM/ha/yr grown (and therefore consumed). It is clear from this result that, agronomically, paddock 2 is more productive than paddock 1, because it was grazed for longer.
Seasonal cow grazing h/ha varied within and between years. Typically, cow-grazing hours were highest in spring and summer months, when pasture growth rates (kg DM/ha/d) and cow feed demand are highest and lowest in winter and autumn months when the reverse is true. However, this was not the case for the autumn of 2003 and the winter of 2005 because of the unseasonably warm climatic conditions at these times, resulting in higher pasture growth rates.
Annual total cow grazing h/ha increased moderately from 2003/04 compared to other years, in both paddocks. This result is not surprising given that the farm was only recently converted to dairying from a low-fertility sheep farm in 2001/02, and therefore the farm was probably still in a ‘development phase’ (in terms of productivity) in 2003/04. However, this does not completely explain the grazing intensities in these paddocks following 2003/04. It is likely that variable site-specific climatic conditions, influencing annual DM production, have caused some variation in annual grazing intensities between years.
Urine patch size
The mean surface area of field urine patches in the present study was 0·37±0·009 m2. This value agrees very well with the summary of data given in Haynes & Williams (Reference Haynes and Williams1993). Given that the literature mean for cattle-wetted urine area is 0·2 m2, the present data also support the suggestion of Doak (Reference Doak1952), that the pasture response area may in fact be larger than that of the area wetted by urine. MacLusky (Reference MacLusky1960) estimated that 0·68 m2/cow/d receives urine, which equates to a very low annual coverage value of <0·1 of the paddock area. The present data and others (e.g. White et al. Reference White, Sheffield, Washburn, King and Green2001) suggest a value of 3·3 m2/cow/day. Estimates of the total urine patch area coverage were, however, unclear in the study of White et al. (Reference White, Sheffield, Washburn, King and Green2001).
These data suggest that the urine patch area varied significantly between seasons and years. Overall, urine patch response areas were smaller when the urine was deposited in winter and autumn months. The significant year×season interaction effect indicates that year-to-year variation in seasonal climate may be the dominant factor influencing this variation. For example, in the winter of 2006, the field site experienced a wetter than average winter (100 mm above the long-term average). Correspondingly, the areas of urine patches deposited that winter were smaller. It is clear from the literature that N leaching loss from urine patches is most likely during winter months, when soils are saturated and draining (Di & Cameron Reference Di and Cameron2000, Reference Di and Cameron2002a; Moir et al. Reference Moir, Cameron and Di2007). This is the likely explanation for smaller urine patches in winter months in this study. Other factors may also have contributed to this result, including seasonal variation in animal feed and water intake. Smaller urine patches in autumn may be the result of lower feed intakes by cows at this time of year, potentially resulting in lower levels of N excretion in urine. Cow water intake and seasonal temperature differences may also impact urinations, in terms of both urine N concentrations, and the frequency of urinations, as suggested by White et al. (Reference White, Sheffield, Washburn, King and Green2001). Moreover, pasture N content varies through the year, which must also impact on cow urine N concentration. However, reported data on these aspects is scarce for grazed pasture systems. Further research would therefore be required to fully explain the present result.
The urine patch size data presented here represent the pasture growth response area resulting from a deposited cow urination event. There is some suggestion in the literature that this growth response area is larger than the actual area of soil wetted by urine at urination. This is likely because plant roots at the edge of the wetted area are able to utilize the nearby urinary N, even though these roots have not been directly wetted. The lateral movement of solute in soil at the edge of the patch will also have likely influenced the surface area of soil wetted by urine (Tinker & Nye Reference Tinker and Nye2000; Assefa & Chen Reference Assefa and Chen2008). Of those workers who have measured the area wetted by urine, Doak (Reference Doak1952) reported an area of 0·4 m2 (with an additional 0·13 m2 ‘urine affected indirectly’) and others (Williams et al. Reference Williams, Gregg and Hedley1990; Williams & Haynes Reference Williams and Haynes1994) reported an area of 0·38–0·42 m2 wetted directly. However, the pasture growth response area measured in this study does in fact represent the surface area affected by urine deposition, either directly or indirectly. If not, the urine-affected pasture would not exhibit a pasture growth or nutrient uptake response when compared with the surrounding areas of pasture, which have not received urine. Likewise, it is also clear that the 200 kg N/ha applied as fertilizer on this farm (split dressings of 25 kg N/ha/application) does not result in a ‘biological-optimum’ growth level in the pasture, otherwise pasture growth responses in urine patches would, again, not be observed. For those researching nutrient loss from urine-affected pasture soils, the pasture growth response area is therefore of real interest. Further research is required to establish a clear relationship between the area wetted by urine and the associated pasture growth response area.
Urine patch numbers, area coverage and duration
The numbers of urine patches observed at any one seasonal sampling varied from 1300 to 2100 patches/ha. On a mean annual basis, this value was consistent, at 6240±124 patches/ha. There were significantly (P<0·05) lower patch numbers in winter compared to other seasons and higher numbers in 2006/07 compared to other years. A significant year×season effect on patch numbers was observed, suggesting that the number of observable urine patches per unit area was strongly related to short-term grazing intensities (cow grazing h/ha) and management, as would be expected. The result also suggests that the sampling interval of 3 months used in this study was sensitive enough to detect short-term changes in grazing management, and further suggests that the pasture growth response to urine deposition was 3 months or less.
Several workers have estimated a value for the daily frequency of cow urinations: Petersen et al. (Reference Petersen, Lucas and Woodhouse1956) states 8, Aland et al. (Reference Aland, Lidfors and Ekesbo2002) 9 and Oudshoorn et al. (Reference Oudshoorn, Kristensen and Nadimi2008) 5–7 urinations/cow/day. Given these estimates of urinations/day, and the stocking densities measured in this study, we might expect to observe 1400–1900 urine patches/ha at any one time, accounting for all of the urination events, and all patches presenting a pasture growth response at the same time. This range agrees very well with the mean value of 1560 patches/ha found in this study.
Not surprisingly, numbers of urine patches deposited/ha and the area of the individual urine patches were independent variables in this study (Fig. 2). Urine patch numbers were driven by stocking densities, while patch ‘size’ was probably controlled by volume of the urination, urine N concentration and climatic conditions.
The annual urine patch coverage values ranged from 0·196 to 0·299, with a 4-year mean of 0·232±0·0071. Season had a significant effect on urine patch coverage, and the mean annual coverage value was significantly (P<0·05) higher for specific contrasts, those being 2006/07 coverage >2003/04 and 2004/05, and 2005/06>2003/04. The significant year×season interaction effect suggests that the seasonal variability within years, to some degree, masked the differences in coverage between years. A trend of increasing urine coverage from 2003/04 to 2006/07 was therefore observed, perhaps reflecting the increase in intensity on the farm over that period. This is supported by the positive linear correlations seen between cow grazing h/ha and urine patch numbers (Fig. 3) and annual urine patch coverage (Fig. 4).
White et al. (Reference White, Sheffield, Washburn, King and Green2001) measured the frequency and location of urinations and defecations of dairy cows for 5×20 h and 1×13·5 h grazing periods in a 1-year study. The position of all urine and dung patches were marked by observers in the field, then later mapped using surveying equipment. Taking an average area coverage for urine (0·36 m2) and faeces (0·12 m2) based on literature values (Wilkinson & Lowrey Reference Wilkinson, Lowrey, Butler and Bailey1973), they calculated an area coverage of excreta of 0·07 of the total paddock area for urine and 0·03 for dung at a whole-farm stocking density of 2·48 cows/ha; that study grazed 36 cows on 0·74 ha, or 48·6 cows/ha, for a total of 113·5 h. These values equate to a total of 7463 cow grazing h/ha, resulting in 2058 urine patches/ha and a paddock urine coverage of 0·07. Using the value of 9·0 urinations/cow/day (White et al. Reference White, Sheffield, Washburn, King and Green2001), in combination with the mean annual cow grazing h data found in this study (24 569 cow grazing h/ha/yr), the estimated value for number of urine depositions is 6187 urine patches/ha/yr, with 0·229 annual coverage. This estimated value is very close to the present measured value of 6240±124 urine patches/ha/yr and 0·232 total annual paddock coverage. From this comparison it can be concluded that the present data agree very closely with that of White et al. (Reference White, Sheffield, Washburn, King and Green2001). Given that White et al. (Reference White, Sheffield, Washburn, King and Green2001) used direct observation of cow urine deposition as the measurement technique, it would seem that the GPS measurement technique used in this paper has been successful in measuring actual cow urine patch deposition and area coverage in the field. Any difference between coverage estimates from these two studies may possibly be explained by the cows in the White et al. (Reference White, Sheffield, Washburn, King and Green2001) study having higher milk yields than the New Zealand cows (24 v. 18 litres milk/cow/day, respectively). The cows of White et al. (Reference White, Sheffield, Washburn, King and Green2001) also received supplementary feed (grain) at 3·6–18 kg DM/cow/day, whereas the New Zealand cows are pasture fed. It would be logical to assume that these contrasting levels of production and feeding regimes may affect cow urinations, whereby higher-producing cows produce more urine. More research is required in this field.
Some short-term observations of grazing dairy heifers were made by Petersen et al. (Reference Petersen, Lucas and Woodhouse1956), although focused on dung rather than urine depositions. These workers concluded that a negative binomial function was in close agreement with measurements of the distribution of dung patches and probably also urine patches. The negative binomial function allowed for the fact that an area may be covered more than once by excreta (i.e. overlapping of patches) and that there will be an increased amount of dung deposited in areas of special attention (e.g. stock camp areas). The detailed calculations of Richards & Wolton (Reference Richards and Wolton1976), based on Petersen et al. (Reference Petersen, Lucas and Woodhouse1956), using a ‘non-overlap’ function, estimated that for a single grazing 0·04–0·09 of a paddock surface might be covered by urine and 0·006–0·012 covered by dung at different stocking densities. Assuming that urine patch overlapping occurs, they used a negative binomial function and calculated that 0·23 of a paddock might be covered annually. These values agree well with the current findings. Unlike the analysis of Richards & Wolton (Reference Richards and Wolton1976), this study has been able to distinguish between ‘fresh’ and ‘old’ urine depositions, which is a critical aspect of these calculations. Our study also demonstrated that urine depositions at our field site were random in nature. This is almost certainly because the sampling system was designed to measure ‘typical’ grazing areas of the paddocks and so excluded areas that might be ‘non-random’, such as near gateways and drinking troughs. Therefore, this result suggests that the sampling strategy was correct.
Another worker using the formula of Petersen et al. (Reference Petersen, Lucas and Woodhouse1956) to estimate urine patch coverage was Williams (Reference Williams1988). For a stocking density of 1094 cows/ha/yr on a New Zealand dairy farm and an average number of defecation per day and area covered by urine and dung, she calculated that 0·23 of pasture would be covered in excreta (i.e. dung and urine) in 1 year. If one assumes a urine: dung patch area ratio of 0·07:0·03 (White et al. Reference White, Sheffield, Washburn, King and Green2001), the estimate of Williams (Reference Williams1988) of 0·23 coverage appears high for the given stocking density. The assumptions used in that study are unclear, and therefore cannot be easily compared with the present findings. More recently, Whitehead (Reference Whitehead2000) calculated a urine coverage area of 0·21 for dairy cattle grazing at an intensity of 700 cow days/ha/yr. He assumed a urination frequency of 10 urinations/cow/day and 0·85 of the urinations being field deposited, plus an average area per urination area of 0·35 m2 with no overlapping. Both the grazing intensity and area coverage values of Whitehead (Reference Whitehead2000) agree well with the data from this study.
Theoretical mathematical estimations of urine patch ‘overlapping’ functions were used by Pleasants et al. (Reference Pleasants, Shorten and Wake2007), with a focus on N leaching from grazed pastures. These workers estimated that for a 24 h grazing×2·5, at a stocking density of 180 cows/ha; 1378 m2 of urine patches, 60 m2 of ‘double’ urine patches and 1·6 m2 of ‘triple’ urine patches may result. These are useful estimates, and support the work of others (e.g. Richards & Wolton Reference Richards and Wolton1976), suggesting that at ‘typical’ grazing densities on New Zealand dairy farms, the probability of cows urinating on top of other fresh urine patches is very low.
A strong linear relationship was found between annual cow grazing h/ha and i) annual and seasonal urine patch numbers/ha (R 2=0·69) and ii) seasonal and annual area coverage (R 2=0·77) in this study. This result provides strong evidence that, within the range of stocking densities reported here, that urine patch numbers and annual coverage increase in a linear fashion with increasing annual cow grazing h/ha. This is an important finding, and provides robust data, which support and confirm historical empirically calculated estimates of previous workers. From the slopes of these relationships, an increase in stocking intensity of 10 000 cow grazing h/ha/yr would increase the annual urine patch coverage of paddocks by 0·07. This value represents a 33% increase in the total surface area cover by urine patches.
An important assumption in this study is that the pasture response period is unlikely to extend beyond 3 months after urine deposition (Haynes & Williams Reference Haynes and Williams1993). This assumption appears correct, given that of the >3000 urine patches observed in this study, <200 appeared at more than one sampling event. Even though the latter value has been corrected for in the present dataset using a detailed spatial GIS analysis, data describing the duration of pasture growth response to urine deposition, and the effect of climatic factors on this response period, is very scarce in the literature. Also, though an extremely unlikely event, specific conditions may arise whereby pasture exhibits a delayed response to urinary N deposits or no response at all. This would contribute to a slight underestimate of urine coverage. Thus, more research on the dynamics of pasture growth response to urine depositions is required.
Implications of stocking intensity
Although cow numbers entering the paddock to graze were almost identical for the two experimental paddocks in this study, the grazing intensities, and therefore effective stocking densities, were quite different (Table 1). This was an intentional part of the design of the study. Therefore, the range of annual grazing intensities was a positive result, given that an aim was to determine if there was a quantifiable relationship between grazing densities and numbers and annual spatial coverage of urine patches. The resulting relationship (Fig. 4) indicates that an increase of 10 000 cow grazing h/ha/year results in a 33% increase in annual surface cover of urine. This represents a large increase in soil N loading, and demonstrates the high risk associated with winter grazing events. A paddock grazed by 300–400 cows over a 5-day period would represent >6000 cow grazing h/ha. As the key measure of grazing intensity in this study, cow grazing h/ha/yr has been shown to be a useful indicator of urine deposition by grazing dairy cattle.
Increasing annual urine coverage on the farm probably resulted from an increase in intensification (whole farm stocking density, cows/ha) between 2003/04 and 2006/07. Variation in seasonal and annual climate also influenced the intensity of grazing between years, as would be expected. Potentially, other factors may influence spatial N urinary loading when grazing intensification increases. The effects of higher-producing cows, consuming more pasture or different feeds (e.g. with varying N contents) and potentially excreting more N, is not known. Future research needs to address these questions.
This study has focused on stocking intensities in the moderate to high range for New Zealand pastoral dairy farms. Although in a previous study, Moir et al. (Reference Moir, Fertsak, Cameron and Di2006) also studied urine patches on a low-intensity sheep and beef farm, more research is required in low stocking intensity systems. Such research would provide for a better understanding of how urine patch deposition varies for a wide range of stocking intensities, stock classes and farm management systems.
In conclusion, a new GPS methodology was successfully used to accurately quantify dairy cow urine depositions on a spatial and temporal basis. Under annual stocking densities ranging from 17 645 to 30 295 cow grazing h/ha, urine depositions were shown to be of the order of 5600–8400 patches/ha/yr, which varied between seasons and years of measurement. A strong linear relationship (R 2=0·77) was found between annual grazing intensity (cow grazing h/ha/yr) and the proportion of the paddock area covered by urine depositions annually. For the farm studied, over a 4-year period, the mean annual urine patch area coverage was 0·232±0·0071 and the mean urine patch area was 0·37±0·009 m2.
This research was funded by DairyNZ and the New Zealand Ministry of Agriculture and Forestry (Sustainable Farming Fund). We thank B. Case for GIS data analysis and S. Dennis, C. Barlow and H. Masters for valuable assistance with fieldwork. We acknowledge with thanks the helpful comments of the referees and editors.