

“It is too early to say.”
—Zhou Enlai's alleged response to Henry Kissinger's question about the consequences of the French Revolution.Most current explanations of interstate warfare adopt what could be labeled a “micro-level” perspective. This perspective is characterized by a tendency to study warfare on a disaggregated, case-by-case basis, and by attempts to predict individual outcomes by examining variation in the local contexts in which wars emerge in ever greater levels of specificity and detail. In this way, the broad sweep of historical forces operating at the “macro level” have generally been relegated to the sidelines of empirical inquiry. Fearon and Laitin succinctly summarize the conventional wisdom:
In explaining World War I, we do not typically demand an account of why France and Germany were separate countries in 1914…. Nor is an explanation for interstate war in general thought to require an account of why there is a states' system, though the question is certainly interesting and fundamental for international relations theory.Footnote 1
In this article we stand this logic on its head. While a micro-level explanatory strategy represents a perfectly valid attempt to confront the overwhelming complexity of geopolitics, and while we do not dispute the substantial advances that have been generated within this research tradition, it is far from the only path available for rigorous scientific inquiry. Indeed, we argue that by adopting an exclusively micro-level orientation to empirical analysis, the field of international relations risks sometimes missing the forest for the trees by obscuring the crucial role played by macro-historical processes operating at the global level.
Proceeding instead from a “macro-level” perspective, we argue that the emergence of mass nationalism following the French Revolution represented a profound example of what Gilpin calls “systems change,” which fundamentally altered the nature of the units constituting the interstate system, thereby transforming the global production of interstate warfare.Footnote 2 Following the observations of Clausewitz, who witnessed firsthand the destruction wrought by the unprecedented arrival of Napoleon's levée en masse, we claim that the emergence of nationalism at the turn of the eighteenth century ushered in a substantial increase in the capacity of states to inculcate mass loyalties and mobilize mass armies, which in turn generated deep tensions between the principles of territorial sovereignty and popular sovereignty that have driven patterns of interstate warfare ever since. Based on this reasoning, it is possible to trace the roots of the world wars of the twentieth century all the way back to the epochal events of 1789.
To validate these assertions—and thus to test Clausewitz—we rely on quantitative evidence at the macro level, with a particular focus on the global distribution of interstate war sizes, measured in terms of battle deaths, over the past five centuries. In doing so, we make a number of methodological departures from the practices commonly used in quantitative studies of interstate warfare. Rather than performing disaggregated regression analysis on the central tendencies (that is, means) of our samples in an attempt to estimate the parameters influencing the severity of individual events, we examine aggregate global distributions of the frequencies of the most extreme events in our samples (that is, the tails). In particular, we demonstrate that temporal discontinuities in the shapes of such tail distributions can be used to draw inferences about the nature of the mechanisms underlying the bloodiest events in world history.
In making this demonstration, we draw on the statistical tools of extreme value theory (EVT) and the emerging science of complex systems, introducing for the first time to political science a set of parametric and nonparametric techniques well-suited to the analysis of extreme event sizes. These tools allow us to show that the interstate system experienced a fundamental shift in the mechanisms underlying the production of war sizes; a shift that can be dated with remarkable precision to the years 1770–1810, and that resulted in a systematic increase in war severity. These same tools also allow us to rule out a number of alternative explanations for this shift (including changes in population sizes and changes in weapons technology), while providing evidence for a specific account of war severity rooted in the mobilizational capacities of states. More broadly, our analysis points to the intriguing possibility that commonalities exist in the mechanisms by which war sizes are produced that transcend the particularities of time and place that have occupied the attention of nearly all quantitative studies of interstate conflict to date.
The article proceeds as follows. First, we introduce the notion of systems change and illustrate its basic dimensions by contrasting two paradigmatic examples of such change: the emergence of the territorial state in early modern Europe (territorial systems change), and the emergence of nationalism in the late eighteenth century (nationalist systems change). Then, we review in more depth the central mechanisms underlying the emergence of nationalist statecraft and trace its consequences for the severity of interstate wars. Following this, we derive our central empirical result, demonstrating that a temporal discontinuity in the distribution of war sizes occurred at precisely the time of the French Revolution, resulting in dramatically more severe conflicts after 1789. We then present our theoretical argument that this shift resulted from an increase in the capacities of states to mobilize loyal combat forces, before conducting robustness checks on our central finding. These tests allow us to reject alternative explanations rooted in population growth or technological advancement, while also providing additional evidence linking patterns of military mobilization to the emergence of extreme wars. Finally, we conclude by discussing the implications of our results for future research.
Systems Change in World Politics
According to Gilpin's classic typology, the international system can undergo three forms of change, organized in order of increasing comprehensiveness.Footnote 3 Interaction change involves interstate processes, such as the movement of military forces, the reconfiguration of alliances, or shifts in the cross-border flows of capital and currency. It is at this level that we find the foreign actions upon which most contemporary work in international relations focuses. The next level features systemic change, which pertains to the governance of the system and the arrangement of its units. It is at this level that Waltzian theories of system structure are located, which focus on the changes in the distribution of military power, reconfigurations of the territorial boundaries of states, and shifts in the international hierarchy of prestige.Footnote 4 Finally, systems change refers to transformations of the system that are so fundamental as to alter the very nature of the system's constitutive units. Here we find the truly epochal revolutions of international history that give rise to entirely new types of geopolitical actors.
Viewed as a special case of this broader category, nationalist systems change can be defined as the macro-historical transformation that brought about the emergence of mass nationalism (that is, the generation of national loyalties on a mass scale) and led nations to play a central role on the world stage along with states, roughly from around the time of the French Revolution. Such transformations can be understood as instances of “sociation” (“Vergesellschaftung”), the endogenous process described by Simmel, through which action and agency constitute each other interactively in a co-evolutionary fashion.Footnote 5 They can also be seen as examples of what Wendt refers to as “constitutive effects,” as they represent changes in the fundamental terms through which identities are defined and rendered relevant for sociopolitical actors.Footnote 6 However, whereas Wendt focuses on the constitution of “type identities” that relate to the beliefs, values, and roles of states, here we are primarily interested in the constitution of “corporate identities” that define the geographic and demographic membership criteria of states.
In the nationalist era, such criteria came to be increasingly defined on the basis of narratives, symbols, and rituals that could be shared not just amongst a rarefied elite, but amongst a broader cross-section of the citizenry that (at least partially) transcended the geographic, cultural, and economic cleavages that might otherwise divide a country against itself. It is through such advances that states gained the capacity to forge collective loyalties on an unprecedented scale, and to endow them with sufficient force as to induce a willingness to fight and die for an imagined “nation.”Footnote 7 Thus, when we speak of the emergence of “nationalism” in the late eighteenth century, we do not simply mean the classical doctrine that nations and states should be territorially congruent.Footnote 8 Nations are not natural, pre-existing features of the geopolitical landscape, but rather collectively imagined abstract categories promoted by states and would-be states to facilitate the production of corporate identities that can persuade citizens of the legitimacy of their joint sacrifices. We thus treat the term “nationalism” as shorthand for a whole host of interrelated processes and practices that gained prominence in European statecraft around the time of the French Revolution, including appeals to popular sovereignty; common primary education for citizens; widespread generation of nationalist symbols, images, stories, myths, and histories; and the mobilization of mass armies. We argue that adoption of this set of fundamental innovations in the technology of statecraft transformed the very nature of the units comprising the interstate system, profoundly altering both the constitution of state corporate identities and the production of interstate warfare.
The Emergence of the Territorial State
Before discussing the innovations of nationalist statecraft in more depth, it will be helpful to first consider an earlier, paradigmatic instance of systems change: the emergence of the territorial state in early modern Europe. This transformation, which we refer to as territorial systems change, saw for the first time the construction of states claiming absolute internal dominion and sharp territorial boundaries. The generation of this new constitutive form was rooted, first and foremost, in a novel idiom of territorial sovereignty—a style of claim-making that hinged critically on the concepts of political legitimacy introduced by thinkers such as Niccolo Machiavelli, Jean Bodin, and Thomas Hobbes. The modern idea of territorial sovereignty revolutionized political legitimacy in a way that differed dramatically from that found in premodern empire, the predominant large-scale organizational form throughout the Middle Ages.Footnote 9 Whereas imperial rule operates through domination radiating out from a political center and gradually tapering off in contested frontier areas, the modern territorial state is a clearly demarcated organization that controls its territory through the principle of “descending sovereignty,” which grounds the locus of political loyalty in the sovereign ruler to whom the population is subordinate and dependent.Footnote 10
The territorial state also represented a revolution in the methods of resource extraction. The poor means of communication in medieval Europe forced the kings and emperors in the Middle Ages to “outsource” the extraction of resources to vassals and fiefdoms through feudal contracts that granted these proxies far-reaching control and rights to extract tribute from their respective peasant populations against the promise to render military services. The emergence of the territorial state in early modern Europe thus entailed a profound shift from indirect to direct rule that allowed rulers to gain direct coercive leverage over their subjects without interference from competing political power centers. This coercive capacity was most clearly expressed in improved procedures for tax collection and standardization of measures and currencies that led to considerable economies of scale in the provision of coercive force.Footnote 11
This profound internal restructuring went hand-in-hand with revolutionary changes in the conduct of interstate warfare. Following Hintze's pioneering arguments,Footnote 12 it can even be claimed that this revolution in military affairs, which brought about the shift from disorganized, ad hoc armed forces to modern standing armies and the concomitant increased scale of combat in the late Middle Ages, initiated and further escalated the processes of state formation:
A consequence of the new wars was the diffusion of new technology and a fundamental transformation of military structures. Armies became much larger, adopted new techniques and weaponry, and expanded central organization. Warfare became an extremely onerous and politically sensitive fiscal burden.Footnote 13
In an environment of growing geopolitical competition, rulers had little choice but to extract more resources from their subjects, thus paving the way for bureaucratic expansion and standardization. In contrast to the chaotic nature and limited size of warfare in medieval times, which was rooted in feudal levies and mercenary troops, the new era saw the state-led buildup and training of standing professional armies that introduced more regularity and discipline into warfare, while also expanding its scale.Footnote 14
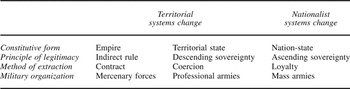
In summary, then, territorial systems change can be seen to consist of three central shifts in the nature of the units constituting the international system, as summarized in Table 1. First, it entailed a shift in the principles of political legitimacy, from indirect rule to descending sovereignty. Second, it entailed a shift in the methods of resource extraction, from feudal contracts to coercive taxation. And third, it entailed a shift in the modes of military organization, from irregular mercenary forces to standing professional armies.
Dimensions of systems change

A Theory of Nationalist Systems Change
While representing a watershed in political organization and warfare, the emergence of the territorial state in early modern Europe and the associated “Westphalian moment” is not the only consequential instance of systems change in world politics. Here, we focus on nationalist systems change, which can be defined as the macro-historical transformation that saw the emergence of mass nationalism (that is, the generation of national loyalties on a mass scale) and led nations to play a central role on the world stage along with states, roughly from around the time of the French Revolution. As with territorial systems change, the elements of this transformation can be productively divided into three main dimensions: new principles of political legitimacy, new methods of resource extraction, and new modes of military organization (see Table 1). We address each dimension in turn.
Principles of Political Legitimacy
As numerous historians have recognized, the tumultuous upheavals of 1789 represented first and foremost a repudiation of traditional sources of political legitimacy. As opposed to the “descending” principle of territorial sovereignty that justifies governance in personal, dynastic, or even divine terms, the French Revolution introduced an “ascending” logic that defines the people, conceived of as the nation, as the locus of political legitimacy.Footnote 15 Following the famous declaration of Abbé Siyès, it was now the nation as a whole, rather than the monarch, that assumed the responsibilities of sovereignty. As Hintze explains in his classical analysis of the relationship between political and military organization:
The whole system rested on that altered concept of the state, whose germ was the awakening of political consciousness in the population, the image of the state becoming an affair not merely of the rulers but of the ruled and being conceived of as a community, a corporative collective personality.Footnote 16
In the words of Hall, the emergence of this “entirely new social entity” fundamentally reconfigured the structure of both internal and international politics:
In the nationalist era, statesmen were no longer speaking with the voice of a prince, a dynastic house, or of a kingdom, or empire—the territorial patrimony of the traditional European conception of sovereignty. Nor did they any longer articulate these interests or goals. The statesmen of nation-states began speaking in the voice of a sovereign people, a collective actor possessed of a collective identity and collective interests and goals, in the context of both domestic and international social interaction.Footnote 17
In a careful study of the development of state sovereignty, Osiander criticizes conventional approaches to this topic for fixating on the Peace of Westphalia, when “the most significant transition occurred with the French Revolution.”Footnote 18 Agreeing with this criticism, Bukovansky contends that:
International relations theorists today tend to overlook the French Revolution's importance to the evolution of the international state system, largely because of the way in which structure is understood in neorealist international relations theory.Footnote 19
Likewise, Sir Lewis Namier argues that “the political problems of the European Continent in the nineteenth century were posed by the French Revolution; and the basic change that it ushered in was the transition from dynastic to national sovereignty.”Footnote 20 Indeed, F. H. Hinsley went so far as to say that the revolutionary reconfiguration that started in the eighteenth century remains “the only significant change that has so far occurred in history in the central ideas that men have brought to the conduct of relations between states.”Footnote 21
Methods of Resource Extraction
This shift in the definition of internal political legitimacy enabled a transformation of the means through which resources were extracted and distributed within the polity. With the dominant idiom of political authority shifting from a descending to an ascending notion of sovereignty, the ruling elite could no longer rely primarily on brute coercion to tax their subjects. In fact, the French Revolution itself can be seen as a failed “appeal by the state to the nation” to extract taxation without representation.Footnote 22 In his brilliant analysis of the infrastructural power of the state, Mann explains that direct rule,
is not merely a matter of the state increasing rule over society. Conversely, “citizens” and “parties” also penetrate the modern state. The state has become a nation-state, also representing citizens' internal sense of community as well as emphasizing the distinctness of their external interests in relation to the citizens of other states.Footnote 23
Whereas the prenational, territorial states “were little more than revenue collectors and recruiting sergeants,”Footnote 24 the emerging nation-states greatly expanded their functional scope over the course of the nineteenth and twentieth centuries.Footnote 25 By giving their citizens a direct stake in the political system, initially through legal and political rights and ultimately through the benefits of the welfare state,Footnote 26 nationalist statecraft allowed states to generate far higher levels of political loyalty than the ancien régime. Stressing the role of the French Revolution as a harbinger of fiscal innovation, Ardant observes that “in the nineteenth century, in France as in other countries, the bourgeoisie knew how much its profits were dependent on the management of the state.”Footnote 27 Of course, this process varied greatly in its effectiveness, both within Europe and beyond, and firm senses of identification and loyalty took a great deal of time and energy to construct, even in centralized states such as France.Footnote 28 Still, on the whole, the fiscal revolution associated with nationalist systems change dramatically increased the ease with which rulers could extract currency, capital, and labor from their subject populations.
Modes of Military Organization
The development of nationalist statecraft, and the corresponding shift in the definition of internal political legitimacy, was also associated with a shift in the definition of external political relations.Footnote 29 As many contemporary social theorists have recognized, practices that facilitated the production of homogenized national identities also created incentives for the leaders of states and would-be states to adopt policies of discrimination and exclusion toward those populations that lie outside the imagined bounds of the national community.Footnote 30 Of course, the formation of group boundaries and the salience of identity-based cleavages certainly predate the emergence of nationalism in the late eighteenth century. Indeed, there are good reasons to believe that a tendency toward group biases is deeply rooted in the structure of human cognition.Footnote 31 Nevertheless, while the era of nationalism did not invent all group loyalties and group boundaries, it did dramatically expand their capacity to drive collective violence. As many have noted, the politics of nationalism allows leaders to imbue contested territory with strongly emotional and symbolic meaning,Footnote 32 thus increasing the ease with which political entrepreneurs can mobilize mass conflictFootnote 33 while undermining the search for peaceful bargaining solutions.Footnote 34 As a result, regions where the pull of national loyalties lack territorial congruence with the reach of state intuitions have been found to be uniquely susceptible to bloody internecine warfare.Footnote 35
These observations highlight the importance of recognizing that, while the principles of nationalism are “modular” and thus capable of quickly traveling great distances amongst international elites irrespective of specific ethnic and cultural conditions,Footnote 36 sometimes even arriving “ahead of schedule” before the development of full-scale industrialization,Footnote 37 the adoption of this new technology of statecraft was subject to a highly uneven process of diffusion both within Europe and beyond. As a result, the achievement of the nation-state ideal has occurred at vastly different rates, and with widely varying degrees of success, across the world.Footnote 38 Moreover this uneven diffusion process generated profound tension between the principles of territorial sovereignty on one hand and popular sovereignty on the other that have underlain the dynamics of interstate conflict ever since.Footnote 39
Having participated on the losing side against the Napoleonic onslaught, the Prussian general Carl von Clausewitz was ideally situated to observe the catastrophic effects of this uneven adoption of statecraft technology.Footnote 40 It was not without a certain disdain that he characterized the narrow, technocratic, and ultimately ineffective methods of the ancien régime's approach to war fighting: “Not only in its means … but also in its aims, war increasingly became limited to the fighting force itself.”Footnote 41 It would soon prove that the failure to grasp the logic of nationalist systems change would be fatal to Napoleon's opponents. Analyzing this situation, the great theorist of war renders vividly the consequences of this new mode of military mobilization:
This was the state of affairs at the outbreak of the French Revolution. Austria and Prussia tried to meet this with the diplomatic type of war that we have described. They soon discovered its inadequacy. Looking at the situation in this conventional manner, people at first expected to have to deal only with a seriously weakened French army; but in 1793 a force appeared that beggared all imagination. Suddenly war again became the business of the people—a people of thirty millions, all of whom considered themselves to be citizens.Footnote 42
In response to this crushing defeat, over the course of the nineteenth century it was the relatively authoritarian Prussians who took the lead in introducing educational reforms that had the dual goal of creating citizens ready to participate in civilian life who were at the same time ready to defend the state on the battlefield. As described by Hintze, the French lost their initial advantage after the fall of Napoleon but had no choice but to catch up with the competitive pressure.Footnote 43 After the loss against the Prussians in the Franco-German war of 1870–71, the French launched extensive educational reforms that led to an expansion of mass schooling with the explicit goal of reverting the military loss.Footnote 44
Writing in the post-Napoleonic era, as France, Germany, and other European powers struggled to achieve a competitive advantage in this novel landscape of nationalist mobilization, Clausewitz was among the first to recognize that the profound change in political order represented by the French Revolution had necessarily transformed the conduct of warfare as well, by creating conditions “both in France and in Europe as a whole … that set in motion new means and new forces, and have thus made possible a degree of energy in war that otherwise would have been inconceivable.”Footnote 45 Moreover, while Clausewitz refrained from making firm predictions concerning future trajectories, he clearly realized that it would be difficult to put the genie back into the bottle: “once barriers … are torn down, they are not so easily set up again.”Footnote 46 Thus, while it would be a mistake to claim that Clausewitz predicted the globe-spanning conflicts of the twentieth century, he “was nevertheless among the first to understand that popular participation in the life of the nation propelled warfare toward its extreme and raised at least the theoretical possibility of a conflict like World War I.”Footnote 47 The implication, which we examine empirically below, is that the fundamental causal mechanisms underlying the outbreak of the bloodiest conflicts in human history can be traced all the way back to the epochal events of 1789.
Extreme Values and the Epochs of Interstate Warfare
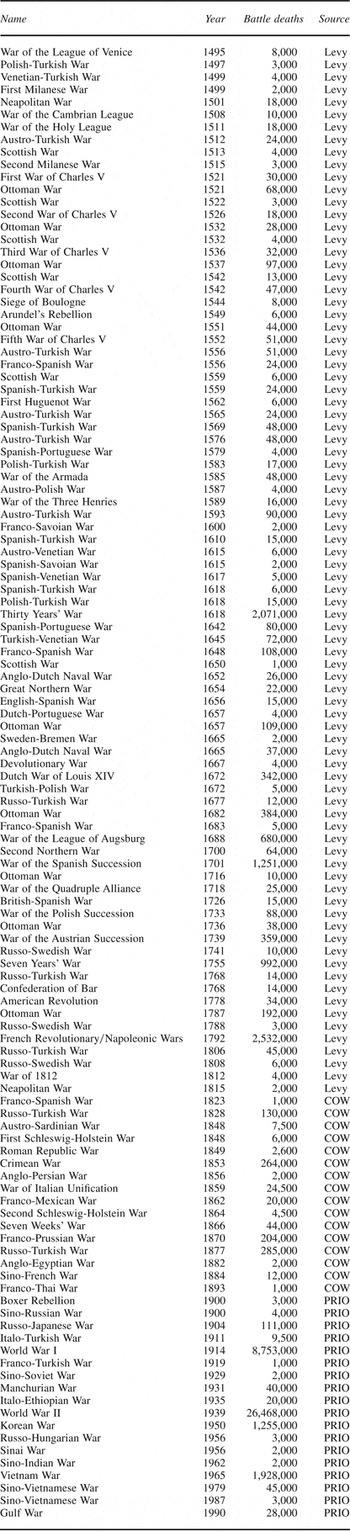
To subject this claim to empirical scrutiny, we begin with a list of all major power wars fought between 1495 and 1975 compiled by Levy.Footnote 48 Using data from the Correlates of War project,Footnote 49 we extend this list to include all major power wars fought through 1997. We also augment the Levy data with corrected casualty figures from the Correlates of War project and Peace Research Institute Oslo (PRIO) battle deaths data set.Footnote 50 For each war, we record the year in which it began, and the total number of battle deaths produced among all belligerents, resulting in a data set of 118 major power wars fought since 1495 (see Table 2).Footnote 51
Major power wars, 1495–1997

Notes: COW = Correlates of War; Levy = Levy 1983; PRIO = Peace Research Institute Oslo battle deaths data set.
The theoretical and historical evidence reviewed above suggests that a major transformation in the severity of interstate warfare occurred around the time of the French Revolution, resulting in dramatically bloodier conflicts between states. How can we use this data to judge empirically whether such a shift in the severity of warfare actually occurred? The standard approach would assume a particular distributional form (frequently Gaussian), summarize the data with an estimate of its central tendency (that is, mean), and ask whether the value of this parameter estimate is different for the subsample of wars that began prior to 1789. However, a burgeoning literature in the field of EVT has recognized that examining sample means under the assumption of Gaussian-like tail behavior can be misleading when an analyst seeks to describe the probability of observing the most extreme events in the sample.Footnote 52 Moreover, these problems are especially critical when analyzing data characterized by “fat-tailed” probability density functions that produce unusually high frequencies of unusually large events.Footnote 53
The key problem when faced with such data is that the normal distribution and others like it feature probability density tails that decline too quickly relative to the size of an event. While social scientists have generally been taught that assumptions of normality are safe because of the Central Limit Theorem, it is important to remember that the theorem guarantees the normality of the means of random variables drawn from a given distribution, not the normality of the tails.Footnote 54 The theorem, in fact, has nothing to say about the distributional form governing the likelihood of the most extreme events observed in the sample. As a result, techniques that are good at quantifying the central tendency of a sample are frequently bad at quantifying the behavior of the sample's tails.Footnote 55
For instance, if we fit a normal distributional form to our list of major power wars, we would conclude that the probability density of war sizes is described by a bell-shaped curve, with a mean of μ = 426,866 and a standard deviation of σ = 2,574,392 battle deaths. While there is nothing inherently incorrect about this description of the data, the shape of the upper tail of this distribution would imply that the probability of ever observing a conflict as large as World War II—which generated more than 25 million battle deaths—is so astronomically small (p < 10−30) as to be essentially impossible. Seen from the perspective of Gaussian tail behavior, the fact that two cataclysms of the scale of the world wars occurred in the very same century thus appears to be such an enormous anomaly that it must be explained on the basis of highly unique, contextual factors that will likely never be seen again in the history of humanity.
An alternative, and less sanguine, perspective is provided by the tools of EVT and the emerging science of complex systems. In a variety of scientific disciplines, ranging from geology to finance, scholars are increasingly coming to the realization that large events in fat-tailed distributions are not “outliers” that defy scientific generalization and therefore require event-specific, contextual explanations.Footnote 56 Rather, these extreme events are simply part of a pattern of tail behavior that is not well approximated by Gaussian models.
One of the most useful tools for visualizing such relationships is the log-log plot, as shown in Figure 1. Each marker on the figure represents a separate war, with crosses representing wars that occurred prior to 1789 and diamonds representing wars that occurred after 1789.Footnote 57 For each of these two subsamples, we plot what are known as complementary cumulative density functions (CCDF), which show the probability of observing events larger than some threshold, x. Because the values are plotted in log-log space, each step along both the x- and y-axes represents an increase by an order of magnitude rather than an increase by a single unit.
Interstate war casualties
Note: Figure shows complementary cumultive distribution functions for the severity (that is, battle deaths) of all major power interstate wars, with minimum threshold x 0 = 10,000. Diamonds represent wars beginningin the period 1495–1789 and crosses represent wars beginning in the period 1790–1997. Solid lines show maximum likelihood estimation (MLE) for the shape parameters (α1 = 0.65 and α2 = 0.35, respectively) of the two subsamples.

Examining the figure, even at first glance one cannot fail to notice a striking regularity: both CCDFs are very nearly linear in log-log space. Indeed, the plot makes clear that there exists a remarkably simple relationship between event size and event likelihood in both subsamples, which takes the generic form:

This is known as a “power-law” distribution, and it means that as the log of event size increases, there is a corresponding linear decrease in the log of the likelihood that such a large event will be observed (a form of decrease which is far more gradual than the exponential decrease of Gaussian tails). Note that −α in equation (1) is simply the slope of the CCDF when plotted in log-log space, as depicted in Figure 1. As α decreases, the most extreme event sizes become less rare, and the upper tail of the distribution grows “fatter.” For instance, α = 3 describes a CCDF in which every doubling of the size of x results in events that are eight times as rare, while α = 2 describes a CCDF in which every doubling of the size of x results in events that are four times as rare. In this way, the shape parameter α provides an easy means of quantifying the “fatness” of a tail and thus the likelihood of observing the most extreme events in our sample.
Such power-law behavior in tail distributions has been observed in a variety of settings, ranging from the magnitudes of earthquakes to the fluctuations of stock prices.Footnote 58 Importantly for our purposes here, this particular distributional signature has also been observed in a number of measures of the severity of human conflict events, including the size distributions of interstate wars, international terrorist attacks, and violence by domestic insurgents.Footnote 59 However, while the observation of heavy tails in the distribution of war sizes has been made before, the field of international relations has been slow to recognize the importance of this empirical pattern. Unbeknownst to most political scientists, over the past two decades the emerging field of “complex systems” has, in a wide variety of empirical settings, found repeatedly that power-law signatures in the distribution of event sizes are characteristic of a particular class of systems, defined by the presence of highly unstable dynamics dominated by the interaction of a large number of independent units, and strong nonlinearities in the processes linking micro-level actions to macro-level outcomes.Footnote 60 For instance, in the context of earthquake magnitudes, Sammis and Sornette argue that the unusually high frequencies of extreme events that characterize power-law distributions frequently arise in such systems due to the operation of positive feedback loops, of the form:

in which the growth rate of some quantity E, is a positive function of E, and thus increasing in time.Footnote 61 When this acceleration is sufficiently fast (that is, m > 1) the result is a “critical state” in which small perturbations in underlying conditions can have dramatically nonlinear impacts on macro-level outcomes, thereby generating the fat-tailed outcome distributions that are characteristic of power-law relationships.Footnote 62
The strongly linear patterns seen in the log-log plot of war sizes thus carry the implication that the fundamental mechanisms underlying the generation of war sizes are characterized by nonequilibrium processes of escalation though which large wars become larger wars. This implies further that events such as World War II are not anomalous outliers in a stable system that normally generates smaller wars. Rather, they are a natural and inevitable product of a highly unstable system of interacting units (that is, states) whose military actions are subject to strong forms of positive feedback. Far from being singular events that require context-specific explanations, the largest wars in recorded human history may thus instead be driven by the same fundamental mechanisms that drive the production of all interstate warfare.
However, mere visual inspection is not proof of a power-law relationship. Indeed, it is possible for a number of alternative distributional forms to appear approximately linear on a log-log plot, including log-normal and stretched-exponential distributions.Footnote 63 To confirm the power-law inference more rigorously, we adopt the TP-statistic recently introduced by Pisarenko, Rodkin, and Sornette to analyze the distribution of earthquake sizes and the distribution of financial returns.Footnote 64 The TP-statistic offers a nonparametric characterization of empirical deviations from the power-law family of distribution functions given by equation (1).Footnote 65 This approach allows us to confirm that our empirical distribution of interstate war sizes is well described by a power-law distributional form (p < 0.05), and that this relationship holds for all wars resulting in at least 10,000 battle deaths (see Appendix).
Having confirmed the power-law distributional form, and found the specific threshold above which this relationship holds, we can then proceed to estimating α (see Appendix). To investigate whether the degree of tail thickness—and hence the likelihood of extreme war sizes—changed around the time of the French Revolution, we divide our list of wars into two subsamples based on whether the wars began prior to 1789 or after 1789. We then calculate separate tail indices for the two periods to judge whether there is a statistically significant change in the probability distribution of extreme war sizes. As can be clearly seen in Figure 1, the shape parameters estimated for these two historical periods are dramatically different. For the period 1495–1789 we calculate that α1 = 0.65 ± 0.1, whereas for the period 1789–1997 we calculate that α2 = 0.35 ± 0.07. The substantial decrease in α for the latter period is strong evidence for a deep shift in the generating process of interstate war sizes, which inclined the global interstate system to produce wars of significantly greater severity after 1789.
Is it possible that this difference is due to mere chance, rather than representing an actual shift in the underlying distribution of war severity? In fact, based on a test of the ratio α1 /α2, we can reject the null hypothesis of equal distributions with a high degree of statistical confidence (p = 0.0045).Footnote 66 Alternatively, the equality of the distributions can be evaluated through a Kolmogorov-Smirnov test, which has the advantage of not relying on the assumption of any particular distributional form—power-law or otherwise—when judging whether two samples were drawn from separate data generating regimes. Using this approach, we again reject the null hypothesis that the two samples were drawn from a common distribution with a high degree of statistical confidence (p = 0.022).Footnote 67
However, while the above tests allow us to conclude decisively that the distribution of interstate war sizes was characterized by significantly more extreme values in the post-1789 period, some readers may wonder about the arbitrariness of the particular year we chose to divide our subsamples and ask whether alternative cut-points might have generated contradictory inferences (for instance, might we have concluded that the critical transition occurred around in the seventeenth century in connection with territorial systems change, as described above). To address this potential criticism, we demonstrate that our inferences are robust to any alternative cut-point that could have been selected. To do so, we construct two intervals around each year t, one that extends backward by T years (t − T; t), and one that extends forward by T years (t; t + T). We then form subsamples of interstate wars that began in each interval and use the Kolmogorov-Smirnov distance metric to judge whether the samples were likely to have been drawn from different distributions. In Figure 2, we plot the value of this distance metric as a function of year t for interval widths of T = 75 years, while noting that robustness checks indicate that our conclusions are not driven by this particular value of T. By systematically varying the cut-points used to form our subsamples, this plot allows us to directly visualize the plausibility of a regime shift in the distribution of war sizes at any point in time.
Kolmogorov-Smirnov distance
Note: Plot shows Kolmogorov-Smirnov distance metric for two subsamples of major power wqrs, defined by the temporal bounds of (t − 75; t) and (t; t + 75). Horizontal line represents the 95 percent confidence threshold for rejecting the null hypothesis that the two samples are drawn from the same distribution.

Remarkably, the 95 percent confidence threshold for the rejection of null hypothesis of equivalent distributions is crossed only once in the five-century period examined here, corresponding to a narrow range of plausible cut-points between the years 1780 and 1790. If we instead look to the 90 percent confidence threshold, this range of plausible cut-points expands to 1770–1810. At this level of confidence, two additional peaks also become marginally significant, corresponding roughly to a temporary decline in the severity of warfare following the Thirty Years' War, and a temporary increase in the severity of warfare in the late seventeenth century culminating in the War of the Spanish Succession. However, neither of these alternative cut-points comes close to the statistical strength of the break identified at the end of the eighteenth century. Thus, consistent with the expectations drawn from the theory of nationalist systems change, we find that there was a sudden and dramatic change in the global distribution of war severity resulting in systematically deadlier conflicts, that the size of this shift was significant both statistically and substantively, and that its timing can be dated to the years immediately surrounding the French Revolution. Moreover, the plot makes clear that while any number of changes have occurred in the severity of interstate warfare over the past five centuries—indeed, scholars of military history have noted a number of “revolutions in military affairs” over this periodFootnote 68—none have matched the impact of the epochal transformation that occurred at the end of the eighteenth century.
Escalatory Feedback in Mass Mobilization
These findings lead directly to the question of whether an underlying causal mechanism could be discovered that would simultaneously explain both the fat-tailed nature of the distribution of war sizes, and why the shape of that distribution changed so dramatically in the late eighteenth century. We hypothesize that the source of the systemic instability behind these findings lies in escalatory feedback loops in state efforts to mobilize combat forces.
Recall from above that power-law distributions of event sizes have frequently been associated with models of complex systems, characterized by positive feedback loops that accelerate the system into a “critical state” in which unusually large events become unusually likely. For instance, in the context of fat-tailed earthquake magnitudes, Sammis and Sornette argue that a positive feedback loop emerges as two tectonic plates slip past each other: as the slip velocity between the plates increases, the coefficient of friction between the plates decreases, which in turn leads to a further acceleration of the slip velocity, culminating in a catastrophic break.Footnote 69
Here, we propose that a similar positive feedback mechanism arises in the context of state efforts to mobilize combat forces. Students of the security dilemma have recognized for some time that there is a strong inclination to view any increase in military mobilization by a neighboring power as potentially threatening.Footnote 70 This implies that the cost of persuading citizens to join the fight in a time of war will be lower to the extent that military mobilization is already proceeding amongst their enemies. Thus, for each soldier mobilized in State A, it becomes that much easier to mobilize the next soldier in State B, and hence easier to mobilize the next soldier in State A, and so on. In other words, the “friction” inhibiting mass mobilization decreases as the “velocity” of mobilization increases in other countries.
On the basis of these simple suppositions, we derive a formal model of interstate mobilizational processes that accounts for positive feedback effects both within a given country and between countries (see Appendix). The model shows that, under very general conditions, we should expect such feedback loops to produce power-law signatures in the distribution of war sizes, as we observe in our data. Moreover, the model demonstrates quantitatively that the observed shift in the distribution of war sizes is consistent with an increase in the strength of the escalatory feedback mechanisms linking state mobilizational efforts.
Indeed, such positive feedback mechanisms have always been fundamental to the Clausewitzian understanding of interstate warfare. Clausewitz reminds us that war “is not the action of a living force upon a lifeless mass (total nonresistance would be no war at all) but always the collision of two living forces.”Footnote 71 As a result, warfare must be understood as a profoundly different endeavor from the “mechanical arts” in which “the will [is] directed at inanimate matter,” because “in war, the will is directed at an object that reacts.”Footnote 72 As Beyerchen argues:
For Clausewitz, the interactive nature of war produces a system driven by psychological forces and characterized by positive feedback, leading “in theory” to limitless extremes of mutual exertion and efforts to get the better of one another. The course of a given war becomes thereby not the mere sequence of intentions and actions of each opponent, but the pattern or shape generated by mutually hostile intentions and simultaneously consequential actions.Footnote 73
Beyerchen includes the qualifier “in theory” because Clausewitz argues that such perfectly maximized exertions could only occur in the idealized abstractions of wars “on paper.” In contrast, Clausewitz claims that “real wars” are characterized by ubiquitous sources of “friction”: failures of statecraft that sap the efficiency of a state's administrative structures and the morale of its troops.Footnote 74
We argue that with the advent of nationalist technologies of statecraft, states experienced a substantial decrease in the cost of inculcating collective loyalties amongst their citizens and persuading them to join in the defense of the homeland, which in turn caused the “friction” inhibiting the acceleration of escalatory feedback loops between states to be substantially reduced. As Clausewitz explains, following the French Revolution:
The people became a participant in war; instead of government and armies as heretofore, the full weight of the nation was thrown into the balance. The resources and efforts now available for use surpassed all conventional limits; nothing now impeded the vigor with which war could be waged.Footnote 75
By tapping into the demographic resources of the entire state rather than relying on mercenaries or professional troops organized in standing armies, Napoleon's levée en masse not only eroded the distinction between warriors and the citizenry but also dramatically transformed the pace and the scale of interstate conflict:
This new system moved masses across half-continents with unprecedented speed; replaced central stores by on-the-spot commandeering of supplies; replaced linear tactics with column attack and dispersed fighting, trusting in the spirit of the men, and holding to only one objective—to locate and annihilate the enemy forces.Footnote 76
The result of these innovations was a dramatic increase, both in the destructive power of individual states, and also in the explosive potential of their conflictual interactions. With the advent of nationalism, escalatory feedback loops in military mobilization—which had always been a central element in interstate warfare—were thus unleashed to an unprecedented degree, fundamentally transforming the global production of war severity.
Robustness Checks and Alternative Explanations
Up to this point, our evidence for the theory of nationalist systems change has consisted largely in the analysis of a temporal discontinuity in the shape of the distribution of war sizes that occurred toward the end of the eighteenth century. However, while we have argued that this discontinuity was the result of the diffusion of nationalist statecraft, a number of alternative explanations for the shift could be offered. In particular, the nineteenth century witnessed the spread of the industrial revolution and a concomitant rise in the ability to mass produce all sorts of manufactured goods, including weapons, steam engines, and railroads.Footnote 77 Such general improvements in economic modernization and technological advancement could certainly plausibly be connected to an increase in war severity, and could therefore potentially undermine our results.Footnote 78
To address this possibility, we normalize our casualty figures to global levels of economic development, dividing each battle death total by the level of world gross domestic product (GDP) per capita for the year in which the war began.Footnote 79 If the temporal discontinuity examined above were really driven by advancements in material technology rather than altered principles of collective identity, this procedure should destroy our ability to observe a corresponding shift in the distributional structure of the normalized data. In fact, we instead find that our results are completely unchanged. Even when casualty figures are adjusted for aggregate levels of economic development, we still find the same power-law relationship between the size of an event and its likelihood, and we still find the same shift in war severity around the time of the French Revolution. Moreover, we note that historians generally see industrialization's impact on warfare as beginning in the late nineteenth century (especially following the U.S. Civil War), a date well outside the confidence bounds of our estimate of the timing of nationalist systems change (see Figure 2).Footnote 80
Along similar lines, the historical periods we examine here were also characterized by rising population levels. As this means that larger numbers of people were available to kill or be killed in interstate warfare, this factor could also plausibly render our results spurious. We therefore normalize our casualty figures to global population levels, dividing each battle death total by the total world population for the year in which the war began.Footnote 81 Again, we find that our results are completely unchanged, indicating that neither aggregate levels of economic development nor aggregate population sizes are sufficient to account for the historical discontinuity we document above.
Of course, there are any number of additional factors that could be raised as potential explanatory variables to account for this shift. Unfortunately, most of these factors simply cannot be measured all the way back to the sixteenth century. As an alternative strategy, we therefore seek to examine variation in tail behavior not across time, but across space. If there are some important determinants of war severity that have been missed, examining variation in tail behavior across geographic regions may give us some insights into which factors are likely to be critical. Because our list of major power wars is concentrated mostly in Europe and therefore does not provide sufficient geographic variation for such analysis, we instead rely on a list of all interstate wars (not just major power wars) since 1816, drawn from the Correlates of War project. While this data lacks the temporal scope to directly investigate the discontinuity of 1789, it represents a dramatic improvement in our capacity to make estimates on the basis of regional variation.
Using the same procedures described in the section above, we confirm that this war severity data is well described by a power-law distributional form, and then proceed to an examination of variation in tail behavior. For each war on our list, we code the location of the fighting on the basis of five world regions: Europe, Asia, Middle East, Africa, and the Americas.Footnote 82 Figure 3 shows the CCDFs for the subsamples of interstate wars fought in Europe, Asia, and the Middle East.Footnote 83 Visual inspection of the plot reveals a surprising result: all three subsamples appear to be characterized by the same shape parameter. In fact, both tail indices and Kolmogorov-Smirnov tests converge on the same conclusion: we cannot reject the null hypothesis that these regional subsamples are drawn from the same underlying power-law distribution. This is a striking result, given the enormous differences in cultural traditions, political institutions, and economic activity that exist between these regions. Indeed, this absence of variation in tail behavior between world regions demonstrates just how fundamental the transformation of nationalist systems change had to be in order to generate the profound shift in distributional form described above: more fundamental than any of the cultural, political, or economic differences that have separated the practices of warfare in these regions since 1816. This result also dramatically reduces the concern that there is some unknown omitted variable driving our central results, as this factor would have to be both sufficiently fundamental to influence the basic generating process of the power-law tails, but also a factor so prevalent that its force could be felt in each of these regions equally. We thus conclude that nationalist systems change is the most likely explanation for the results described above.
Interstate war casualties
Note: Figure shows complementary cumulative distribution functions for the severity (that is, battle deaths) of interstate wars for the period 1816–1997, with minimum threshold x 0 = 5,000. These separate regional subsamples are shown for Europe (triangles), Asia (sqaures), and the Middle East (circles). Solid line shows MLE esitmate of the shape parameter for the pooled samples.

Our final set of evidence relates more directly to the causal mechanism described above. Recall that we hypothesized that the power-law distribution of war sizes results from escalatory feedback mechanisms in state efforts to mobilize military forces. If we are correct that military mobilization represents the basic substrate of the interstate system's dynamic instability, then data on military mobilization should show distributional signatures of critical state behavior, and such signatures should be most apparent when large numbers of states are forced to mobilize against each other simultaneously, as occurred during the two world wars.
To examine this possibility, we use data from the Correlates of War project, which measures the number of military personnel maintained by each state in the system, for every year since 1816. Ideally, we would like to show how the sequence of military mobilization events in one state influenced the sequence of military mobilization events amongst its neighbors. Unfortunately, the lack of subyearly data make such a direct test of the mechanism difficult, as it is impossible to ascertain the precise order in which different levels of military mobilization were achieved amongst different states in the midst of a war. However, several patterns observed at the macro level are highly suggestive of critical state behavior in the dynamics of military mobilization.
The top panel of Figure 4 shows the size of the global population of military personnel (per capita) over time, while the bottom panel shows the distribution of military personnel (per capita) by state for selected years. In the top panel, one can clearly see that global rates of military mobilization are highly unstable, and are characterized by rapidly accelerating growth during both world wars, as would be expected in a system drawn to the emergence of finite-time singularities. In the bottom panel, we show that at the peak of both of these accelerated growth processes (1917 and 1945) the global distribution of military mobilization transitioned away from a nonpower-law regime and into a power-law regime. While the nonpower-law (that is, subcritical) regime appears to be common to all years of peace (1910 and 1938 are shown as examples), the power-law (that is, critical) regime emerges only at the peaks of the mobilization process. It therefore seems that global rates of military mobilization are characterized by a pattern of punctuated criticality, a form of systemic instability in which rapid acceleration into critical state behavior at the global level is made possible through nonequilibrium processes linking the war fighting efforts of individual states. This pattern thus provides further evidence that the dynamics of interstate warfare are driven by strong escalatory feedback loops in the mobilization of mass combat forces.
Global levels of military mobilization
Note: Figure shows global levels of military mobilization (that is, military personnel per capita) over time. Top panel shows global totals by year. Bottom pnel shows complementary cumulative distribution functions, with ech observation representing the level of military mobilization in a given state, for the years 1910 (crosses), 1917 (squares), 1938 (plusses), and 1945 (circles).

Conclusion
By adopting a macro-level perspective on interstate warfare, while utilizing quantitative tools drawn from EVT and the science of complex systems, we show that there is more than one path available for rigorous empirical inquiry in the social sciences. Of course, the approach adopted here is no panacea. It is surely the case that in focusing our attention on aggregate distributional forms we have elided a number of contextual factors that have played a prominent role in regression-style analyses of interstate conflict. Thus, while we accuse the field of missing the forest, we may just as easily be accused of missing the trees.
However, the macro-level perspective advanced here also has its advantages. Viewed from this range, many things become clear that would otherwise have remained obscure. Indeed, while context is always important, there are some contexts that can only be observed at macro scales. One such context was the emergence of nationalist systems change in the late eighteenth century, which profoundly altered the production of corporate identities and the conduct of warfare in the interstate system. Building directly on Clausewitz, we have argued that this revolutionary innovation in the technology of statecraft entailed a transformation of the principles of political legitimacy, the methods of resource extraction, and the modes of military organization, through which contemporary states came to be constituted.
On the basis of this perspective, we have demonstrated that the interstate system experienced a fundamental shift in the mechanisms underlying the production of war sizes—a shift that can be dated to the years 1780–90, and that resulted in a systematic increase in war severity. We have also ruled out a number of alternative explanations for this shift (including changes in population sizes and changes in technology), while providing evidence for a specific account of war severity rooted in the mobilizational capacities of states. More broadly, our analysis points to the intriguing possibility that commonalities exist in the mechanisms by which war sizes are produced that transcend the particularities of time and place that have occupied the attention of nearly all quantitative studies of interstate conflict to date.
Appendix
TP-Statistic
The TP-statistic is a specific statistic having zero mean and a prescribed standard deviation under the hypothesis that a power law holds, regardless of the value of the shape parameter α. This statistic thus provides a non-parametric means of quantifying the statistical significance of deviations from power-law behavior.Footnote 84 The TP-statistic is given by:

where x k is the value of the kth observation, x 0 is the minimum threshold, and n is the number of observations greater than or equal to x 0.
By plotting the value of the TP-statistic as a function of x 0 (see Figure A1) we can easily visualize the range of data values over which power-law behavior holds. The black line shows the TP-statistic, while the two grey lines show 95 percent confidence intervals. TP-statistics, which remain within these bands, represent strong evidence of power-law distributions. The plot shows that power-law behavior is robustly inferred for the distribution of major power war sizes for all observations with greater than 10,000 battle deaths, and that any deviations from this pattern are statistically insignificant.
TP-statistic: Major power war severity, 1495–1997

Tail Index
The Tail Index, also known as the Hill estimator,Footnote 85 is given by:

where x 0 is the minimum threshold of the power-law tail and n is the number of observations greater than or equal to x 0. Note that for the purposes of parameter estimation, the value of x 0 is derived from the TP-statistic procedure described above, meaning that we estimate the tail index for all observations with greater than 10,000 battle deaths.
Kolmogorov-Smirnov Distance
If F n(x) is a cumulative distribution function with n observations and G m(x) is a cumulative distribution function with m observations, the Kolmogorov-Smirnov distance D nm between the two empirical samples is given by:

Model
To formalize our proposed positive feedback mechanism, let us postulate that the evolution in time of the numbers S 1(t) and S 2(t) of mobilized soldiers in States 1 and 2 obey the following equations:


where N 1 and N 2 are the total populations of the two countries, and g and h are constants intended to capture any differences between the two countries that can be treated as fixed on the timescale of the mobilization process. The exponent b expresses the entrainment effect of existing mobilization within a given country on future mobilization within that country. Similarly, the exponent c represents the feedback effect of existing mobilization in the opposing country on future mobilization within the home country.
The solution of (6) and (7) is obtained by noticing that:

Therefore, by integration, we obtain S 1(t) = kS 2 (t), where k is a constant. Substituting into equation (7), this leads to:

where K is a constant expressed in terms of N 1, N 2, b, c, g, and h. We have thus now arrived at an expression of the form of equation (2) in the text, derived from quite general suppositions about the feedback effects that are likely to be present in actual mobilizational processes (note that the equation for S 2 has the same structure).
If we assume that the two feedback effects (within-country and between-country) are sufficiently strong, such that b + c > 1, then the solution of (9) reads

where β = 1/(b + c − 1), S 1(0) is the value of S 1 at time t = 0, and t c is a critical time determined by the initial conditions:

The solution equation (10) exhibits a finite-time singularity as t approaches t c from below. Due to the coupling of the positive feedback effects, the solution for S 2(t) is of the same form, with the same critical time t c. We note further that the condition, b + c > 1, is quite weak, as it is compatible with even marginal decreasing growth rate for each term taken independently.
In order to understand how equation (10) is related to the power-law distribution of battle deaths, let us assume that the conflict can be triggered at any time during the mobilization process and that the number of casualties is simply proportional to the number of mobilized soldiers. Then, the distribution of casualties is the same as the probability density distribution, PDF(S), of total soldiers S(t) = (S 1 + S 2) at the time when the conflict is triggered. Because both S 1(t) and S 2(t) follow the same functional time dependence (10), the sum S(t) is also of this form. The PDF can then be obtained from the following equation:

where PDF(t) is the probability density function of the times at which conflict is triggered. Assuming a uniform time distribution, PDF(t) is a constant. Hence, using equation (12), we obtain:

where

Equation (14) thus provides a direct link between the mobilizational positive feedback effects we postulated above and the observed distribution of war severities. Our finding that α changed from 0.65 before 1789 to 0.35 thereafter implies that (b + c) shrank much closer to 1 around the time of the French Revolution, which in turn implies a dramatic strengthening of the positive feedback effects linking mobilizational processes between states.
We note further that these conclusions are robust to changes in many of the details of the model. For instance, suppose that conflict is not triggered uniformly in time, but becomes increasingly probable as the level of mobilization increases, that is, when time t approaches the critical time t c. Rather than assuming PDF(t) to be a constant, we could instead assume:

where γ captures the degree to which mobilizational processes influence the timing of conflict. Then, expression (12) leads to the same form of (13) with only a change in the formula for α from (14) to: