The links between family climate, peer characteristics, and drug use have been the focus of much research over the past several decades. Parenting, especially parental knowledge about their children's friends and whereabouts (i.e., monitoring), is the family measure most thoroughly examined as a predictor of adolescent initiation and continued use of drugs and related behaviors. The handful of studies that have considered other aspects of the family like marital conflict and hostility in sibling relationships have also found evidence for links with problematic adolescent outcomes including drug use. Outside of the family, peer characteristics (i.e., delinquency) have well-established links with adolescent behavior problems and drug use. However, there have been fewer studies that have considered how these different interpersonal relationships may work together in influencing drug use, and there have not been satisfactory studies of whether these influences reflect exogenous pressures acting on the child or whether characteristics of the child initiate and shape some or all of these apparent environmental risks.
To help clarify how these influences are balanced, and the relative role of the child and exogenous social influences, it is fortunate that there is a rapidly growing literature on the role of genetic factors on interpersonal relationships and on the covariation of interpersonal relationships and the adjustment of family members. When children's genes influence the objective features of their social environment or their own experience of it, genotype–environment correlation is indicated. The links between interpersonal relationships and adolescent drug use may be due at least partly to genetic influences of the adolescent on his or her family and peers as well as on his or her likelihood of using drugs. The current report will examine genetic and environmental influences on the covariation among marital conflict, parental knowledge, sibling conflict, and deviant peer group characteristics during adolescence and initiation of drug use by young adulthood. The interpersonal relationships are considered in order of proximal relevance to the adolescent's likelihood of initiation of drug use by young adulthood, with the most distal to the child accounted for first (marital conflict) and the most proximal to the child considered last (peer group characteristics). In order to better understand the role of the adolescent, via genes, a sample of twins and siblings varying in degree of genetic relatedness was used. Thus, in this report we will be able to identify genotype–environment correlations among interpersonal relationships on the initiation of drug use.
Family Relationships and Drug Initiation
There is evidence from developmental and family process literature that marital conflict is linked with adolescent adjustment problems. Conflict between parents, especially conflict that children experience directly, is associated with increased internalizing, externalizing, and a host of other undesirable outcomes in adolescents (e.g., Amato, Reference Amato1991; Cummings, Reference Cummings1994; Cummings & Davies, Reference Cummings and Davies2002; El-Sheikh & Elmore-Staton, Reference El-Sheikh and Elmore-Staton2004; Harold & Conger, Reference Harold and Conger1997; Rhoades et al., Reference Rhoades, Leve, Harold, Neiderhiser, Shaw and Reiss2011). There are, however, few studies that have examined the impact of marital conflict on drug use in adolescents, with most studies focusing on more general adjustment problems like externalizing. There is evidence that impulse control, aggression, and other externalizing behaviors predict initiation of drug use in adolescents (e.g., Ernst et al., Reference Ernst, Luckenbaugh, Moolchan, Leff, Allen and Eshel2006); thus, the associations between marital conflict and externalizing behaviors also suggest an increased risk of initiation of drug use.
A number of possible mechanisms through which marital conflict may be associated with child functioning have been identified. There may be a direct effect of marital conflict on the child, as described above. It is also likely that marital conflict disrupts or impairs parenting, thus indirectly influencing child adjustment through parental behaviors by, for example, decreasing effective monitoring (e.g., Cummings, Reference Cummings1994; Gable, Belsky, & Crnic, Reference Gable, Belsky and Crnic1992; Peterson & Zill, Reference Peterson and Zill1986). A few studies have attempted to systematically examine the ordering of effects among marital conflict, parenting, and child adjustment. One such found that the effects of marital hostility on adolescent externalizing behaviors were mediated by multiple types of parenting behaviors, including monitoring, with some differences for mothers and fathers (Buehler, Benson, & Gerard, Reference Buehler, Benson and Gerard2006). Overall, it is clear that marital conflict is associated with child adjustment and that parenting behaviors, including monitoring, at least partially mediate this effect on children. Because adolescent drug initiation is an adjustment problem highly comorbid with externalizing problems (e.g., Disney, Elkins, McGue, & Iacono, Reference Disney, Elkins, McGue and Iacono1999; Helstrom, Bryan, Hutchison, Riggs, & Blechman, Reference Helstrom, Bryan, Hutchison, Riggs and Blechman2004; Molina & Pelham, Reference Molina and Pelham2003), it is likely that marital conflict impacts drug initiation via similar mechanisms, operating in part through parenting behaviors.
There are a plethora of studies that have found that more effective parental monitoring is related to a reduced likelihood to initiate drug use and related behaviors during adolescence (Dishion & Tipsord, Reference Dishion and Tipsord2011; Lac & Crano, Reference Lac and Crano2009). Studies examining initiation and continued drug use have found parental monitoring to be one of the most predictive factors in adolescent drug use (e.g., Chilcoat & Anthony, Reference Chilcoat and Anthony1996; Dishion, Capaldi, Spracklen, & Li, Reference Dishion, Capaldi, Spracklen and Li1995). In general, these studies have found that when parents know who their children are with, where they are, and when they will return (parental monitoring and/or knowledge), children show fewer externalizing behaviors, associate with fewer delinquent peers, and are less likely to initiate use of drugs. This pattern of findings has been shown for initiation of commonly used substances like tobacco, alcohol, and marijuana (Crano, Siegel, Alvaro, Lac, & Hemovich, Reference Crano, Siegel, Alvaro, Lac and Hemovich2008; Dishion et al., Reference Dishion, Capaldi, Spracklen and Li1995; Dishion & Loeber, Reference Dishion and Loeber1985; Dorius, Bahr, Hoffmann, & Harmon, Reference Dorius, Bahr, Hoffmann and Harmon2004; Duncan, Duncan, Biglan, & Ary, Reference Duncan, Duncan, Biglan and Ary1998; Lac & Crano, Reference Lac and Crano2009; Piko & Kovacs, Reference Piko and Kovacs2010) as well as for use of other less commonly used drugs, like ecstasy (Martins, Storr, Alexandre, & Chilcoat, Reference Martins, Storr, Alexandre and Chilcoat2008; Wu, Liu, & Fan, Reference Wu, Liu and Fan2010) and inhalants (Nonnemaker, Crankshaw, Shive, Hussin, & Farrelly, Reference Nonnemaker, Crankshaw, Shive, Hussin and Farrelly2011). Although other parenting behaviors (i.e., hostility, warmth, involvement, and coercive discipline) have also been shown to predict adolescent substance use (e.g., Cheng & Lo, Reference Cheng and Lo2010; Fletcher, Steinberg, & Williams-Wheeler, Reference Fletcher, Steinberg and Williams-Wheeler2004; Siebenbruner, Englund, Egeland, & Hudson, Reference Siebenbruner, Englund, Egeland and Hudson2006), generally parental monitoring and knowledge continues to be a significant predictor above and beyond other parenting behaviors (see Chen, Storr, & Anthony, Reference Chen, Storr and Anthony2005 for an exception to this). Together, this evidence highlights the importance of parental monitoring in particular on the likelihood of children to initiate a number of different substances. More effective parental monitoring is associated with a decreased likelihood to initiate drugs.
What is not clear from the studies reported above is the direction of effects: do parents who effectively monitor their adolescent have more control, thus taking an active part in preventing drug initiation, or is effective monitoring an adolescent-driven construct with adolescents who are less likely to initiate drug use more likely to tell their parents about their whereabouts? This latter explanation is consistent with the notion that parental knowledge is due to adolescent disclosure and that it is adolescent disclosure that predicts the likelihood of delinquent behaviors, not parental monitoring or attempts at control (Kerr & Stattin, Reference Kerr and Stattin2000; Kerr, Stattin, & Burk, Reference Kerr, Stattin and Burk2010; Stattin & Kerr, Reference Stattin and Kerr2000). Findings from genetically informed designs indicate that there are genetic influences on parental monitoring (e.g., Neiderhiser et al., Reference Neiderhiser, Reiss, Pedersen, Lichtenstein, Spotts and Hansson2004; Neiderhiser, Reiss, Lichtenstein, Spotts, & Ganiban, Reference Neiderhiser, Reiss, Lichtenstein, Spotts and Ganiban2007), thus supporting an adolescent-driven mechanism of effect.
Siblings are another source of potential influence on adolescent initiation of drug use. There have been a number of studies that have examined deviancy training in sibling pairs with clear evidence that having a deviant sibling increases an adolescent's risk of deviant behavior, including initiation of substance use (e.g., Avenevoli & Merikangas, Reference Avenevoli and Merikangas2003; Compton, Snyder, Schrepferman, Bank, & Shortt, Reference Compton, Snyder, Schrepferman, Bank and Shortt2003; Natsuaki, Ge, Reiss, & Neiderhiser, Reference Natsuaki, Ge, Reiss and Neiderhiser2009; Rowe & Gulley, Reference Rowe and Gulley1992). The quality of the sibling relationship appears to be an important factor for the similarity of siblings for several problematic behaviors. For example, siblings with close relationships were more likely to have similar attitudes and experiences with sexual behavior in a large sample of adolescent siblings (McHale, Bissell, & Kim, Reference McHale, Bissell and Kim2009). At least one study has found no association between sibling relationship quality and substance use when sibling deviancy was accounted for (Stormshak, Comeau, & Shepard, Reference Stormshak, Comeau and Shepard2004), suggesting that deviancy training is a likely mechanism for associations between sibling deviancy and initiation of drug use in adolescents. In a different study not directly assessing drug use, hostile sibling relationships predicted delinquency in boys and girls, while warm sibling relationships predicted delinquency in boys only (Slomkowski, Rende, Conger, Simons, & Conger, Reference Slomkowski, Rende, Conger, Simons and Conger2001). These studies clearly indicate that siblings can exert influence on the likelihood of adolescents to initiate drug use.
Peers have been implicated in the development of drug use for several decades (e.g., Kandel, Reference Kandel1973). There are many studies that have found that the risk of drug use increases with the number of peers who use (Brook, Kessler, & Cohen, Reference Brook, Kessler and Cohen1999; Ennett et al., Reference Ennett, Bauman, Hussong, Faris, Foshee and Cai2006) and that the perceptions of peer use is a strong predictor of adolescent use (Agrawal & Lynskey, Reference Agrawal and Lynskey2007). Peers have also been implicated in deviancy training such that friendships with deviant peers increase delinquency, substance use, violence, and adult maladjustment (Dishion, McCord, & Poulin, Reference Dishion, McCord and Poulin1999; Dishion & Owen, Reference Dishion and Owen2002). There has been some debate about the direction of effects of these associations. Is it that deviant peers train friends in deviance or do individuals at risk of drug use select deviant peers? Studies that have attempted to disentangle the direction of effects have found that this is most likely a bidirectional relationship. For example, longitudinal studies suggest that both peer drug use and participant drug use are highly stable over time, with somewhat more evidence that peers influence use of substances over time (Sieving, Perry, & Williams, Reference Sieving, Perry and Williams2000). A study using a short-term longitudinal design found that adolescents who were already using substances tended to select friends who also used and that these friends contributed to changes in adolescent substance use over time (Poulin, Kiesner, Pedersen, & Dishion, Reference Poulin, Kiesner, Pedersen and Dishion2011). An earlier study found that both selection and socialization occurs in friendships and marijuana use over time (Kandel, Reference Kandel1978). Thus, although peers are clearly implicated in the initiation of drug use, this association appears to be bidirectional in nature and fairly stable over time.
Integrating Across Marital Conflict, Parental Monitoring, Sibling Relationships, and Peers
Although marital conflict, parental monitoring, sibling relationships, and peer characteristics have all been shown to have a direct association with initiation of drug use and related behaviors, as reviewed above, it is unlikely that any of these constructs are operating to influence the adolescent in isolation from the others. As noted above, the effect of marital hostility on adolescent externalizing problems is mediated in part by parenting behaviors, including less effective monitoring (e.g., Buehler et al., Reference Buehler, Benson and Gerard2006; Cummings, Reference Cummings1994; Gable et al., Reference Gable, Belsky and Crnic1992; Peterson & Zill, Reference Peterson and Zill1986). However, no studies were identified linking marital quality and parenting to substance use. Studies that have attempted to clarify how parenting and peers may operate together to influence adolescent delinquency and drug use have found some evidence that parents have an important influence on the types of friends with whom their adolescent(s) associate. For example, ineffective parental monitoring predicted involvement with a deviant peer network that in turn was associated with a rise in substance use in the transition to high school (Dishion et al., Reference Dishion, Capaldi, Spracklen and Li1995). There is also some evidence that associating with deviant peers may mediate the effect of parenting on substance use (Kiesner, Poulin, & Dishion, Reference Kiesner, Poulin and Dishion2010; Kung & Farrell, Reference Kung and Farrell2000), although at least one study found important differences for the association between drug use with friends and drug use alone, with parental monitoring moderating both associations (Kiesner et al., Reference Kiesner, Poulin and Dishion2010). In other words, the impact of parenting behaviors, including monitoring, influences adolescent drug use indirectly via peer characteristics. However, the likelihood that an adolescent who uses drugs with his friends will also use when alone is decreased when parental monitoring is effective. Other studies of the links between parenting and peer characteristics have found that parental monitoring is related to peer group characteristics indirectly via adolescent drug use and self-reliance (Brown, Mounts, Lamborn, & Steinberg, Reference Brown, Mounts, Lamborn and Steinberg1993) and that poor parenting practices, including ineffective monitoring, increase the influence of deviant peers on adolescent drug use (Duncan et al., Reference Duncan, Duncan, Biglan and Ary1998; Kung & Farrell, Reference Kung and Farrell2000).
Fewer studies have examined associations among sibling relationships and peer characteristics. Peer and sibling substance use are better predictors of adolescent substance use than parental alcohol use, and sibling substance use also predicts peer substance use (Windle, Reference Windle2000). In other words, the transmission of substance use within a family appears to be lateral (via sibling influences) rather than vertical (via parental influences), and sibling factors predict and probably precede peer factors. In another study both sibling and peer deviance directly predicted adolescent substance use, although when both were included as predictors of change in substance use over time, only sibling deviance remained significant (Stormshak et al., Reference Stormshak, Comeau and Shepard2004). The findings from this latter study suggest that sibling factors may be more important in predicting adolescent drug use. Both of these studies suggest that siblings play an important role in influencing adolescent drug use, preceding the influence of drug using peers and possibly overriding the influence of peers.
We found no studies that considered marital conflict, parental monitoring, sibling relationships, and peer characteristics influences on initiation of drug use or related behaviors. The studies that have considered more than one of these constructs in the same model have found evidence for richer patterns of association than indicated by examining any one of these constructs alone. Both parental behavior and sibling relationships have been linked to peer group characteristics, and mediation and moderation of associations between interpersonal relationships and adolescent substance use is indicated in some studies. There is a clear need to consider how these different relationships may work together to influence the initiation of drug use in order to better understand the processes that may be involved. The findings reviewed above suggest that the effects of family factors appear to have a more profound effect when they are more proximal to the adolescent, supporting an approach that progresses from more distal to more proximal in regard to order of effect on adolescent initiation of drug use. Specifically, we propose an ordering from marital conflict about the child, parental monitoring, sibling relationship, peer characteristics, to initiation of drug use.
Genetic and Environmental Influences on Interpersonal Relationships and Drug Use
Strong causal inferences about the role of social factors in drug use and abuse cannot be drawn from studies that do not use genetically informed designs for three reasons. First, there is ample evidence that substance use itself is influenced by genetic factors; drug abuse shows very high heritability estimates, typically accounting for more than half of the total variance (e.g., Kendler, Meyers, & Prescott, Reference Kendler, Myers and Prescott2007). These same genetic factors may influence adolescent relationships with parents and peers, but this second effect of genetic factors might simply be a noncausal epiphenomenon. Second, adolescent relationships may mediate genetic influences on substance use. Genetic factors related to substance use may first influence relationships and, as a consequence of that influence, go on to influence substance use. Third, interpersonal relationships may have their own main effects on substance use independent of genetic influences either on the relationships or on substance use. These possibilities are essential in constructing any causal model of substance use. They are based on a well-established literature substantiating the role of genetic influences of the adolescent on measures of family relationships like parenting and sibling relationships (Bussell et al., Reference Bussell, Neiderhiser, Pike, Plomin, Simmens and Howe1999; Elkins, Iacono, & Doyle, Reference Elkins, Iacono and Doyle1997; Feinberg, Reiss, Neiderhiser, & Hetherington, Reference Feinberg, Reiss, Neiderhiser and Hetherington2005; Rasbash, Jenkins, O'Connor, Tackett, & Reiss, Reference Rasbash, Jenkins, O'Connor, Tackett and Reiss2011) and even for marital conflict about each child (Reiss, Neiderhiser, Hetherington, & Plomin, Reference Reiss, Neiderhiser, Hetherington and Plomin2000). Genetic influences have also been found for peer relationships and peer group characteristics (Beaver et al., Reference Beaver, Shutt, Boutwell, Ratchford, Roberts and Barnes2009; Bullock, Deater-Deckard, & Leve, Reference Bullock, Deater-Deckard and Leve2006; Cleveland, Wiebe, & Rowe, Reference Cleveland, Wiebe and Rowe2005; Iervolino et al., Reference Iervolino, Pike, Manke, Reiss, Hetherington and Plomin2002; Kendler, Jacobson, et al., Reference Kendler, Jacobson, Gardner, Gillespie, Aggen and Prescott2007; Pike & Atzaba-Poria, Reference Pike and Atzaba-Poria2003). In general, these studies have found that parenting is influenced by genetic, shared environmental, and nonshared environmental influences; peer relationships primarily by genetic and nonshared environmental influences; and sibling relationships primarily by genetic and shared environmental influences (Kendler & Baker, Reference Kendler and Baker2007; Ulbricht & Neiderhiser, Reference Ulbricht and Neiderhiser2010). In other words, parenting may reflect evoked responses of parents to genetically influenced characteristics of the child, while peer characteristics may be the result of adolescents' selecting peers or by being selected on the basis of the adolescent's genetically influenced characteristics. In both cases, genotype–environment correlation is indicated, although the type of genotype–environment correlation is unclear. At least one study has reported that genetic influences explain the covariation between parental discipline and quality of peer relationships during adolescence (Pike & Eley, Reference Pike and Eley2009), a finding consistent with the univariate findings reported above. Marital conflict about the child, a marital variable that is distinct for each twin and/or sibling, shows substantial and significant genetic influence, with the remaining variance due to primarily nonshared environmental influences (Reiss et al., Reference Reiss, Neiderhiser, Hetherington and Plomin2000). This can also be interpreted as evocative effects of the child on his or her parents' marital conflict because the similarity in levels of conflict about each sibling increases with the genetic relatedness of the children. In sum, there is ample evidence of genetic influence on measures of interpersonal relationships with systematic variation based on which relationship is examined.
Genetic and environmental influences on substance use
Substance abuse disorders are highly heritable, with genetic influences typically explaining more than half of the total variance (e.g., Kendler, Myers, et al., Reference Kendler, Myers and Prescott2007; Lynskey, Agrawal, & Heath, Reference Lynskey, Agrawal and Heath2010; Rhee et al., Reference Rhee, Hewitt, Young, Corley, Crowley and Stallings2003). Different patterns of genetic and environmental influences have been found, however, based on the developmental progression of substance use. In other words, initiation of use is largely due to shared environmental and some genetic influences, while continued use and dependence is primarily due to genetic influences (Agrawal & Lynskey, Reference Agrawal and Lynskey2008; Derringer, Krueger, McGue, & Iacono, Reference Derringer, Krueger, McGue and Iacono2008; Hopfer, Crowley, & Hewitt, Reference Hopfer, Crowley and Hewitt2003; Kendler, Schmitt, Aggen, & Prescott, Reference Kendler, Schmitt, Aggen and Prescott2008). The shared environmental influences on initiation of drug use are typically described as having to do with availability of substances and sibling effects rather than common rearing environment factors. These findings suggest that although individuals are more likely to progress from experimentation to problem use for reasons to do with their genes, the opportunity to experiment is largely attributable to the environment that they share with their siblings. Thus, minimizing the opportunities to initiate drug use may be a very effective intervention strategy even in individuals who may be at greater genetic “risk” of becoming dependent.
There are also fairly clear findings from genetically informed studies that the bulk of genetic influence on substance use is not specific to a particular substance. A review of twin and adoption studies examining genetic and environmental influences on adolescent substance use found evidence for common genetic influence across substances (Hopfer et al., Reference Hopfer, Crowley and Hewitt2003). More recent reports support this conclusion. For example, common genetic influences have been found across multiple classes of illicit drugs in male twins (Kendler, Jacobson, Prescott, & Neale, Reference Kendler, Jacobson, Prescott and Neale2003), although a subsequent analysis of male and female twins found that illicit and legal drug dependence loaded on different genetic factors, indicating that there are distinct genetic influences for the two categories of drug dependence (Kendler, Myers, et al., Reference Kendler, Myers and Prescott2007). In both studies, although there are genetic influences specific to each drug, the bulk of genetic variance was shared across the drugs. These data suggest that a single index of drug use in early adulthood, one that combines all substances of abuse, adequately reflects the cumulative genetic and environmental influences on substance use in adulthood. We use this strategy in the current study.
Genetic and environmental influences on associations among interpersonal relationships and outcomes
A powerful way to understand how interpersonal relationships may impact outcomes, including initiation of drug use, is to examine genetic and environmental influences on the associations among relationships and outcomes. By examining genetic and environmental influences on these associations, we can understand whether evocative adolescent effects contribute to both interpersonal relationships and drug initiation, or whether interpersonal relationships are potential environmental mechanisms (or operate via passive genotype–environment correlation) predicting adolescent drug initiation. Few studies have investigated the role of adolescents' genes and environments on associations between marital conflict and adolescent adjustment problems. There is some evidence that the association between marital conflict about the child and adolescent antisocial behavior is explained in near equal parts by genetic and shared environmental influences (Reiss et al., Reference Reiss, Neiderhiser, Hetherington and Plomin2000). A children of twins approach found that marital instability was linked to young adult alcohol, drug, and behavioral problems for environmental reasons rather than through passive genotype–environment correlation (D'Onofrio et al., Reference D'Onofrio, Turkheimer, Emery, Slutske, Heath and Madden2005). Another study using the children of twins design found that genetic influences mediated the association between marital conflict frequency and conduct problems in offspring (Harden et al., Reference Harden, Turkheimer, Emery, D'Onofrio, Slutske and Heath2007). Together, these few studies suggest both genetic and environmental mediation of associations between marital relationships and offspring adjustment, indicating that marital conflict likely impacts offspring adjustment via both evocative and passive genotype–environment correlation processes.
Many studies have examined genetic and environmental influences underlying the association between parenting and adolescent outcomes. Most of the covariation between parenting and externalizing behaviors can be explained by genetic influences (e.g., Evrony, Ulbricht, & Neiderhiser, Reference Evrony, Ulbricht, Neiderhiser and Tercyak2010; Ulbricht & Neiderhiser, Reference Ulbricht and Neiderhiser2010). In other words, the genetic influences of the child on parenting behaviors also account for variation in externalizing behaviors. One of the first studies to take this approach examined parental negativity and adolescent antisocial behavior using a sample of adolescent twins and siblings and their parents (Pike, McGuire, Hetherington, Reiss, & Plomin, Reference Pike, McGuire, Hetherington, Reiss and Plomin1996). Although the focus of that report was on finding nonshared environmental influences that contributed to covariation between family relationships and adolescent adjustment, genetic influences explained over half of the covariation between parental negativity and adolescent antisocial behavior. Many studies have found a similar pattern of findings using different samples, with most concluding that genetic factors are significant influences on the covariation between parenting and adolescent antisocial and related behaviors (Burt, Krueger, McGue, & Iacono, Reference Burt, Krueger, McGue and Iacono2003; Button, Lau, Maughan, & Eley, Reference Button, Lau, Maughan and Eley2008; Narusyte, Andershed, Neiderhiser, & Lichtenstein, Reference Narusyte, Andershed, Neiderhiser and Lichtenstein2007). These findings, similar to those of genetic influences on parenting alone, indicate that genotype–environment correlation is likely to be operating, although it provides little information on whether these effects are evocative or passive (because parents and children share genes and environments).
A number of studies have used different designs or taken a longitudinal approach to examining associations between parenting and adolescent externalizing behaviors to better understand how and why these constructs are related. For example, two adoption studies found that birth parent psychopathology is linked to adoptive parents' harsh parenting via the adopted child's behavior, indicating evocative genotype–environment correlation (Ge et al., Reference Ge, Conger, Cadoret, Neiderhiser, Yates and Troughton1996; Riggins-Caspers, Cadoret, Knutson, & Langbehn, Reference Riggins-Caspers, Cadoret, Knutson and Langbehn2003), and a different adoption study found a direct association between birth parent antisocial behavior and negative parenting (O'Connor, Deater-Deckard, Fulker, Rutter, & Plomin, Reference O'Connor, Deater-Deckard, Fulker, Rutter and Plomin1998). A sibling adoption design examined parenting behaviors and later delinquent behaviors in adolescents and found that the associations were best explained by shared environmental and genetic influences (Burt, McGue, Krueger, & Iacono, Reference Burt, McGue, Krueger and Iacono2007). Finally, there have been at least two longitudinal studies of parenting and adolescent outcomes. In both, parenting was associated with change in adolescent antisocial behavior, and a substantial portion of this association was due to genetic influences (Burt, McGue, Krueger, & Iacono, Reference Burt, McGue, Krueger and Iacono2005; Neiderhiser, Reiss, Hetherington, & Plomin, Reference Neiderhiser, Reiss, Hetherington and Plomin1999). In sum, a variety of studies using different samples, designs, and measures find evidence for genetic influences on the covariation of parenting and externalizing and related outcomes in offspring.
A handful of studies have examined genetic and environmental influences on links between other sibling and peer characteristics and relationships, and substance use and related outcomes. A series of studies using a large representative sample of twins and siblings found that sibling relationship was linked with smoking and drinking and that these associations are shared environmental, not genetic, in nature (Rende, Slomkowski, Lloyd-Richardson, & Niaura, Reference Rende, Slomkowski, Lloyd-Richardson and Niaura2005; Slomkowski, Rende, Novak, Lloyd-Richardson, & Niaura, Reference Slomkowski, Rende, Novak, Lloyd-Richardson and Niaura2005). In addition, sibling negativity was linked with adolescent externalizing behaviors for mostly shared environmental reasons (Reiss et al., Reference Reiss, Neiderhiser, Hetherington and Plomin2000). Shared environmental influences on family functioning and adolescent substance use were also found in a large sibling adoption study, with the shared environmental influences due to sibling effects, not parent effects (McGue, Sharma, & Benson, Reference McGue, Sharma and Benson1996). A report from the same group using a sample of 14-year-old twins found that only shared environmental influences explained the covariation among peer deviance, parent–child relationship problems, and early substance use (Walden, McGue, Iacono, Burt, & Elkins, Reference Walden, McGue, Iacono, Burt and Elkins2004). A study of a large sample of adult twin men who rated their peer characteristics and conduct problems during adolescence retrospectively via the Life History Calendar method found that genetic influences on conduct problems were linked to later peer deviance and did not change over time, while shared environmental influences explained the covariance between peer deviance and conduct problems and decreased over time (Kendler, Jacobson, Myers, & Eaves, Reference Kendler, Jacobson, Myers and Eaves2008). A subsequent report using the same sample found that genetic and environmental influences on cannabis use were correlated with peer deviance and that the direction of effects was from cannabis use to peer deviance, not vice versa (Gillespie, Neale, Jacobson, & Kendler, Reference Gillespie, Neale, Jacobson and Kendler2009). A similar pattern of findings was found for adolescent peer delinquency and smoking during young adulthood in a longitudinal sample of twins and siblings, with the association explained by only genetic and nonshared environmental influences (Harakeh et al., Reference Harakeh, Neiderhiser, Spotts, Engels, Scholte and Reiss2008), and between peer and adolescent delinquency in a different sample of twins and siblings (Beaver, DeLisi, Wright, & Vaughn, Reference Beaver, DeLisi, Wright and Vaughn2009). In sum, sibling relationships have been found to be linked to externalizing and related behaviors because of shared environmental influences, which is most likely a sibling deviancy training process, whereas findings from studies examining peer delinquency and adolescent and young adult delinquency and substance use consistently show that genetic influences were important in explaining the association, suggesting an important role for genotype–environment correlation in these associations.
Therefore, although deviancy training is a proposed mechanism for the influence of both sibling and peer relationships on adolescent drug use, findings from behavioral genetics studies suggest that the evocative effects of the drug-using adolescent are particularly important in the deviancy training of his/her own peers, while shared environmental influences contribute to similarities between siblings. It is important to note here, however, that the shared environmental influences from siblings are conceptualized differently than those from parents (although there are no differences in the modeling). As noted earlier, shared environmental influences due to siblings are likely the result of reciprocal processes, while shared environmental influence due to rearing environment from parents are more commonly considered the result of the rearing environment acting on the child (Rowe & Rogers, Reference Rowe, Rogers and Adams1997).
Current report
The current report seeks to build on and extend the existing work examining genetic and environmental influences on interpersonal relationships and the initiation of illegal drug use by young adulthood. Although a number of studies have examined bivariate associations among these relationships and adolescent or young adult behaviors, some longitudinally, few have considered multiple relationships. The phenotypic literature has indicated that marital conflict and parental monitoring are important family factors that may increase the likelihood of drug initiation and sibling conflict and peer delinquency as possible avenues for contagion or deviancy training. We will consider all four interpersonal factors: marital conflict about each adolescent, parental monitoring, sibling negativity, and peer group delinquency during adolescence in relation to initiation of drug use by young adulthood, using a genetically informed design. Clarifying the patterns of genetic and environmental contributions to these associations will help to advance our understanding of how genotype–environment correlation and direct environmental influences may be operating within the context of these interpersonal relationships to influence the initiation of drug use.
Method
Sample
The current report is based on data from the longitudinal Nonshared Environment and Adolescent Development (NEAD) project (Neiderhiser, Reiss, & Hetherington, Reference Neiderhiser, Reiss and Hetherington2007; Reiss et al., Reference Reiss, Neiderhiser, Hetherington and Plomin2000). The NEAD project assessed 720 same-sex (48% female) twin and sibling pairs from families across the United States. The sample comprised two-parent families, including nondivorced and stepfamilies, with a pair of adolescent siblings no more than 4 years apart in age. NEAD comprises six sibling types in two family types: monozygotic (MZ, N = 93 pairs) twins, dizygotic (DZ, N = 99 pairs) twins, and full siblings in nondivorced families (FI, N = 95 pairs); and full siblings (FS, N = 182 pairs), half-siblings (HS, N = 109 pairs), and stepsiblings (US, N = 130 pairs) in stepfamilies (12 pairs could not be classified). The parents of children in stepfamilies were required to be married at least 5 years prior to data collection to ensure that none of the stepfamilies were in the unstable early phase of family formation. The nondivorced families with full siblings were recruited through random-digit dialing of 10,000 telephone numbers throughout the United States. Except for a small subsample of the other sibling types who were also recruited through random-digit dialing procedures, most of the other sibling types were recruited through a national market survey of 675,000 households.
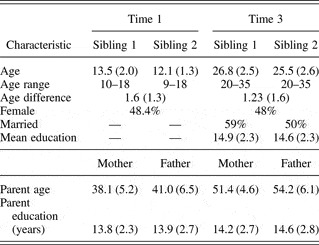
Three cross-sectional assessments occurred in NEAD, the first two during adolescence and the third during young adulthood. The Time 1 assessment included 720 families. Families with adolescents still living at home at least 50% of the time and who participated in Time 1 were eligible for the Time 2 assessment 2–3 years later (N = 408). All families who participated in the Time 1 assessment were eligible to participate in the Time 3 assessment as young adults. In order to maximize the analytic sample size, data from the Time 1 and Time 3 assessments were used in the current report. At Time 1 siblings were 10–18 years old (average age was 14.5 years for Sibling 1 and 12.9 for Sibling 2) and were on average 1.6 years apart (SD = 1.3 years). The median family income was $25,000–$35,000. The Time 3 assessment took place 7–13 years later. At Time 3 siblings were 20–35 years old (average age = 26.8 for Sibling 1 and 25.5 for Sibling 2) and were on average 1.23 years apart (SD = 1.6 years). The median family income for parents was higher than at the Time 1 assessment ($60,000–$69,000). At Time 3 the median income was $40,000–$49,000 for Sibling 1 and $30,000–$39,000 for Sibling 2. Of the original 720 families, 516 families could be recontacted, and some data were collected on 413 families. Families who did not participate in the Time 3 assessment were generally younger, F (340) = 1.44, p < .05, and had lower family income, F (361) = 1.27, p < .05, but did not differ from families who did participate in the Time 3 assessment on other demographic and study variable characteristics (e.g., gender of siblings, sibling antisocial behavior, peer college orientation, peer delinquency and substance use, parents' age or education, and family income). Demographic information for the Time 1 and Time 3 assessments (used in the present report) is presented in Table 1.
Sample demographic information

Note: The values are means (standard deviations).
Procedure
At Time 1 most families were visited twice by two interviewers. Both parents and the two adolescents completed questionnaires and were videotaped during the visit in dyadic, triadic, and tetradic family interactions. Additional questionnaire data were obtained from questionnaires that were mailed ahead to be completed prior to the visit. Family members specified areas of disagreement that were then discussed and videotaped in the 10-min interactions. A global coding system on a 5-point Likert scale was used to rate the videotaped interactions (Hetherington & Clingempeel, Reference Hetherington and Clingempeel1992). In the present study we focused on the dyadic interactions between the siblings.
Twins were rated for physical similarity (e.g., eye and hair color) by the interviewer, the parents, and self-report using a questionnaire designed for adolescents (Nichols & Bilbro, Reference Nichols and Bilbro1966). If any differences in physical characteristics were reported or if respondents reported that people never were confused about the identity of the twins, the twin pair was classified as DZ. Twelve of the twin pairs could not be classified as MZ or DZ and were excluded from these analyses (<2% of the twin pairs). The accuracy of this method for assigning zygosity has been shown to be more than 95% accurate when compared with DNA tests (Nichols & Bilbro, Reference Nichols and Bilbro1966; Spitz, Moutier, Reed, Busnel, & Marchaland, Reference Spitz, Moutier, Reed, Busnel and Marchaland1996). Our analysis sample reflects the 708 families for which we have zygosity data. Missing data were accommodated using full information maximum likelihood during analysis.
Measures
Measurement included parent and adolescent reports and videotaped dyadic interactions.
Marital conflict about the child
At Time 1 marital conflict about the child was assessed using an average of mother and father reports of conflict with spouse about each sibling on the Child Rearing Issues-Self and Spouse scale (Hetherington & Clingempeel, Reference Hetherington and Clingempeel1992). Mothers and fathers reported on how often, on a scale of 0 (never) to 7 (more than once a day), they had arguments about Sibling 1 and Sibling 2 (separately) in the past month (e.g., children's behaviors toward self and siblings, children's grades, chores, or allowances). Mother and father reports were moderately correlated (Sibling 1: r = .31, p < .05; Sibling 2: r = .25, p < .05).
Parental monitoring
At Time 1 parental monitoring was computed as the sum of mother and father reports of their knowledge about the adolescent's friends and whereabouts (Hetherington & Clingempeel, Reference Hetherington and Clingempeel1992; αs > 0.90). Mothers and fathers were asked 13 items about how much they know about Sibling 1's and Sibling 2's lives in several areas (e.g., choice of friends, who they are, and what they are like; and child's school life, such as teachers, homework, and grades) on a scale of 1 (never) to 5 (always). Mother and father reports were moderately correlated (Sibling 1: r = .46, p < .05; Sibling 2: r = .40, p < .05).
Sibling negativity
Time 1 sibling conflict was assessed using a composite of child, parent, and observer ratings (Furman & Buhrmester, Reference Furman and Buhrmester1985; Hetherington et al., Reference Hetherington, Henderson, O'Connor, Insabella, Taylor and Anderson1999; Schaefer & Edgerton, Reference Schaefer and Edgerton1981). Parents reported on the sibling rivalry, aggression, and avoidance subscales of the Sibling Inventory of Behavior (Hetherington & Clingempeel, Reference Hetherington and Clingempeel1992; αs > 0.85). Siblings reported on the amount of criticism they felt from their sibling using the criticism subscale of the Network of Relationship Inventory (Hetherington & Clingempeel, Reference Hetherington and Clingempeel1992; αs > 0.72), self-report on the sibling rivalry, aggression, and avoidance subscales of the Sibling Inventory of Behavior (Hetherington & Clingempeel, Reference Hetherington and Clingempeel1992; αs > 0.71), the total score for the sibling interaction task (a questionnaire where siblings rate the frequency of disagreement on a number of topics, higher scores indicating more frequent disagreements; Hetherington & Clingempeel, Reference Hetherington and Clingempeel1992; αs > 0.30), and the symbolic and physical aggression subscales of the Conflict Tactics Inventory (Straus, Reference Straus1979, Reference Straus, Freedman and Sherman1987; αs > 0.81). Observers rated anger, coercion, and transactional conflict during the dyadic sibling interactions (intraclass correlations [ICCs] > .62). Scores for parent, adolescent, and observer reports were standardized and summed to form composite sibling negativity scores (r = .24–.60, ps < .05; see Reiss et al., Reference Reiss, Neiderhiser, Hetherington and Plomin2000).
Peer group delinquency
Combined mother and father reports were used to index the adolescent's delinquent peer group (Iervolino et al., Reference Iervolino, Pike, Manke, Reiss, Hetherington and Plomin2002; Manke, McGuire, Reiss, Hetherington, & Plomin, Reference Manke, McGuire, Reiss, Hetherington and Plomin1995). Mothers and fathers reported on Sibling 1's and Sibling 2's peer group delinquency using 8 items assessing how like the child's friends are to adjectives (i.e., delinquent or rebellious) on a 1 (very much unlike) to 4 (very much like) scale. Scores were acceptably reliable (αs > 0.76). Mother and father reports were moderately correlated (Sibling 1: r = .38, p < .05, Sibling 2: r = .35, p < .05).
Initiation of illegal drugs by young adulthood
Substance use was assessed at Time 3 using a construct indicating the number of illicit drugs young adults had initiated (i.e., marijuana, pills, crack, cocaine, LSD, PCP, heroin, mushrooms, inhalants/paint/glue, or meth; Elliott & Huizinga, Reference Elliott and Huizinga1983; Jessor, Donovan, & Widmer, Reference Jessor, Donovan and Widmer1980; Jessor & Jessor, Reference Jessor and Jessor1977). Across siblings, 47% of the sample did not initiate any drugs, 28% of the sample initiated one drug, and 10% of the sample had initiated four or more drugs.
Analytic strategy
Data analyses proceeded in several steps. Child age, sex, the interaction between age and sex, and age difference between nontwin siblings were controlled for by regressing the variance in each variable out of the study variables (McGue & Bouchard, Reference McGue and Bouchard1984). The continuous residual scores were used in all analyses.
First, phenotypic correlations were computed to examine the associations between interpersonal variables (marital conflict about the child, parental monitoring, sibling negativity, and peer group delinquency) and the number of illegal drugs initiated by young adulthood, as well as the intercorrelations among the interpersonal variables. We also regressed all four interpersonal variables on drug use in a phenotypic multiple regression to determine whether marital conflict about the child, parental monitoring, sibling negativity, and peer group delinquency each explained unique variance in the number of illegal drugs initiated by young adulthood.
Second, for number of drugs initiated by young adulthood, means and standard deviations were examined across sibling type (MZ twins, DZ twins, and FI in nondivorced families; FS, HS, US in stepfamilies), and sibling ICCs were computed using double-entered data separately for each sibling type for each sample (correlating Sibling 1 with Sibling 2). Genetic influences are suggested if ICCs decrease according to decreasing genetic similarity (MZ > DZ = FI = FS > HS > US). Shared environmental influences are suggested if ICCs are similar for genetically nonidentical siblings (DZ = FI = FS > 0, HS > O, US > 0). Finally, MZ ICCs < 1 indicate nonshared environmental influences.
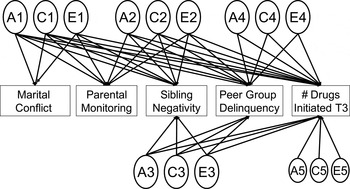
Third, we conducted multivariate Cholesky biometrical models of the raw data using Mx (Neale, Reference Neale1994) to systematically estimate genetic and environmental influences on the associations among the interpersonal relationship variables and initiation of illegal drug use. Figure 1 depicts the model for one sibling. The parameter estimates are set to be equal across the two sibling pairs, with the correlations between distinctive pairs of latent factors representing genetic influences (i.e., A1 for Sibling 1 and A1 for Sibling 2, A2 for Sibling 1 and A2 for Sibling 2, A3 for Sibling1 and A3 for Sibling 2, A4 for Sibling 1 and A4 for Sibling 2, and A5 for Sibling 1 and A5 for Sibling 2) set according to the genetic similarity of the siblings. Correlations between pairs of distinct shared environmental latent variables (C1–C5) were each set to 1, and nonshared environmental latent factors (E1–E5) were uncorrelated with each other or any other latent factor.
An illustration of the multivariate Cholesky model. The latent factors A1, C1, and E1 refer to the respective genetic, shared, and nonshared environmental influences on marital conflict. A2, C2, and E2 refer to the respective unique genetic, shared, and nonshared environmental influences on parental monitoring, or the genetic, shared, and nonshared environmental influences on parental monitoring that are not shared with marital conflict. A3, C3, and E3 refer to the respective unique genetic, shared, and nonshared environmental influences on sibling negativity, not in common with either marital conflict or parental monitoring. A4, C4, and E4 refer to the respective unique genetic, shared, and nonshared environmental influences on peer group delinquency not shared with any of the previous constructs; and A5, C5, and E5 represent the respective unique genetic, shared, and nonshared environmental influences on number of drugs initiated by young adulthood not in common with any of the predictors. All paths are estimated in the fully saturated model.

The order in which variables are entered into the model is important in multivariate Cholesky decompositions because the genetic and environmental influences contributing to associations among the first and subsequent variables are constrained by the genetic and environmental influences on the first variable entered into the model. As described earlier, we derived the order of our variables based on the patterns reviewed in the literature from predictors most distal to most proximal to initiation of drug use: (a) marital conflict about the child, (b) parental monitoring, (c) sibling negativity, (d) peer group delinquency, and (e) the number of drugs initiated by young adulthood, the outcome.
Multivariate Cholesky decompositions first estimate the genetic, shared, and nonshared environmental influences on the first variable (i.e., marital conflict about the child). Then, the association between the first and second variables (i.e., the association between marital conflict about the child and parental monitoring) is decomposed into genetic, shared, and nonshared environmental influences, followed by the association between the first and third variables, and so on. Unique genetic, shared, and nonshared environmental influences are then estimated for the second variable (parental monitoring), followed by the associations between the second and third variables, second and fourth variables, and so forth. This is repeated for each subsequent variable entered into the model, culminating in estimating the unique genetic, shared, and nonshared environmental influences on the outcome variable (i.e., number of drugs initiated by young adulthood).
We tested a saturated model estimating all genetic, shared, and nonshared environmental paths possible, and then systematically dropped paths that were not significantly different from zero (as judged by 95% confidence interval [CI]). Model differences were explored using a nested model approach that compared the constrained models to the saturated model. Differences in chi-square estimates between models tested whether the constrained models resulted in a significant decrement of model fit. If a model removing paths did not result in a significant decrement in fit from the saturated model, we concluded the path was no different from zero and therefore the model dropping those paths (the constrained model) was the better fitting and more parsimonious model. We first dropped each nonsignificant path individually. If there was a significant decrement in model fit (despite nonsignificant CIs in the full model), the path was considered significant and included during the next step in model fitting, when nonsignificant paths were dropped in pairs. We also tested dropped paths in larger groups until we arrived at the best fitting model. Results from both the full model and the best fitting model are presented.
Model assumptions
These types of behavioral genetic models assume that shared and nonshared environmental effects are the same across sibling types and that assortative mating (i.e., nonrandom mating that could result in suppressed genetic influences because DZs and full siblings would share more than 50% of their genes) is not occurring. These assumptions have previously been tested and have been generally found to be valid (Kendler, Reference Kendler2001; Pike, McGuire, Hetherington, & Reiss, Reference Pike, McGuire, Hetherington and Reiss1996). Further, there were no systematic differences for the validity of equal twin and sibling environments in NEAD (Reiss et al., Reference Reiss, Neiderhiser, Hetherington and Plomin2000), indicating that the equal environments assumption is reasonable for the current study. We also are assuming that the order of influence of predictors flows in the direction previously specified.
Results
Descriptive statistics
Behavioral genetic models are also particularly sensitive to skewness (Purcell, Reference Purcell2002). Therefore, we used log transformations to obtain a normal distribution for both marital conflict about the child and peer group delinquency. We also used SAS PROC RANK to normalize data by substituting values with ranks using a Blom transformation, to assure that smaller variations within the range of normality of skewness and kurtosis in the distributions of each variable would not affect modeling (Eaves et al., Reference Eaves, Silberg, Maes, Simonoff, Pickles and Rutter1997). The data were double entered prior to control for within-family confounds before performing any ICCs and phenotypic associations.
Genetic and environmental influences on drug use
The intraclass twin/sibling correlations showed a slightly decreasing pattern, suggesting substantial shared environment, but also genetic and nonshared environmental influences on drug use (MZ = 0.71, DZ = 0.70, FI = 0.40, FS = 0.56, HS = 0.31, US = 0.41). Univariate biometric analyses supported this pattern of findings. Results showed significant genetic (32%; 95% CI = 0.06–0.57), shared environmental (41%; 95% CI = 0.19–0.59), and nonshared environmental influences (27%; 95% CI = 0.18–0.41) for the number of drugs initiated by young adulthood with the variance nearly evenly split between the three.
Phenotypic associations
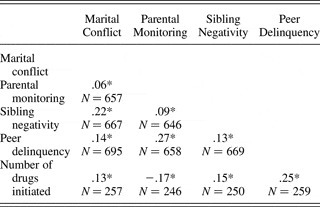
Phenotypic correlations are presented in Table 2. Overall, each interpersonal predictor was positively associated with the number of drugs initiated in young adulthood (r > .13, ps < .05), except parental monitoring, which was related to fewer drugs initiated, as expected (r = –.17, p < .05). All of the interpersonal predictors were correlated with one another (rs > .06, ps < .05).
Correlations among study variables

*p < .05.
The next step was to conduct a multiple regression analysis to estimate the extent to which each interpersonal variable predicted unique variance in the outcome, drug initiation. Marital conflict, parental monitoring, sibling negativity, and peer group delinquency were simultaneously added as predictors, with drug initiation as the dependent variable. The overall model was significant, F (4, 472) = 12.74, p < .001, and predicted about 10% of the variance in drug initiation (R 2 = .097). Parental monitoring (β = 0.08, t = 2.05, p < .05), sibling negativity (β = 0.09, t = 2.21, p < .05), and peer delinquency (β = 0.19, t = 4.49, p < .001) each contributed significant unique variance in drug initiation, controlling for the other interpersonal variables. Marital conflict contributed marginally significant unique variance in drug initiation, controlling for the other interpersonal variable (β = 0.08, t = 1.85, p = .065). Thus, we continued with the proposed model including all four interpersonal variables and drug initiation for the behavioral genetic analyses.
Model-fitting results
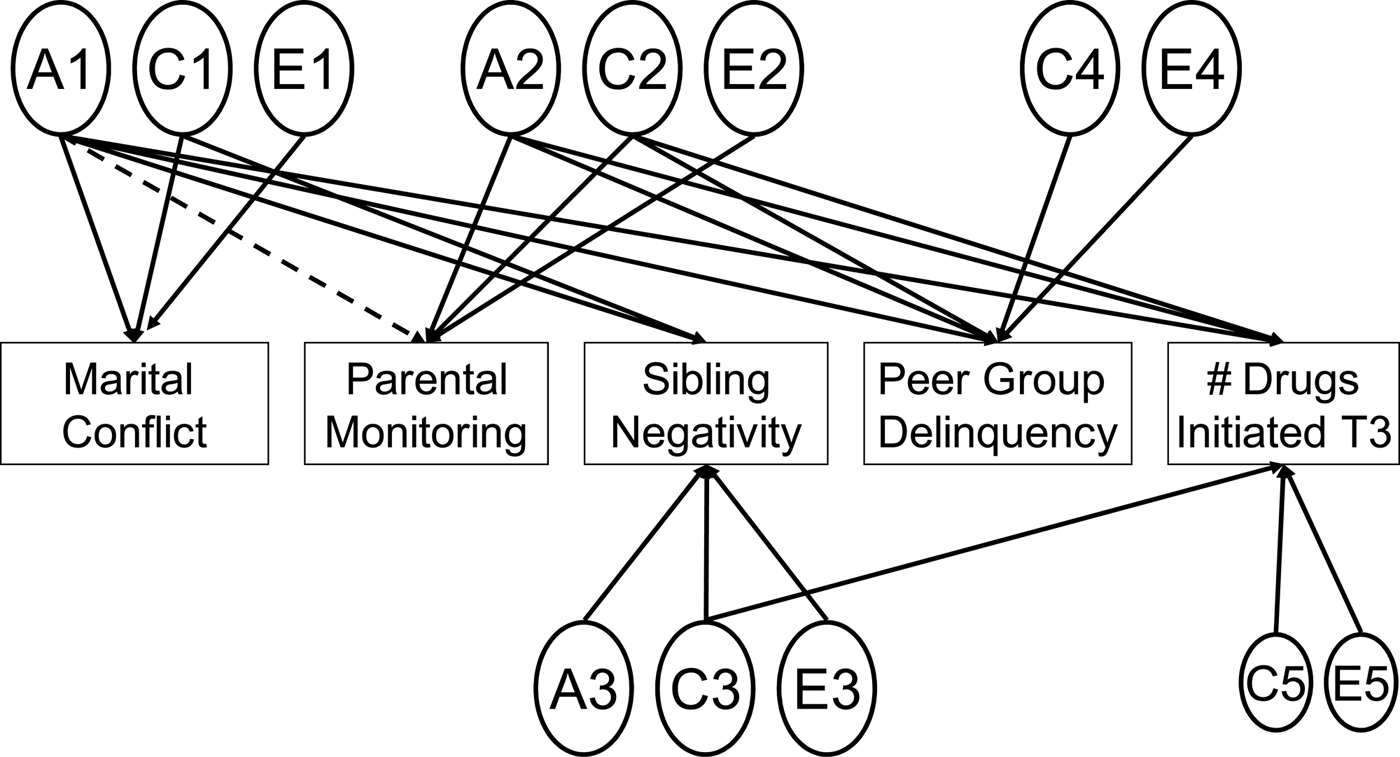
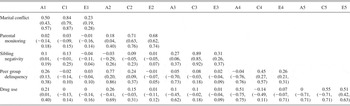
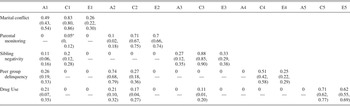
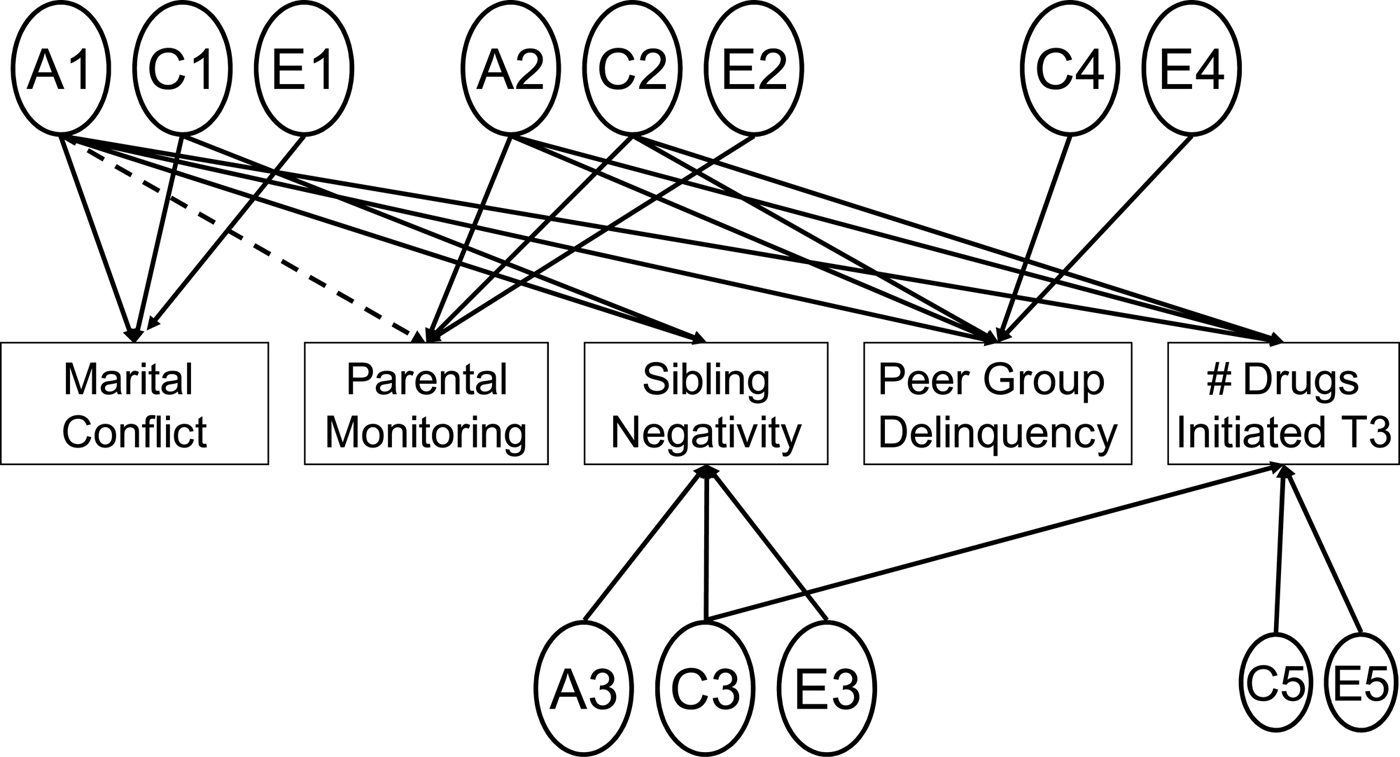
Unstandardized parameter estimates and 95% CIs for the fully saturated and best fitting models are presented in Table 3 (fully saturated), Table 4 (best fitting), and Figure 2 (best fitting). The constrained model (dropping nonsignificant paths) fit the data better than the fully saturated model, fully saturated model: –2 log likelihood (–2LL) (3088) = 7326.5, Akaike information criterion (AIC) = 1150.3; constrained model: –2LL (5971) = 14173.6, AIC = 2231.6; χ2 diff (22) = 30.3, p = .11, AIC diff = –13.7.
Significant paths for the best fitting model. The latent factors A1, C1, and E1 refer to the respective genetic, shared, and nonshared environmental influences on marital conflict. A2, C2, and E2 refer to the respective unique genetic, shared, and nonshared environmental influences on parental monitoring, or the genetic, shared, and nonshared environmental influences on parental monitoring that are not shared with marital conflict. A3, C3, and E3 refer to the respective unique genetic, shared, and nonshared environmental influences on sibling negativity, not in common with either marital conflict or parental monitoring. C4 and E4 refer to the respective unique shared and nonshared environmental influences on peer group delinquency not shared with any of the previous constructs, and C5 and E5 represent the respective unique shared and nonshared environmental influences on number of drugs initiated by young adulthood not in common with any of the predictors. Significant paths are shown with a solid line. The nonsignificant path estimate is depicted with a hashed line.
Model fitting results for the fully saturated model

Note: Unstandardized beta weights are presented (95% confidence intervals). The latent factors A1, C1, and E1 refer to the respective genetic, shared, and nonshared environmental influences on marital conflict. A2, C2, and E2 refer to the respective unique genetic, shared, and nonshared environmental influences on parental monitoring or the genetic, shared, and nonshared environmental influences on parental monitoring that are not shared with marital conflict. A3, C3, and E3 refer to the respective unique genetic, shared, and nonshared environmental influences on sibling negativity not in common with either marital conflict or parental monitoring. A4, C4, and E4 refer to the respective unique genetic, shared, and nonshared environmental influences on peer group delinquency not shared with any of the previous constructs; and A5, C5, and E5 represent the respective unique genetic, shared, and nonshared environmental influences on number of drugs initiated by young adulthood not in common with any of the predictors.
Model fitting results for the best-fitting model

Note: Unstandardized beta weights are presented (95% confidence intervals). Parameter estimates of 0 indicate that the parameter was not included in the best-fitting model. The latent factors A1, C1, and E1 refer to the respective genetic, shared, and nonshared environmental influences on marital conflict. A2, C2, and E2 refer to the respective unique genetic, shared, and nonshared environmental influences on parental monitoring or the genetic, shared, and nonshared environmental influences on parental monitoring that are not shared with marital conflict. A3, C3, and E3 refer to the respective unique genetic, shared, and nonshared environmental influences on sibling negativity not in common with either marital conflict or parental monitoring. A4, C4, and E4 refer to the respective unique genetic, shared, and nonshared environmental influences on peer group delinquency not shared with any of the previous constructs; and A5, C5, and E5 represent the respective unique genetic, shared, and nonshared environmental influences on number of drugs initiated by young adulthood not in common with any of the predictors.
aA parameter estimate is not significantly different from zero but is required to be in the model (or the model fails).
The best fitting model (Figure 2) revealed a genetic factor explaining variance common to marital conflict about the child, sibling negativity, peer group delinquency, and drug initiation (A1). There was also a discrete genetic factor explaining variance in parental monitoring, peer group delinquency, and drug initiation that was distinct from the genetic influences shared with marital conflict (A2). A final genetic factor explained unique variance in sibling negativity (A3). Peer group delinquency and drug initiation showed no unique genetic influences after accounting for the genetic variance shared with marital conflict and parental monitoring. There was a shared environmental factor explaining variance in marital conflict about the child and sibling negativity (C1). A separate shared environmental factor explained variance shared by parental monitoring, peer group delinquency, and drug initiation that was distinct from variance shared with marital conflict (C2). A third distinct shared environmental factor explained shared environmental influences on sibling negativity and initiation of drug use independent of the shared environmental influences on marital conflict and parental monitoring (C3). Finally, there were unique shared environmental factors influencing peer group delinquency (C4) and drug initiation (C5). Nonshared environmental factors did not explain any of the covariation among interpersonal variables and drug use. Instead, there were discrete nonshared environmental influences for each construct (E1–E5).
Discussion
This study sought to clarify the associations among interpersonal relationships within the family and peer group characteristics during adolescence influencing initiation of drug use by young adulthood. Findings indicate that interpersonal relationships during adolescence are associated with initiation of drug use for both genetic and environmental reasons and that these associations cluster in meaningful ways, suggesting four distinct factors for the initiation of drug use. In other words, marital conflict, sibling negativity, and peer group delinquency are all associated with initiation of drug use and with one another for shared genetic, but not environmental, reasons. Parental monitoring and peer group delinquency are associated with initiation of drug use through both genetic and shared environmental factors. Finally, an additional shared environmental factor is common to only sibling negativity and initiation of drug use. It is interesting that even after all of the variance shared with interpersonal relationships during middle adolescence had been accounted for there were still sizable and significant shared and nonshared environmental influences on initiation of drug use by young adulthood but no remaining genetic influences. These findings and their implications are discussed.
The first genetic pathway identified in this report reflects adolescent characteristics eliciting conflict in their relationships and also increasing their likelihood of associating with deviant peers and initiating drug use. This pathway is consistent with the coercive family cycle well documented by Patterson (Reference Patterson1982) and others (e.g., Compton et al., Reference Compton, Snyder, Schrepferman, Bank and Shortt2003; Conger, Ge, Elder, Lorenz, & Simons, Reference Conger, Ge, Elder, Lorenz and Simons1994; Dishion, Duncan, Eddy, Fagot, & Fetrow, Reference Dishion, Duncan, Eddy, Fagot and Fetrow1994; Loeber & Dishion, Reference Loeber and Dishion1984). In his initial work on the coercive cycle, Patterson focused on families of younger aggressive boys. He was clear that cycles of aggression between parent and child were initiated by the child, a finding that would fit with the importance of the child's genetic influences shown here. However, our study arrived on the developmental scene later than Patterson's. Here deviant child behaviors may be having a wider effect, on sibling and on marital conflict about the adolescent. Patterson tracked the links between the coercive cycles in the family and the child's entering delinquent peer groups with the link occurring through the school. Aggressive boys were not only aggressive at home but also aggressive at school where, rejected by nonaggressive and/or nondeviant peers, they sought the company of other deviant children. By adolescence, the child's genetically influenced characteristics seem, from our findings, to have had a detrimental impact on multiple relationships and thereby have increased their risk for adult substance use.
The second genetically influenced pathway centers on inadequate parental monitoring, peer group delinquency, and initiation of illegal drug use and may reflect lack of adolescent disclosure of their whereabouts and activities. In other words, the genetic influences of the child that influence the likelihood that they will elicit monitoring from their parents are correlated with their association with deviant peers and their likelihood of initiating illegal drug use by young adulthood. This pattern of findings is consistent with the adolescent disclosure explanation of parental monitoring and knowledge first proposed by Stattin and Kerr a decade ago (Kerr & Stattin, Reference Kerr and Stattin2000; Stattin & Kerr, Reference Stattin and Kerr2000). According to this explanation, the effects of parental monitoring on adolescent delinquent behavior is not the result of parents' active efforts to find out who their children are associating with and where and what they are doing but is instead due to their adolescent's disclosure of their activities to their parents.
We also identified two factors shaped by environments siblings share. Recent studies have drawn attention to this domain of influences, especially for family relationships, externalizing behaviors, and drug use. For example, as behavioral genetic studies include more direct measures of the environment like parenting behaviors, shared environmental influences have been found to account for substantial proportions of the total variance (e.g., Elkins, McGue, & Iacono, Reference Elkins, McGue and Iacono1997; Plomin, Reiss, Hetherington, & Howe, Reference Plomin, Reiss, Hetherington and Howe1994). Shared environmental influences have consistently been indicated for adolescent delinquency and antisocial behaviors (Rhee & Waldman, Reference Rhee and Waldman2002), and a recent meta-analysis found evidence for significant and meaningful shared environmental influences on behaviors within the externalizing and internalizing spectrums (attention-deficit/hyperactivity disorder was an exception with no shared environmental influence; Burt, Reference Burt2009). Given the findings that shared environmental influences are important for both interpersonal relationships and measures of adjustment, identifying two shared environmental factors that explain variation of initiation of illegal drug use is especially interesting.
The first shared environmental factor reflects a different type of parental monitoring effect: one that is parent driven rather than child driven. In this case, inadequate parental monitoring, peer group delinquency, and initiation of drug use covary because of nongenetic influences that make family members similar. Thus, consistent with the literature on parental monitoring and drug use (e.g., Dishion & Tipsord, Reference Dishion and Tipsord2011), parents who are more effective monitors have children who are less likely to associate with deviant peers and to initiate drug use and these associations. A parsimonious explanation for this sequence is that ineffective parental monitoring initiates a sequence of events that pivots around subsequent peer group delinquency and risk for substance abuse. The developmental sequence of parental monitoring and peer group delinquency is not established in this study but, as we have reviewed, has been documented elsewhere.
The second pathway shaped by shared environment reflects what may be a sibling deviancy training (e.g., Compton et al., Reference Compton, Snyder, Schrepferman, Bank and Shortt2003) effect, with shared environmental influences contributing to the covariation of sibling negativity and initiation of illegal drug use. These findings may provide one of the clearest examples of sibling deviancy training to date because this construct includes only the shared environmental influences that are uncorrelated with a more general family climate construct (marital conflict about the child) and are uncorrelated with peer group delinquency. In fact, another, distinct shared environmental factor emerged that seems to represent a general family climate of conflict and negativity for associations between marital conflict about the child and sibling deviancy. This family climate shared environmental factor, however, is uncorrelated with the sibling deviancy shared environmental factor.
Limitations and future directions
There are a number of limitations of the current report. We cannot clearly distinguish among the different types of genotype–environment correlations that may be operating, and it is likely that many different types of genotype–environment correlation are operating simultaneously. However, we can say that we find clear evidence for genotype–environment correlation in that genetic influences of the child explain associations among interpersonal relationships and initiation of drug use. Another limitation of this report is the cross-sectional nature of the design. Although we assessed the sample longitudinally, the age range was wide at each assessment. Nonetheless, all subjects who participated during the young adult assessment were beyond the age at which initiation of drug use typically occurs. The outcome variable, initiation of any illegal drug, could be seen as a shortcoming of the current report. Based on previous work that has found clear evidence for a common genetic liability for use of illegal drugs (Kendler et al., Reference Kendler, Jacobson, Prescott and Neale2003; Kendler, Karkowski, Corey, Prescott, & Neale, Reference Kendler, Karkowski, Corey, Prescott and Neale1999; Kendler, Karkowski, Neale, & Prescott, Reference Kendler, Karkowski, Neale and Prescott2000; Kendler, Karkowski, & Prescott, Reference Kendler, Karkowski and Prescott1999), we feel that this aggregate variable is appropriate. Finally, the use of parent reports of adolescent peer group characteristics limits our confidence that this is an index of the actual characteristics of the adolescent's peer group characteristics. Prior research using the NEAD sample using this measure and the child report measure (collected only at Time 2) found different patterns of genetic and environmental influences (Iervolino et al., Reference Iervolino, Pike, Manke, Reiss, Hetherington and Plomin2002; Manke et al., Reference Manke, McGuire, Reiss, Hetherington and Plomin1995). Parent reports showed more genetic influences, while child self-reports showed primarily nonshared environmental and modest shared environmental influences. Because the child self-report version was not administered at Time 1, we were limited to parent reports of peer group characteristics, and thus, those findings should be interpreted with some caution.
Despite these limitations, this study has clear implications for our understanding of the pathogenesis and prevention of drug use in early adulthood. First, it clarifies that, for samples similar in demographic characteristics to the one used here, environmental causes of substance abuse are important. Our data emphasize a pattern of recent findings that siblings are an important subsystem in the family and are a potential breeding ground for deviant behavior and substance abuse (e.g., Compton et al., Reference Compton, Snyder, Schrepferman, Bank and Shortt2003; Rende et al., Reference Rende, Slomkowski, Lloyd-Richardson and Niaura2005; Slomkowski et al., Reference Slomkowski, Rende, Novak, Lloyd-Richardson and Niaura2005). Preventionists often overlook siblings in their exclusive attention on other aspects of the family.
Second, our findings provide some support for both sides of the current debate about the pivotal role of parental monitoring in the initiation of drug use. Stattin and Kerr (Reference Stattin and Kerr2000) have argued, as we noted, that inadequate parental monitoring reflects problems of the child: they do not disclose what they do and hence the parents cannot act to prevent or reduce deviant behavior. Findings from this study give only partial support to that view. The shared environmental pathway we identified, the one that pivots around parental monitoring, is not consistent with Stattin and Kerr's argument. Taken together, our findings support the position that inadequate parental monitoring has two sources: a child problem, perhaps inadequate disclosure, and a parent problem, inadequate surveillance. Moreover, these are noncontingent and separable family problems. These findings suggest some families may show one type of problem and not the other, thus assessing families based on this critical distinction and tailoring interventions to improve child disclosure, where warranted, or to embolden parental surveillance, where warranted, or both is one way that these findings could be used to reduce the likelihood of the initiation of drug use.
Third, the lack of genetic influences on initiation of drug use by young adulthood that are not correlated with interpersonal relationships during adolescence is a novel finding that could have important implications. Our model accounts for all the genetic influences on initiation of drug use. It weights heavily a general hypothesis that the mechanisms by which genetic influences on drug use are expressed are mediated via their impact on family and peer relationships. If their influence on these relationships could be blunted, then the adverse effect of these genetic influences could be partially or entirely prevented. We need, of course, more rigorous studies here to establish, with certainty, that the genetic influences on relationship systems are not just epiphenomena. The surest way to do this is to conduct preventive interventions within the context of a twin or adoption design. Interventions aimed at marital conflict and sibling deviancy training should, in such a design, eliminate entirely the heritability of substance use. The data we report here not only suggest the importance of this crucial next step in drug abuse prevention but also raise a strong caution about the current passion to use gene identification studies to identify “druggable targets” (Uhl et al., Reference Uhl, Drgon, Johnson, Li, Contoreggi and Hess2008) for the prevention or treatment of substance abuse. Family and peer relationships now clearly qualify as intermediate phenotypes and, if genetically informed randomized controlled trials support their causal role in expression of genetic influences on drug abuse, they become legitimate therapeutic targets not for drugs, with all their unwanted side effects, but for psychosocial interventions that may be safer and equally effective.