I. INTRODUCTION
Being able to tune the electrical and optical properties of semiconductor nanomaterials during synthesis is quite critical, as control of the size and morphology may allow enhancement in these properties. Zinc oxide (ZnO) is a semiconductor with a wide direct band gap (3.37 eV) and a large exciton binding energy (60 meV), and it has many potential applications in electronic and optoelectronic devices such as varistors,Reference Gupta1, Reference Singhai, Chhabra, Kang and Shah2 gas sensors,Reference Gao and Wang3, Reference Liao, Lu, Li, He, Wang, Fu, Liu and Zhang4 field emittersReference Li, Bando and Golberg5, Reference Cheng, Chao and Chen6 and solar cells.Reference Ramamoorthy, Sanjeeviraja, Jayachandran, Sankaranarayanan, Bhattacharya and Kukreja7, Reference Choopun, Tubtimtae, Santhaveesuk, Nilphai, Wongrat and Hongsith8 Due to different functional requirements in these applications, a variety of techniques ranging from gas phase processes to solution routes including hydrothermal method,Reference Liu and Zeng9, Reference Pal and Santiago10 spray pyrolysis,Reference Ayouchi, Martin, Leinen and Ramos-Barrado11, Reference Htay, Hashimoto, Momose and Ito12 sol-gel processReference Ristic, Music, Ivanda and Popovic13, Reference Li, Srinivasan, He, Kang, Wu and Ponce14 and microemulsion methodReference Ahmad, Vaidya, Sarkar, Ghosh and Ganguli15, Reference Yildirim and Durucan16 have been used to synthesize ZnO nanostructures with different physical properties. However, high synthesis temperature, long synthesis periods, high vacuum requirements or sophisticated equipment necessities make these methods unfavorable for large scale production. Therefore, synthesis of highly crystalline ZnO nanostructures with proper size and morphology control under less rigorous synthesizing conditions still remains a challenge.
As an alternative route, precipitation method attracts particular interest since it allows convenient control of particle size and morphology for facile scale-up. A survey of literature shows that special morphologies of ZnO nanostructures such as rod,Reference Tao, Qian, Huang and Wei17 wire,Reference Wang and Gao18 starlikeReference Wang, Shen, Wang, Gao, Kang, Tian, Lan and Zhang19 or ellipsoidalReference Xie, Li, Zhang, Yang, Jiang, Sekiguchi, Liu and Bando20 can be obtained via solution-based methods and subsequent heat treatments. Meanwhile, little attention has been paid to room temperature synthesis of size- and morphology-controlled highly crystalline ZnO nanoparticles at short synthesis periods.
The objective of the study was to establish a simple approach for the synthesis of size- and morphology-controlled ZnO nanoparticles at around room temperature. A zinc salt (zinc acetate dihydrate) was used as zinc source and ethylene glycol (EG) or deionized (DI)-water was used as solvent and polyvinyl pyrrolidone (PVP) as chelating agent. Size control of ZnO nanoparticles at nearly 10 nm with narrow size distribution was achieved by modifying the processing parameters, including precipitation temperature and the amount of chelating agent. Morphology of the nanostructures was controlled by using different solvents. The effects of these parameters on resultant ZnO nanoparticles were investigated and described in detail. The correlation between precipitation temperature, chelating agent concentration, solvent type and the size of the resultant ZnO nanoparticles has been established in connection with a proposed precipitation mechanism.
II. EXPERIMENTAL PROCEDURE
A. Materials
ZnO nanoparticles were synthesized by using zinc acetate dihydrate (C4H6O4Zn·2H2O, 99.5%, Fluka, Sigma-Aldrich Chemie GmbH, Steinheim, Germany), PVPpyrrolidone [(C6H9NO)n, PVP, MW ∼ 55000, Aldrich, Sigma-Aldrich Chemie GmbH, Steinheim, Germany] and sodium hydroxide (NaOH pellets, 97%, Merck). EG (C2H6O2, EG, 99%, Merck KGaA, Darmstadt, Germany) or ultra pure DI-water was used as solvents. All reagents were used without any further purification.
B. Experimental methods
Zinc acetate dihydrate in a quantity of 0.4 g was dissolved in 15 mL EG at 25 °C. Meanwhile, 0.2 g PVP-containing 10 mL EG solution was prepared at 25 °C. Both solutions were stirred for 1 h to achieve complete homogenization. Then, zinc acetate dihydrate solution was added dropwise into PVP-containing solution in 5-s intervals and final solution was further stirred for 15 min at 25 °C. Finally, 2 M NaOH (20 mL) solution was added dropwise into the parent solution in 1 h and the pH of the final solution was measured as 12.7. After addition of NaOH, the solution took a milky appearance and it was aged by refluxing for 30 min at 25 °C. Then the solid extracts were collected by centrifugation at 10,000 rpm (using Eppendorf 5804 model, with a rotor radius of 115 mm, Eppendorf AG, Hamburg, Germany) for 10 min and washed five times with DI-water. The powder products were dried at 70 °C for 3 h in a vacuum dryer and no further thermal treatment was performed. This synthesis procedure described above can be considered as standard protocol. The same experimental protocol was also repeated by changing the reflux temperature to 60, 70 and 80 °C. In addition, to investigate the effect of changing the PVP quantity, standard protocol was repeated by replacing 0.2 g PVP-containing EG solution with 0.3 or 0.4 g PVP-containing EG solution. Likewise, to examine solvent effect on size and morphology of ZnO particles, the standard protocol was modified where DI-water was used instead of EG as a solvent. All experimental studies were carried in ambient air. Table I summarizes the precipitation conditions and reactants used in all experiments.
Average crystallite size of ZnO products estimated from the XRD results and as determined by SEM and TEM examinations.

N.A.: not available.
C. Materials characterization
X-ray diffraction (XRD) analyses were performed for phase identification of the products. A Rigaku D/Max-2000 PC diffractometer (Rigaku Corporation, Tokyo, Japan) was used, using Cu Kα radiation (λ = 1.54 Å) and x-ray source operating voltage of 40 kV in the 2θ range of 5–92° at a scanning rate of 2°/min. The XRD data were also used in estimating the average crystallite size of ZnO particles based on Scherrer’s approximation. (102) diffraction (at 47.46°, 2θ) parameters were used in predicting the representative crystallite size of ZnO nanoparticles.
Fourier transform infrared spectrometer (FTIR; Bruker AXS GmbH, Karlsruhe, Germany) analyses were performed using IFS 66/S model infrared spectroscopy, FTIR spectra of powders were obtained in the transmission mode.
The morphology and size of the ZnO particles were examined using a FEI Quanta 400F model scanning electron microscopy (SEM; FEI, Eindhoven, Netherlands). The energy dispersive x-ray (EDX) and elemental mapping analysis were also performed. Representative SEM samples were obtained using a suspension of ZnO particles dispersed in DI-water by ultrasonic treatment. A few drops of dilute dispersion were deposited onto a carbon film taped on aluminum grid and then dried in air. The samples were examined without any conductive coating.
The morphology of ZnO particles was further examined with JEOL 2100 F model transmission electron microscopy (TEM; JEOL Ltd., Tokyo, Japan). TEM samples were prepared by dropping of ultrasonically dispersed ZnO particle suspension in DI-water on hollow carbon grid. Then the grids were dried in air at 25 °C. The particle size measurements from SEM and TEM images were performed by the intercept method and error/deviation was estimated by root mean square (RMS) method. Five straight lines of same length were drawn through representative original micrographs that were magnified and sharpened using image analyses software. The particle boundaries intersected by each line segment were counted; the line length was then divided by an average number of boundaries intersected, taken over all the line segments. The average particle size was then determined by dividing this result by the linear magnification of the micrographs used. Standard deviations were computed from the average value differences determined for each one of five line segments.
The optical analyses of the ZnO particles were performed by ultraviolet-visible (UV-Vis) spectroscopy (using Varian-Cary100 Bio, Agilent Technologies Pty, Ltd., Mulgrave, VIC, Australia) in the wave length range of 300–800 nm at room temperature. In UV-Vis analyses, DI-water was used for baseline correction. The optical properties of the particles were also investigated by room temperature photoluminescence (PL) measurements using a He-Cd laser (325 nm; Midwest Laser Products LLC, Frankfurt, Germany) equipped with a Hamamatsu CCD camera (Hamamatsu Photonics K.K., Hamamatsu, Japan).
III. RESULTS
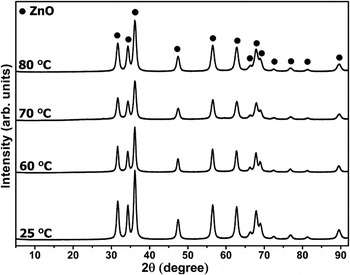
Figure 1 illustrates the XRD diffractograms of the reaction products obtained at different precipitation temperatures —25, 60, 70 and 80 °C—in the solution formulations containing identical amount of PVP (0.2 g) as chelating agent. The solvent was EG in all cases and the solid products were collected after 30-min precipitation (reflux) period. The XRD diffractograms revealed that all of the reaction products were phase-pure crystalline ZnO (hexagonal wurtzite structure, with Joint Committee on Powder Diffraction Standards (JCPDS) card no: 36-1451) and no other crystalline phase was detected. The yield of standard protocol (at 25 °C- 0.2 g PVP- EG solvent), i.e., ZnO product formation through zinc acetate dihydrate precursor, was determined at around 95% on molar basis. This shows that proposed precipitation mechanism is very effective to synthesize phase-pure ZnO nanoparticles at 25 °C.
XRD patterns of precipitation products synthesized in 0.2 g PVP-containing EG-based solutions at 25, 60, 70 and 80 °C.

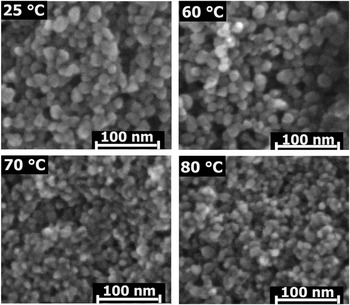
Figure 2 shows the SEM micrographs of the same ZnO particles synthesized in EG-based solutions at different precipitation temperatures. SEM images indicate that the ZnO nanoparticles had spherical morphology, independent of the reaction temperature. An approximate chemical composition of ZnO powders synthesized at 25 °C was also determined with the EDX analysis accompanied with elemental mapping analysis (not shown). EDX data revealed that the particles were composed of Zn and O elements with an atomic Zn: O proportion of 50.2:49.8, close to the stoichiometric ratio of 1:1. Meanwhile, the elemental mapping images also confirmed homogeneous distribution of zinc and oxygen suggesting highly pure and stoichiometric ZnO precipitation products.
SEM micrographs of ZnO nanoparticles prepared in 0.2 g PVP-containing EG-based solutions at 25, 60, 70 and 80 °C.

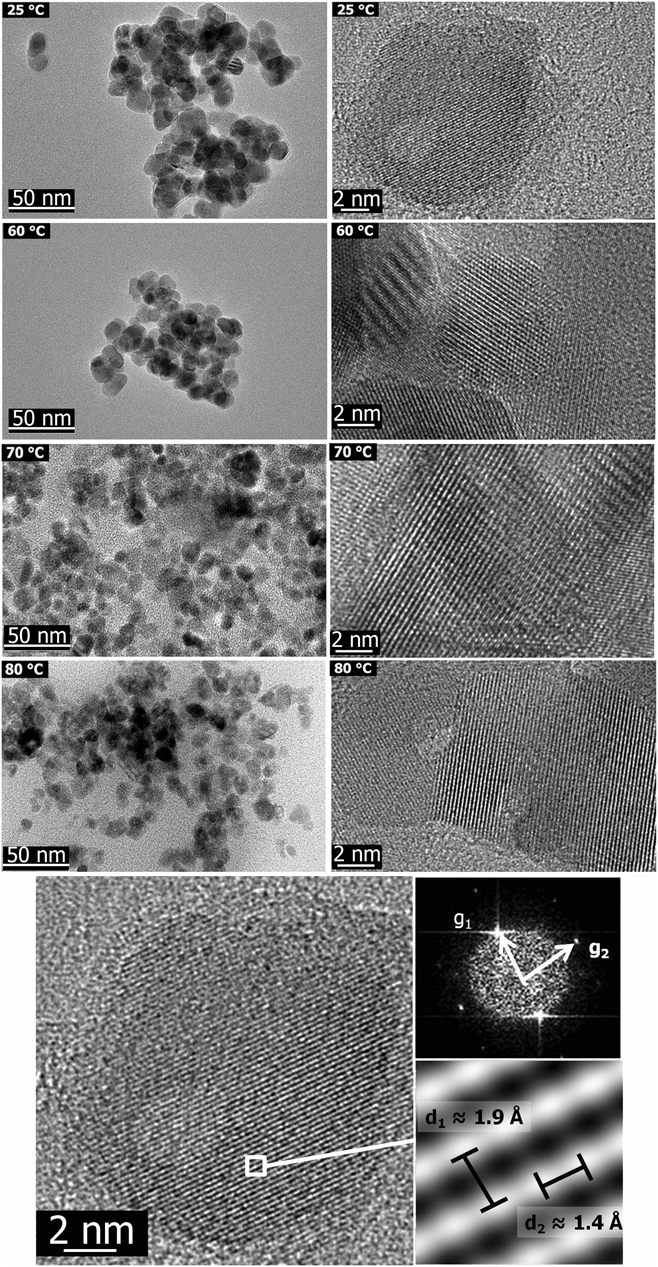
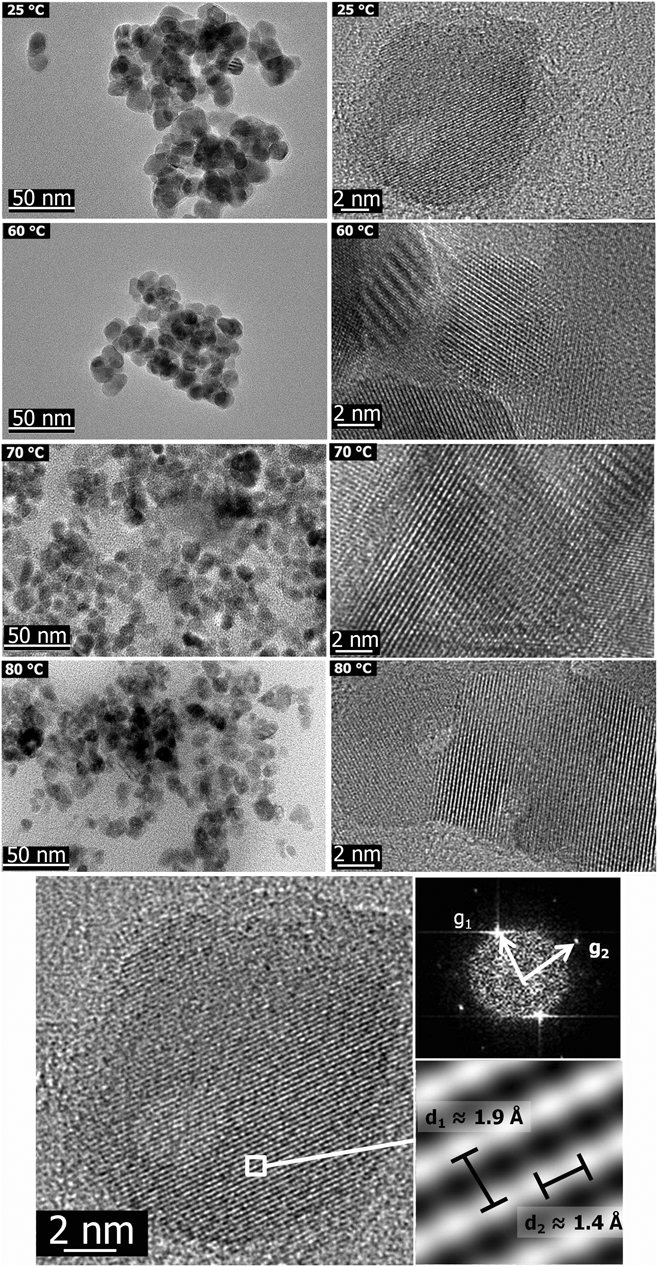
The morphology and size of the same ZnO nanoparticles were further investigated by TEM. The low and high magnification TEM images of ZnO products synthesized in EG-based solutions at 25, 60, 70 and 80 °C are shown in Fig. 3. TEM data also point out that, keeping all other reaction/process parameters identical, spherical ZnO nanoparticles with smaller size were obtained when precipitation temperature was increased. The average particle sizes from TEM results were estimated as 13.0 ± 1.9 nm, 12.2 ± 1.5 nm, 11.8 ± 1.8 nm and 9.0 ± 1.3 nm for the ZnO particles obtained by reactions at 25, 60, 70 and 80 °C, respectively. In parallel to the SEM findings, the TEM images again confirmed an equiaxed/spherical morphology with uniform size distribution for all precipitation products. The high magnification TEM micrographs of selected ZnO nanoparticle(s) exhibiting the fringes of individual planes suggest that ZnO nanoparticles are single crystal, as also clearly indicated by the bottom image in Fig. 3. This figure shows the high-resolution transmission electron microscopy (HRTEM) image of ZnO nanoparticles prepared at 25 °C in the presence EG as solvent and 0.2 g PVP, i.e., according to the standard protocol. The upper and lower insets indicate fast Fourier transform (FFT) pattern and inverse fast Fourier transform (IFFT) pattern showing the lattice spacings respectively. The diffused FFT patterns suggest that ZnO particles are single crystal. The lattice spacing between two adjacent planes was determined as ∼1.9 Å confirming the wurtzite hexagonal structure of ZnO.
TEM (left side) and high resolution TEM (left side) micrographs of ZnO nanoparticles obtained in 0.2 g PVP-containing EG-based solutions at 25, 60, 70 and 80 °C. The bottom-centered image is for ZnO prepared in 0.2 g PVP-containing EG-based solutions at 25 °C. The upper and lower insets indicate FFT pattern and IFFT pattern showing the lattice spacing, respectively.
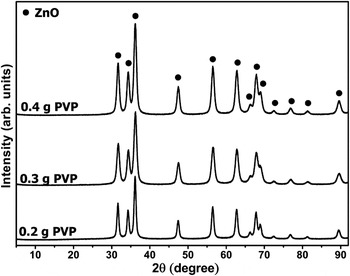
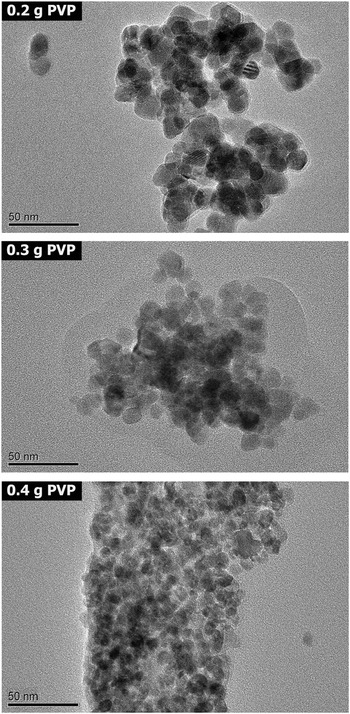
The XRD diffractograms of precipitation products synthesized in EG-based solutions at 25 °C after 30 min in the presence of different amounts of PVP (0.2, 0.3 and 0.4 g) are shown in Fig. 4. In all cases, the diffraction pattern again matches with that of crystalline ZnO (hexagonal wurtzite structure, with JCPDS card no: 36-1451) and no additional peaks associated with any other phase/impurity were observed. Meanwhile, the TEM micrographs of ZnO nanoparticles of the same set (with varying PVP amount) are shown in Fig. 5. The characteristic spherical morphology did not change with increasing PVP amount, but particle size decreased. The average particle size of the highest amount of PVP-containing (0.4 g) precipitation formulation was 5.3 ± 0.3 nm; almost half of the average size of the ZnO particles obtained with minimum PVP-containing formulation (0.2 g), which was determined as 13.0 ± 1.9 nm.
XRD patterns of precipitation products prepared by using 0.2, 0.3 and 0.4 g PVP-containing EG-based solutions at 25 °C.

TEM images of ZnO nanoparticles synthesized by using 0.2, 0.3 and 0.4 g PVP-containing EG-based solutions at 25 °C.

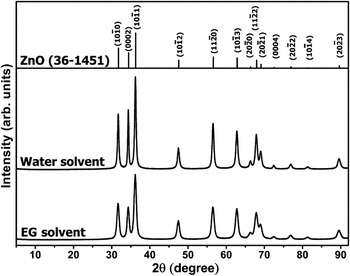
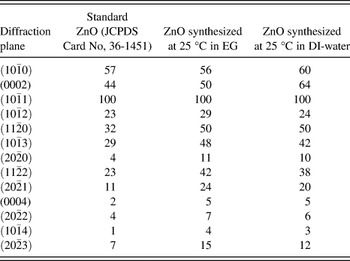
Figure 6 shows the XRD diffractograms of ZnO precipitation products prepared at 25 °C in the presence of 0.2 g PVP in two different solvents; EG and DI-water. For direct comparison purposes, the JCPDS card of crystalline ZnO is also presented as an inset in Fig. 6 to guide the presentation of the relative intensities of the diffractions. When DI-water was utilized instead of EG, again phase-pure ZnO precipitates were obtained as the only crystalline product. The distinction between XRD patterns of ZnO particles synthesized using either EG or DI-water as solvent was the differences in relative intensities of the certain diffractions. A comparison of the normalized intensities for all diffraction peaks in Fig. 6 is also shown in Table II. These data show that, when water was used instead of EG, the intensity ratio of (0002) and  diffractions changes. The reason for this difference will be explained in the discussion part.
XRD patterns of standard ZnO (with JCPDS Card No. 36-1451) and precipitation products prepared by using 0.2 g PVP-containing EG-based and DI-water-based solutions at 25 °C.

Relative normalized intensities of the diffractions for standard ZnO (JCPDS card no: 36-1451) and ZnO powders synthesized at 25 °C in EG and DI-water based solvent.

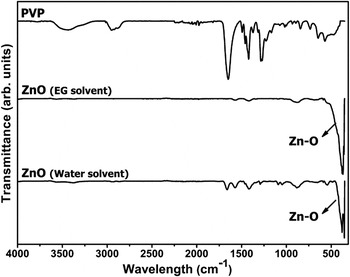
The differences in chemical composition of ZnO precipitates synthesized using different solvents were also investigated with FTIR spectroscopy and the spectra of the ZnO particles obtained in EG-based and DI-water-based precipitation formulations are shown in Fig. 7. The FTIR spectrum of PVP is also shown in Fig. 7. For PVP, the bands located at 3440, 2950, 1650, 1420 and 1288 cm-1 were assigned to the O-H stretching vibration, CH2 unsymmetrical stretching vibration, C = O stretching vibration, CH2 bending vibration and C-N stretching vibration bands, respectively.Reference Sui, Liu, Shao, Liu and Xu21 ZnO spectra reveal four adsorption bands located at 1573, 1420, 880 and 400 cm-1 assigned for C = N stretching vibration, CH2 bending vibration, NO and ZnO stretching mode, respectively.Reference Drelinkiewicz, Hasik, Quillard and Paluszkiewicz22–Reference Wahab, Kim, Lee and Shin24 FTIR spectrum of the ZnO precipitates prepared in DI-water showed two additional bands located at 1660 and 1288 cm-1. The reason for presence of these peaks will also be clarified in discussion. In summary, FTIR spectra show that the precipitation products are ZnO that contained small amounts of organic residues attributable to the starting precursor materials.
FTIR spectra of pure PVP and ZnO nanoparticles synthesized in 0.2 PVP-containing EG-based and DI-water-based solutions at 25 °C.

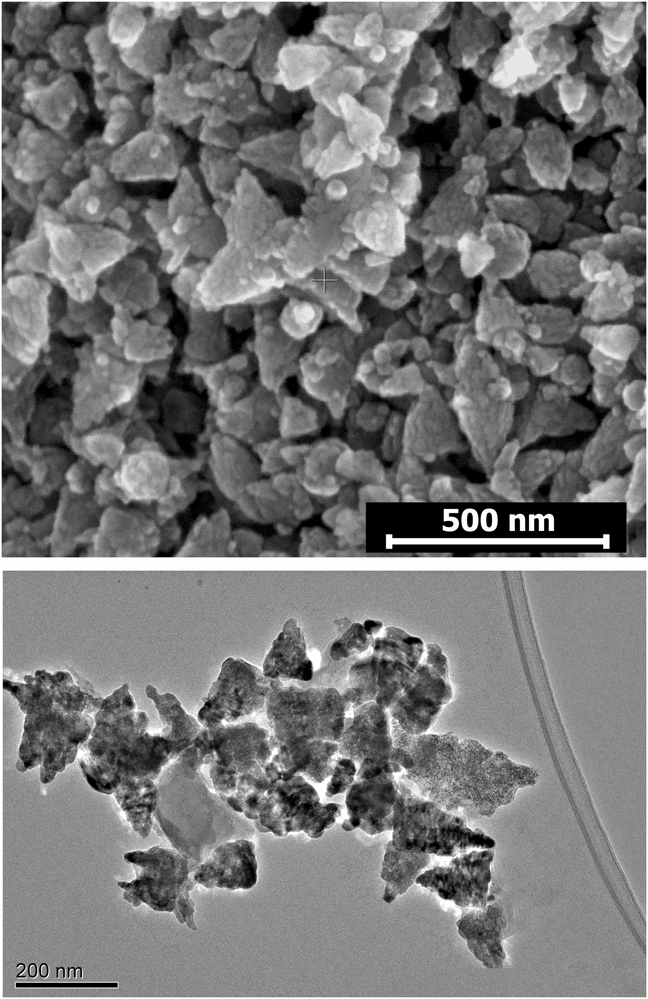
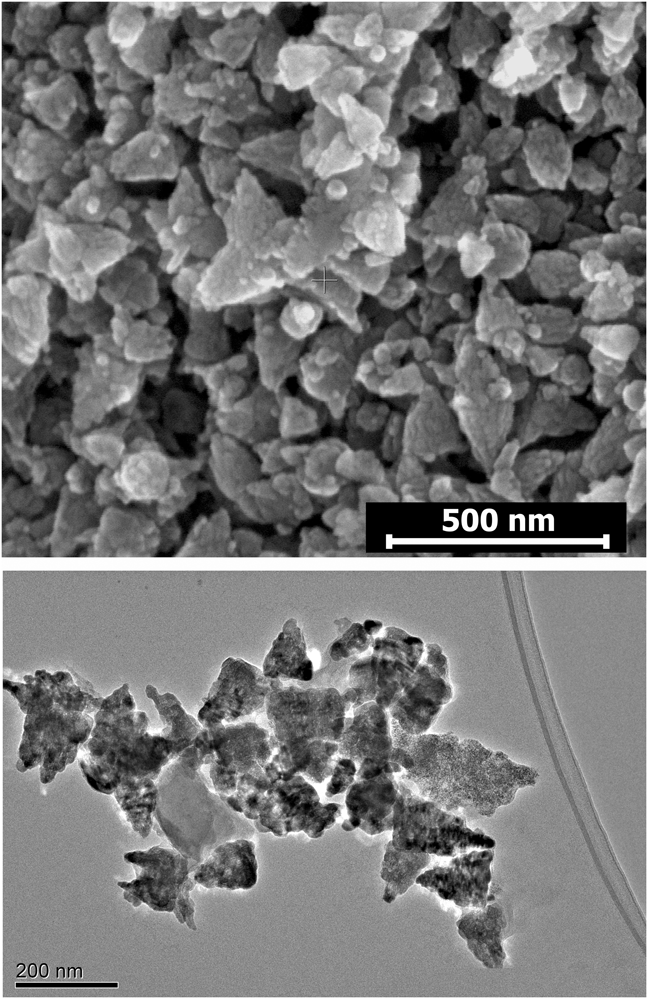
SEM and TEM micrographs of ZnO nanoparticles prepared by using DI-water as solvent at 25 °C precipitation temperature are shown in Fig. 8. Changing the solvent from EG to DI-water resulted in coalescence of ZnO nanoparticles in the form of isosceles triangle. The average side lengths of triangles were determined as 175 ± 20 nm from the micrograph.
SEM (top) and TEM (bottom) micrographs of agglomerated ZnO nanoparticles prepared by using 0.2 g PVP-containing DI-water-based solution at 25 °C.
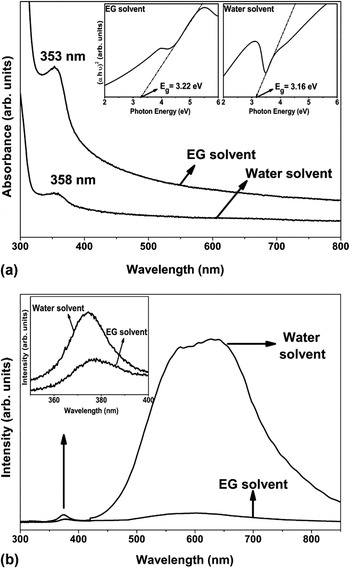
The optical properties of ZnO precipitates obtained from EG and DI-water solvent formulations (at 25 °C) are presented with the absorption and room temperature PL spectra shown in Fig. 9(a) and Fig. 9(b), respectively. The absorption spectra had distinct absorption bands at ∼353 nm and ∼358 nm for EG and DI-water formulations, respectively. The directband gap energy (Eg) of ZnO were determined by fitting the absorption data and given as insets in UV absorption graphs. Figure 9(b) shows that both powders prepared in different solvents exhibit weak UV emission (∼380 nm) and strong orange emission (∼640 nm) bands.Reference Studenikin, Golego and Cocivera25, Reference Yang, Wang, Ge, Guo, Yang and Shen26 The intensities of both characteristic emissions for ZnO powders synthesized in EG were lower than that of ZnO powders prepared in DI-water.
(a) UV-Vis adsorption spectra and (b) room temperature PL spectra of ZnO nanoparticles prepared by using 0.2 g PVP-containing EG-based and DI-water-based solutions at 25 °C precipitation temperature. The insets in (a) show plots of (αhv)2 as a function of photon energy (Eg) for both precipitation products. The inset in (b) discloses the indicated segment from the underlying PL spectra, magnified to show the band gap emission.

IV. DISCUSSION
Highly crystalline ZnO nanoparticles can be synthesized with proposed precipitation system at around room temperature and short precipitation periods. The results show that the size and morphology modification of ZnO particles can be accomplished by controlling various processing parameters, including precipitation temperature, amount of chelating agent and solvent type.
A. Effect of reaction temperature on size and morphology of ZnO particles
Synthesis of spherical ZnO nanoparticles was achieved when EG was used as solvent in the presence of PVP as chelating agent. The particle size was greatly affected by the precipitation temperature (Figs. 2 and 3). Higher precipitation temperature most likely results in an increase in the nucleation events leading to smaller ZnO precipitates. Meanwhile, that the adsorption characteristic of PVP essentially determines the morphology of resultant ZnO particles.
During precipitation of solid particles in ionic parent solutions, relative surface activity of various growth facets is one of the important size- and morphology-determining factors for the resultant crystalline product. ZnO crystal has a polar structure and consists of catalytically active Zn-terminated polar top surface  , catalytically inert O-terminated polar bottom surface
 and nonpolar surfaces
 and
 .Reference Gao and Wang27, Reference Wang28 Organic additives in the parent solution, EG and/or PVP, can selectively interact with these sites of energetically different states and restrain growth of the certain crystallographic planes of such crystal system mainly by chemical and/or physical adsorption. The former can preferentially occur between organic molecules and positive polar planes of ZnO crystals; however the latter takes place between organic additives and nonpolar planes of ZnO crystals. As a result of adsorption events and selective passivation of certain planes by the organic molecules, relative growth rate of the precipitating particles changes in these crystallographic directions.Reference Zhang and Zhu29, Reference Rashid, Raula, Bhattacharjee and Mandal30
EG is an organic solvent consisting of polar OH molecules and affects the growth of ZnO crystal due to its excellent chemical adsorption ability by means of complexes developing between anionic groups of EG and positive polar top surface of ZnO crystals.Reference Ghoshal, Kar and Chaudhuri31 Similarly, growth orientation of ZnO is also affected by PVP, which can hamper growth of certain planes of ZnO both by chemical and physical adsorption. In the polar media, possible coordination between PVP and ZnO crystal is chemical adsorption, which occurs between negatively charged oxygen ions of PVP and positively charged polar top surface of ZnO crystal.Reference Sui, Liu, Shao, Liu and Xu21 However, such chemical association between EG and ZnO crystals already exists in the current precipitation system. Therefore, PVP molecules physically adsorb on nonpolar surfaces of ZnO crystal. Both chemical adsorption of EG and physical adsorption of PVP inhibit growth of ZnO at preferential growth direction and lead to formation of spherical ZnO nanostructures in equiaxed form. At higher reaction temperature, both the high number of nucleation events and enhanced adsorption of EG and PVP on the growth plane of ZnO crystals favor formation of smaller yet uniform and spherical ZnO precipitates. Table I summarizes the average crystallite size of particles determined from XRD results (by peak-broadening analyses) and the average particle size obtained from SEM and TEM examinations of ZnO particles synthesized as different reaction temperatures. All analytical results on particle sizes are in good agreement and the average size of the ZnO particles can be effectively controlled in the range of 9–13 nm by the choice of precipitation temperature in the range of 25 °C–80 °C.
B. Effect of chelating agent (PVP) quantity on size and morphology of ZnO particles
It has been found that the average particle size of ZnO nanoparticles also decreases with increasing amount of PVP at precipitation temperature of 25 °C (Fig. 5 and Table I). This is due to two factors; i. PVP promotes nucleation of ZnO by accelerating the dehydration reaction of ZnO precursor and forming coordinating complex,Reference Wei, Lian and Jiang32ii. Both physical and chemical adsorptions of PVP molecules on ZnO crystal are promoted in precipitation solutions containing higher PVP amount.Reference Wei, Lian and Jiang32 It has been reported that a critical amount of PVP is required to produce a significant change in ZnO precipitation mechanism.Reference Zhang, Liu, Wang and Ming33 At very low concentration, PVP is not effective to promote ZnO nucleation, whereas increasing the PVP amount provides nucleation and crystallization of ZnO by means of chemical adsorption. However, further increase in the PVP amount promotes not only chemical but also physical adsorption and causes formation of smaller ZnO particles. In the precipitation system containing high amount of PVP and EG as solvent, both chemical adsorption of EG and PVP, and physical adsorption with PVP occur simultaneously. As a result, particle growth is also distinctly inhibited and smaller-sized spherical ZnO nanoparticles develop. As summarized in Table I with an increase in the amount of PVP from 0.2 to 0.4 g in the parent solution, the average size of the particles decreased from 13.0 ± 1.9 nm to 5.3 ± 0.3 nm according to TEM examinations.
C. Effect of solvent type
The solvent mainly affects the agglomeration tendency of ZnO nanoparticles. In the presence of EG, polar planes (0001) and nonpolar  planes of ZnO nuclei are associated with EG and PVP, respectively. This preferential coordination is due to distinctly highly polarized nature of EG as compared with PVP. These interactions reduce the surface free energy of these particular planes and depress any directional growth of ZnO nuclei. This eventually leads to equiaxed/spherical particle morphology (Fig. 2). However, using water instead of EG resulted in triangular shaped ZnO agglomerates (Fig. 8). This can be explained by different stabilization ability of the solvent on specific crystallographic planes of the growing crystal.Reference Pacholski, Kornowski and Weller34 When water was used, polar PVP molecules weakly link nonpolar
 planes of ZnO nuclei, as well with the polar (0001) planes that readily available in the absence EG. However, considering presence of same amount of PVP both in EG- and water-based precipitation systems, the additional molecular coordination of PVP with polar (0001) planes results in less effective association with nonpolar lateral planes of larger area; in other words, in water-containing system the nonpolar planes were less effectively covered by PVP. As a result of limited reduction of the surface free energy of the lateral planes, ZnO crystals tend to form multi nuclei aggregates in triangular form.
In addition, the XRD data (Fig. 6) suggests a possible morphological variation for the primary ZnO particles within agglomerates obtained in water. The diffraction peak intensities of the ZnO products prepared from EG-based precipitation solution at 25 °C show a complete match with the standard card in terms of intensity order for the diffraction events. This is a sign for formation of the energetically most favorable form, spherical morphology, of ZnO nanoparticles. On the other hand, the XRD pattern of ZnO particles synthesized at 25 °C in DI-water show a distinct deviation from the standard intensity order for the  and
 diffractions. The reason for such differences is the anisotropic growth of ZnO nanostructures during precipitation reaction. The preferential growth orientation of ZnO is [0002] direction in terms of energy considerations. Therefore, particles should tend to grow along [0002] direction and relative intensity of
 peak increases in the absence of any additives that can prevent to grow particles through this direction. Yao et al.Reference Yao, Wu, Ge, Yang, Zeng, Wang and Jiang35 reported that higher relative intensity of
 diffraction increases due to the preferential orientation along this direction by the formation of many
 sides, which causes the formation of triangular ZnO nanoparticles. According to XRD pattern of ZnO structures synthesized in the DI-water based precipitation system, relatively higher intensities of these peaks [
 and
 ] point out growth of recently formed ZnO nanostructures into agglomerated triangular ZnO structures.
FTIR investigation also provides some insights into the physical and chemical events between ZnO precipitates in their respective parent solutions (Fig. 7). The ZnO particles prepared in EG shows the main absorption bands of ZnO stretching mode located at around 400 cm–1. This spectrum also exhibits bands around 1573, 1420 and 880 cm-1 associated with C = N stretching vibration and CH2 bending vibration of PVP and NO stretching mode but not contains bands around 1650 and 1288 cm-1 associated with C = O and C-N stretching vibration bands of PVP, respectively.Reference Drelinkiewicz, Hasik, Quillard and Paluszkiewicz22, Reference Muta, Ishida, Tamaki and Satoh36 The presence of peaks related with PVP indicates that there should be an interaction between PVP and resultant ZnO particles. However, weak intensities of bands located at 1573 and 1420 cm-1 indicate that chemical adsorption between PVP and ZnO is recessive and the existence of relatively higher intensities of band at 880 cm−1 shows physical adsorption between nitrogen atoms of PVP and oxygen atoms of ZnO. Therefore, main adsorption between PVP and ZnO crystal in EG should be physical adsorption and particle morphology mostly depends on chemical adsorption with EG and physical adsorption with PVP. FTIR spectra of particles prepared in DI-water on the other hand exhibits two additional bands at 1660 and 1288 cm−1 which indicate that dominant resonant structure of PVP is >N-C = O.Reference Sui, Liu, Shao, Liu and Xu21 Presence of these bands shows that both chemical and physical adsorption between PVP and ZnO may occur. However, the shift of C = O stretching vibration band of PVP from 1650 to 1660 cm−1 indicates that interaction between the carbonyl group in PVP and inorganic nanoparticles.Reference Bai, Li, Zhang, Liang and Yang37 Due to absence of interaction between water and polar plane of ZnO, interaction between the carbonyl group of PVP and ZnO crystal occurs with the polar plane of ZnO.Reference Zhang, Shao, Gao, Li and Liu38 Therefore, inhibition of growth of ZnO crystal along preferential growth direction only depends on chemical adsorption of PVP and particle growth occurs on certain directions and triangular ZnO forms.
Optical properties of ZnO nanoparticles simultaneously depend on two main characteristics of particles; size and defect structure. Independent of the solvent type, the absorption spectra for both ZnO particles exhibit the main absorption band related with wurtzite type of ZnO [Fig. 9(a)].Reference Wahab, Ansari, Kim, Seo, Kim, Khang and Shin39 However, the positions of bands are slightly different, at ∼353 nm for EG and ∼358 nm for DI-water, both showing a blue shift compared to values that of bulk ZnO (∼373 nm).Reference Haase, Weller and Henglein40 Moreover, the absorption band wave length of particles prepared in EG illustrates a more distinct blue shift with respect to particles prepared in the DI-water. This difference is due to smaller size of particles synthesized in EG. This is also reflected by the band gap values. Upon a decrease in particle size resulting in a positional shift in the adsorption wave lengths to the relatively lower values, band gap value increases.Reference Singla, Shafeeq and Kumar41 The band gap of ZnO prepared in EG (Eg = 3.22 eV) with relatively smaller size is higher than that of in water (Eg = 3.16 eV). The presence of defects in ZnO nanostructure is another important factor detrimental to optical properties of particles because they will diminish band gap and cause deterioration of optical properties of ZnO nanoparticles. According to literature, ZnO powders mainly exhibit three emission bands: UV emission (∼380 nm) which is attributed to the direct recombination of excitons,Reference Willander, Nur, Sadaf, Qadir, Zaman, Zainelabdin, Bano and Hussain42 green emission (∼530 nm) associated with oxygen vacanciesReference Kang, Kang, Kim and Lee43 and orange emission (∼640 nm) which is attributed to oxygen interstitials.Reference Liu, Kitai and Mascher44 According to results of the current study, although both samples that have been prepared with different solvents exhibit UV and orange emissions, particles prepared in DI-water show very high intensity of orange emission [Fig. 9(b)]. This is due to the high number of oxygen interstitials and may be attributed to high extent of chemical coordination between oxygen atoms of PVP and polar surfaces of ZnO crystals.
V. CONCLUSIONS
Size-controlled, low temperature synthesis of highly crystalline ZnO nanoparticles was performed via precipitation method. The size of spherical ZnO nanoparticles decreased with increasing precipitation temperature as a result of increase in the number of nuclei formation and enhancement chemical and physical adsorption between ZnO crystals and organic molecules. Furthermore, when higher amount of chelating agent was used, the size of spherical ZnO particles decreased due to the existence of combined chemical adsorption of EG and PVP with ZnO crystal, and physical adsorption between PVP and ZnO. Hence, the proposed solution precipitation system is advantageous for obtaining size-controlled ZnO nanoparticles with narrow size distribution. Moreover, a variation in agglomeration behavior for ZnO nanoparticles was observed by changing the solvent from EG to DI-water. Results of this study indicate that the suggested precipitation method provides a simple approach for tailoring the size of the ZnO nanoparticles at low precipitation temperatures and short processing periods by a simple wet chemical route.
ACKNOWLEDGMENTS
This work is supported by Middle East Technical University through Grant BAP-03-08-2009-06. ÖAY thanks The Scientific and Technological Research Council of Turkey, TUBITAK, for the support by the National Scholarship Program for Ph.D. students and also METU-ÖYP Program. The authors thank Yunus Eren Kalay for his assistance in TEM data analyses.