INTRODUCTION
Take-all of wheat (caused by Gaeumannomyces graminis var. tritici (Ggt)) is one of the most common wheat root diseases. The extent and severity of this disease can vary considerably between growing seasons (the period between sowing and harvest). The phrase ‘take-all years’ is used to describe growing seasons when the symptoms of take-all are widespread across a region and severe take-all occurs. Take-all years are associated with weather patterns that encourage pathogen growth and/or reduce the tolerance of plants to root infection (Hornby Reference Hornby1998). In regions such as Europe, climate change (which may include wetter winters and drier summers than previously) has been predicted to lead to increased yield losses per unit of take-all, although effects of climate change on disease severity were considered to be unknown (West et al. Reference West, Townsend, Stevens and Fitt2012). In Canada, on the other hand, milder winters were expected to cause increased primary Ggt inoculum survival and take-all disease establishment, but drier soil conditions were expected to slow the rate of take-all progress, contributing overall to small decreases in the disease (Boland et al. Reference Boland, Melzer, Hopkin, Higgins and Nassuth2004). Those reports illustrate the importance of understanding the effects of weather conditions on environment-specific regional wheat cropping systems. In areas where climatic conditions also vary considerably between growing seasons, seasonal variation in take-all is likely, especially where environmental conditions switch from limiting to non-limiting or vice versa. This climatic variation between growing seasons will also influence the development of epidemics during sequences of consecutive wheat crops.
Herdina & Roget (Reference Herdina and Roget2000) noted that knowledge of Ggt levels in commercial fields can significantly influence management decisions. Studies using commercial fields can provide a means of assessing differences between growing seasons, and may provide a wider spectrum of inoculum and disease parameters than that found in long-term trials that are typically based at a single site or a small number of sites (Bateman & Hornby Reference Bateman and Hornby1999; Paulitz et al. Reference Paulitz, Schroeder and Schillinger2010; Bithell et al. Reference Bithell, Butler, McKay and Cromey2013). Studies utilizing commercial fields must, however, take into account that multiple known and unknown variables may play a role and may differ between sites. Studies in commercial fields have shown that growing seasons with higher spring or summer rainfall were associated with higher take-all incidence or severity (Polley & Thomas Reference Polley and Thomas1991; Hall & Sutton Reference Hall and Sutton1998). However, such studies recorded only disease and were thus unable to identify climate effects on inoculum or inoculum–disease relationships.
Inoculum-dependent polycyclic diseases can display slow disease development despite high inoculum concentrations if weather conditions are limiting (Kocks et al. Reference Kocks, Zadoks and Ruissen1999). Thus, knowledge of inoculum concentrations before sowing may provide an additional means of determining limiting factors for disease, especially where high pre-sowing inoculum concentrations do not result in above average disease. Bailey & Gilligan (Reference Bailey and Gilligan1999) showed that progress of seminal root infection with take-all over time in a field trial followed a similar relationship to that found using a low concentration of artificial inoculum in laboratory experiments: they noted, however, that their field data did not contain measurements during the early periods (<600 °Cd) of primary infection. Although the extent of early infection by Ggt has been shown to be affected by inoculum concentration, most studies have been laboratory based. In particular, studies that investigated the effects of inoculum concentration on primary (early growth stage) infection in relation to the resulting epidemic or prior crop sequence and seasonal effects, especially for take-all epidemics in commercial wheat fields, could not be found.
There is evidence that occurrence of take-all decline (TAD), a form of biological control of take-all, in a wheat sequence is also affected by seasonal factors (Werker et al. Reference Werker, Gilligan and Hornby1991; Bateman et al. Reference Bateman, Gutteridge, Jenkyn and Self2008). Information on how seasonal factors affect both inoculum concentrations and TAD would assist in better identifying when TAD can be expected to assist with take-all management in commercial wheat fields.
In New Zealand, winter wheat crops are usually sown in April or May. The relatively mild winters enable some plant growth to continue through winter. For example, wheat crops sown in May reach growth stages (GS) 22–26 (Zadoks et al. Reference Zadoks, Chang and Konzak1974) in August. Stem elongation (GS 30), ear emergence (GS 49) and (in some cases) the beginning of anthesis (GS 60) occur during spring (September, October, November). In summer (December, January, February) anthesis is completed (GS 69), grain development (GS 70–87) and harvest occur. Most crops are harvested in February (late summer).
Take-all is a regular feature in New Zealand wheat crops, having first been recorded in the 1919/20 growing season. This disease was regarded as being well established at that time, as it caused considerable damage to wheat crops in some areas of Canterbury in that growing season (Waters Reference Waters1920). A survey in New Zealand over three growing seasons (1999–2000) found that >0·90 of wheat or barley crops that followed a wheat crop had take-all (Cromey et al. Reference Cromey, Parkes and Fraser2006). The Canterbury Plains in New Zealand is an important wheat-growing region where wheat is grown in rotation with certified grass or vegetable seed crops, ryegrass pasture and other grain cereals. Rotations are often wheat intensive with a high proportion of first wheat crops being grown after a single break crop (Cromey et al. Reference Cromey, Parkes and Fraser2006; Bithell et al. Reference Bithell, Butler, McKay and Cromey2013). Apart from the main Ggt-susceptible cereals (wheat, barley and triticale), inoculum build-up in New Zealand also occurs in two other crops, Bromus willdenowii (prairie grass) and rye (Secale cereale) (Bithell et al. Reference Bithell, Butler, Harrow, McKay and Cromey2011). Prairie grass (a pasture seed crop) is susceptible to Ggt but infection of Ggt-resistant rye is considered to occur during senescence. Both crops can lead to post-harvest soil Ggt DNA concentrations as high as those after the Ggt-susceptible cereals (Bithell et al. Reference Bithell, Butler, Harrow, McKay and Cromey2011). Recent work has shown that Ggt infection of rye occurs after an initial delay during early growth phases (van Toor et al. Reference Van Toor, Chng, Warren, Butler and Cromey2015).
The present study compared pre-sowing soil Ggt DNA concentrations and take-all disease in consecutive wheat crop sequences across six seasons in 90 commercial cropping fields. This information was used in conjunction with disease progress studies to identify how climatic factors may result in differing soil Ggt DNA concentrations and take-all disease at different stages in consecutive wheat crop sequences.
MATERIALS AND METHODS
The present study used commercial fields in the Canterbury and Southland regions of New Zealand, where wheat forms a substantial part of the cropping sequence. When wheat is grown consecutively in a field, the crops are referred to by the year in the sequence. The first wheat crop following a non-host break crop is referred to as the first wheat, while subsequent consecutive wheat crops are referred to by their position in the sequence (Bateman et al. Reference Bateman, Gutteridge and Jenkyn2004). For example, two or three further wheat crops in the same field would be referred to, respectively, as second and third wheat.
A survey of Ggt DNA soil concentrations was carried out over seven growing seasons from 2002/03 to the 2008/09 growing seasons on 90 fields that were under take-all susceptible crops in 2003/04 (87 in wheat, one in barley and two in triticale). Take-all disease was surveyed in all wheat crops sown in these fields over six growing seasons, 2003/04–2008/09. For each field, samples of soil for analysis of Ggt DNA concentrations were collected annually prior to sowing and if the field was then sown in wheat, wheat plants were collected at early grain fill (GS 70–77). Take-all assessments at early grain fill were selected because combined incidence-severity assessments at this growth stage have been shown to provide a useful indication of grain yield losses (Gutteridge et al. Reference Gutteridge, Bateman and Todd2003). In these 90 fields, 15 wheat crops followed barley, two followed triticale, four followed rye, and one followed prairie grass. These crop types are all hosts of Ggt and examination of the soil Ggt DNA results indicated that they supported inoculum build-up in a manner similar to wheat, so they were considered as part of a ‘wheat sequence’. First wheat crops were therefore designated as those that followed a non-Ggt susceptible break.
Additional data from 2004/05 first and 2005/06 second wheat crops were used to supplement the 90-field, seven-season dataset, which had no 2004/05 first and 2005/06 second wheat, as a result of the sequence set comprising first wheat crops or first susceptible cereals (barley or triticale) in the 2003/04 season. The additional soil Ggt and take-all measurements were taken from ten first wheat crops in 2004/05 and 45 second wheats in 2005/06 that were part of a separate dataset (Bithell et al. Reference Bithell, Butler, McKay and Cromey2013). Some data from the current study for the first three growing seasons also formed part of a larger dataset, where crop sequence, rainfall and irrigation effects on take-all were examined (Bithell et al. Reference Bithell, Butler, McKay and Cromey2013).
A take-all disease progress study of 31 and 16 second wheat fields was also carried out over the 2004/05 and 2005/06 growing seasons, respectively. Samples were first collected when plants were at GS 11–13 (first–third leaf unfolded (Zadoks et al. Reference Zadoks, Chang and Konzak1974)); thereafter samples were collected on a monthly basis, with the final samples collected at GS 87–92 when seed was ripening and plants were senescing. Additional samples were also collected from another 15 second wheat fields in August (GS 13–22) of the 2005/06 growing season. Disease progress samples were also collected in the 2005/06 growing season from six fields that had been sown to wheat for 4 or more consecutive years.
Weather records from weather stations in the study region were accessed from the National Institute of Water and Atmospheric Research (Anon 2013).
Soil tests
Pre-sowing soil samples were collected from fields between late February and April each year. In New Zealand, most wheat crops are harvested in February and the next crop is sown between April and June. In each field, two soil cores (10 mm diameter, 100 mm depth) were taken at each of 25 positions, with c. 10 m between each position, along a W pattern in a ≈65 × 100 m area of the field. The sampled area was identified with a global positioning system (GPS: 10 m accuracy). Where previous crop stubble was standing, one core at each sampling position was taken between the stubble rows and one from within a stubble row (standard row spacing is 150 mm). Each field was revisited the following year. The GPS system was used to locate the sample area in each field and a post-harvest soil sample was collected in March or April as described above.
Following collection, the samples were placed in a glasshouse (c. 25 °C) for 48 h to dry between 2·4 and 4·8% moisture content. The samples were then dried further for 48 h at 40 °C prior to being placed in plastic bags and frozen at −20 °C for 2 weeks to fulfil quarantine requirements. The samples were then sent to the Root Disease Testing Service (South Australian Research and Development Institute (SARDI), Adelaide, Australia) for analysis.
The soil DNA-based method for Ggt quantification used in the present study has been described in prior work (Bithell et al. Reference Bithell, McKay, Butler, Herdina, Ophel-Keller, Hartley and Cromey2012a , Reference Bithell, Butler, McKay and Cromey2013), including specificity (Herdina et al. Reference Herdina, Harvey and Ophel-Keller1996) and polymerase chain reaction (PCR) conditions (Riley et al. Reference Riley, Wiebkin, Hartley and McKay2010). Briefly, two TaqMan® MGB (Applied Biosystems, Foster City, CA, USA) real-time PCR assays were used to quantify Ggt and Gaeumannomyces graminis var. avenae (Turner) Dennis (Gga) DNA. The Ggt assay quantifies both Ggt and Gga DNA Ct values (the number of PCR cycles when the fluorescence associated with amplified DNA crosses the defined threshold) were converted to pg DNA/g soil using a reference standard curve made of 10-fold dilutions ranging from 200 pg to 2 fg/μl of target DNA. For both assays DNA from Gga isolate 137 T was used as a reference standard. Results were supplied as DNA concentrations (pg Gga–Ggt DNA/g soil). A recent study identified that Gga was relatively uncommon in New Zealand cereal crops as it was detected at low DNA concentrations in soil from only 20 of 438 fields, in comparison with Ggt which was detected in 423 fields (Bithell et al. Reference Bithell, McKay and Cromey2012b ). The following results and discussions refer only to Ggt, although in some cases will include small quantities of Gga.
Take-all measurements in wheat crops
Samples of c. 100 plants were collected from each of the fields at the early grain fill stage (GS 70–77, December), using GPS to locate the area from which soil had been previously sampled for inoculum quantification. From the GPS point a W-shaped collection transect was sampled through the soil sample collection area. Ten wheat plants were sampled at each of ten sample points on this transect (100 plants sampled). The same method was followed each month for fields in the disease progress survey, except that five plants were collected at each sample point (50 plants sampled).
The growth stage of plants in the sample was identified using the Zadoks decimal scale. Soil was washed from the roots of plants and the roots of each plant were assessed against a white background under water. Each plant was assessed for take-all using a five-point scale based on the proportional area of the root system affected by the disease as follows: 0 = no take-all; 1 = 0·01–0·10 of the root system affected; 2 = 0·11–0·30; 3 = 0·31–0·60; 4 = 0·61–1·00. The proportion of plants in each category was used to derive a take-all index (TAI), calculated as (0a + 10b + 30c + 60d + 100e)/T, where a, b, c, d and e are the number of plants in each of the infection categories, and T = total number of plants (a + b + c + d + e) (Hornby & Beale Reference Hornby and Beale2000). The TAI has a maximum value of 100. The incidence of take-all infection was calculated as the percentage of infected plants in each sample.
Additional assessments were made for samples from fields in the disease progress survey sampled in August. At the start of each assessment, five plants were randomly selected and the numbers of seminal and nodal roots were counted. The numbers of infected seminal and nodal roots were then also counted on any take-all infected plants. For these samples the average take-all incidence of root infection per plant (% infected roots) and average take-all incidence of plant infection (% infected plants) were calculated separately for seminal, nodal and the total root systems. Pearson correlations (pairwise) were used to compare seminal infection values to log transformed pre-sowing Ggt concentrations, thermal time from sowing and August plant infection incidence.
For each year of wheat for each growing season, median pre-sowing soil Ggt DNA concentrations, take-all incidence and TAI were calculated. A similar process was followed for each month for the disease progress samples. For disease progress samples, the thermal time (°Cd) values from sowing to sampling were also calculated with accumulation initiated the day after sowing, and a 3 °C base temperature for 100 mm depth soil temperature used, following the methods of Bailey & Gilligan (Reference Bailey and Gilligan1999) for take-all disease progress. Calculations used the daily maximum and minimum hourly soil temperatures, with these data available from two meteorological measurement sites (Anon 2013), with data for each field being sourced from the nearest station.
Field management
Farmers completed questionnaires for each surveyed field, providing information on management practices and crops sown over the 4 previous years.
RESULTS
Weather conditions
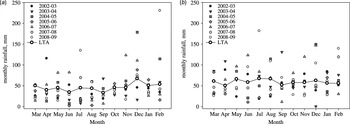
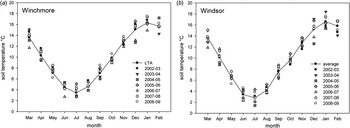
The climate of the Canterbury region, on the east coast of the South Island, is influenced by the Southern Alps mountain range lying to the west. Winds prevail from the west and lose most of their moisture when they cross the mountains, making the Canterbury plains dry compared with the west coast of the South Island. Monthly rainfall (Fig. 1) and soil temperature (Fig. 2) information is presented, respectively, for the Moanaroa and Windsor (South Canterbury) weather stations, which are close to the majority of the study fields, and representative of the study area as a whole. Average rainfall for the seven growing seasons when soil Ggt DNA concentrations were sampled over the wheat sowing to harvest periods (April–January), was 451 mm/growing season, similar to the long-term average of 433 mm/growing season. On average, the study areas receive monthly rainfall totals of 40–60 mm each month of the year. However, evapotranspiration (ET) differs markedly, with minimal ET over winter of <1 mm/day and periods in summer (December and January) when ET can exceed 3 mm/day (data not presented). This weather pattern often results in periods of high soil moisture over winter and low soil moisture (<20% moisture content) over summer. Typical field capacity values in Canterbury soils are ≈24% (McLaren & Cameron Reference McLaren and Cameron1994).
Monthly rainfall totals and long-term average (LTA, 1981–2010) for (a) the Moanaroa (South Canterbury) weather station and (b) the Winchmore (mid Canterbury) station, presented for the period of wheat-growing seasons (March–February) for seven growing seasons (from 2002/03 to 2008/09).

Monthly average soil temperature (100 mm depth) for (a) the Winchmore weather station (mid Canterbury) and (b) at the Windsor (South Canterbury) weather station, for the period of wheat-growing seasons (March–February) for seven growing seasons (from 2002/03 to 2008/09) and long-term averages (LTA, 1981–2010). LTA values were not available for Windsor and line plots are 9 year averages.

Over-winter (June–August) rainfall was lowest in the 2005/06 season and highest in the 2008/09 season. Three growing seasons (2004/05, 2005/06 and 2006/07) had higher than average December rainfall (Fig. 1). The 2006/07 growing season was unusually wet and the 2004/05 growing season also had high rainfall in August. The other four growing seasons were relatively dry, with the exception of 2007/08 when high rainfall occurred in July and at the end of the growing season in February 2008.
Average monthly soil temperatures range from between 3 and 4 °C in winter to approximately 16 °C in the middle of summer (Fig. 2). Winter, spring and summer average monthly soil temperatures were lower than long-term averages (8·8 °C Windsor, 9·0 °C Winchmore) for the 2004/05 season (8·3 °C Windsor, 8·7 °C Winchmore), but for the following 2005/06 season temperatures for most months (July–December) from late winter to early summer were warmer (9·6 °C Windsor, 9·9 °C Winchmore) than other seasons (ranges 8·0–9·6 °C Windsor, 7·9–9·2 °C Winchmore).
Inoculum and disease during host crop sequence
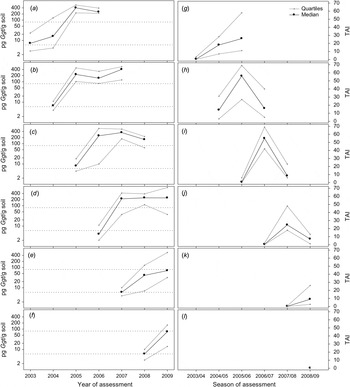
There were some general trends across the cropping sequences (Fig. 3). Median Ggt DNA concentrations prior to the first wheat were low following break crops (range 4·0–7·9 pg DNA/g soil), as was the median TAI for first wheat crops; the median post-harvest Ggt DNA concentrations of the first wheat was higher than at pre-planting; the median TAI and post-harvest Ggt DNA concentrations of the second wheat crops were high; and the median post-harvest Ggt DNA concentrations remained high. Within these generalizations, however, there were large differences in median post-harvest soil Ggt DNA concentrations and median TAI values among Ggt susceptible crop sequences initiated in different growing seasons (Fig. 3).
Median and quartile Gaeumannomyces graminis var. tritici (Ggt) DNA concentration (a–f) and take-all index (TAI) (g–l) values for sequences of first to third or higher consecutive wheat crops, each commencing in a different season (g–l). The Ggt DNA concentration data points start after the break crop prior to sowing the first wheat, then followed by the post-harvest values after first, second and third or higher consecutive wheat crops. Dotted lines in Ggt graphs (a–f) separate low, medium and high take-all risk categories.

Sequences initiated as first wheat in the 2003/04, 2007/08 and 2008/09 growing seasons had low to intermediate post-harvest soil Ggt DNA concentrations (16, 42 and 74 pg DNA/g soil, respectively) (Fig. 3(a), ( d ) and ( e )). However, sequences initiated in 2004/05, 2005/06 and 2006/07 had high post-harvest soil Ggt DNA concentrations (229, 247 and 219 pg DNA/g soil, respectively) (Fig. 3(b)–( d )). For all sequences, first wheat had low median TAIs (range 0·2–0·7), except for first wheat in the 2004/05 growing season, which had a high median TAI of 14 (Fig. 3(h)).
There was further among-season variation in Ggt DNA concentration and TAI in the second, third and later stage wheat for these sequences. For both cropping sequences initiated as first wheat in the 2004/05 and 2005/06 growing seasons, the second wheat in 2005/06 and 2006/07 had very high median TAIs (56·3 and 55·1, respectively, compared with a range of 8·9–24·6 in other seasons) but also differing post-harvest soil Ggt DNA concentrations (150 and 354 pg DNA/g soil, respectively) (Fig. 3(b), ( c ), ( h ) and ( i )). In comparison, the sequence initiated as first wheat in 2006/07, which also had high first wheat post-harvest soil Ggt DNA concentrations (219 pg DNA/g soil), had intermediate TAIs (median of 24·6) but high post-harvest soil Ggt DNA concentrations (244 pg DNA/g soil) at the second wheat stage (Fig. 3(d ) and ( j )). The TAIs of second wheat in 2003/04 and 2006/07 were similar (18·4 and 24·6, respectively), despite the differing first wheat post-harvest soil Ggt DNA concentrations (15·8 and 219 pg DNA/g soil, respectively) from these two sequences (Fig. 3(a), ( g ), ( d ) and ( j )). The sequence initiated as first wheat in 2007/08 had the lowest median TAI of all second wheat crops (TAI 8·9 in 2008/09), despite having higher pre-sowing soil Ggt DNA concentrations than second wheat in 2003/04 (74·2 and 15·8 pg DNA/g soil, respectively) (Fig. 3(a), ( e ) and ( k )).
Median TAIs in later stage wheat crops (third and later) were lower than for second wheat in each growing season (Fig. 3). Median TAIs were also usually lower in later stage wheat crops than in the preceding second wheat (Fig. 3). In particular, in 2006/07 and 2007/08 (Fig 3(h) and ( i )), the TAI in later stage wheat crops was only about 20% that of second wheat the previous year. Conversely, a low median TAI in second wheat in 2004/05 was followed by a relatively high TAI in third or later wheat in 2005/06. Eight fields in the study were sown as second wheat in 2006/07 and then as third wheat in 2007/08, with median TAIs of 62 and 11, respectively, for the two growing seasons. This compares with a median TAI of second wheat in 2007/08 of 24. The post-harvest soil Ggt DNA concentrations of longer term wheat in these sequences were all relatively high, with some evidence for a plateau in DNA concentrations being reached following the second wheat crop in the sequence.
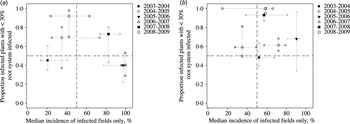
A comparison of the take-all epidemics among growing seasons was made by comparing severity categories with incidence for second and later (third and higher) wheat (Fig. 4). For second wheat crops, the 2004/05 and 2008/09 growing seasons were characterized by low root area infection and low take-all incidence. In contrast, 2007/08 had low root area infection and high incidence while 2005/06 and 2006/07 had high root area infection and high take-all incidence (Fig. 4(a)). Later stage wheat crops were generally characterized by low root area infection and high disease incidence, except for 2006/07, which had both low root area infection and low take-all incidence, and 2003/04, which could not be clearly grouped into any root area-disease incidence quadrate (Fig. 4(b)).
Median and quartile take-all incidence of (a) second and (b) third+ wheat crops plotted against the median and quartile proportion of infected plants with <30% of the root system infected, across infected plants only, for six seasons. Dashed lines at 50% incidence and proportion of 0·5, used to classify data into different root area infection-take-all incidence quadrates.

Disease progress and early infection of crops
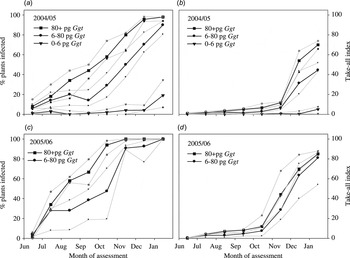
Disease progression results for second wheat fields in two growing seasons with a range of pre-sowing soil Ggt DNA concentrations were used to further investigate aspects of annual epidemics. There were marked differences in the progress of take-all incidence in the 2004/05 growing season between the three pre-sowing soil Ggt categories (Bithell et al. Reference Bithell, McKay, Butler, Herdina, Ophel-Keller, Hartley and Cromey2012a ) (Fig. 5(a)). In the 0–6 pg/g soil category, median incidence remained below 10% until the final January assessment. Conversely, disease incidence in the 80+ pg/g soil category increased steadily, from c. 10% in June to nearly 100% in January. The pattern in the 6–80 pg/g soil category was intermediate, with little increase during the winter months, followed by a steady increase until January, when incidence was only slightly lower than that in soils of the 80+ pg/g category. Median disease incidence in the 2005/06 growing season increased steadily in both the 6–80 and 80+ pg/g soil categories, although incidence in the 80+ pg/g soil category was higher than that for the 6–80 pg/g soil category until the final assessment. At that time, disease incidence was close to 100% in both categories (Fig. 5(c)). There was only a single 0–6 pg/g soil category field in the 2005/06 growing season, so no disease progress curve is presented for this category. The TAI was 5 or lower in this crop until the January (late grain fill) assessment.
Take-all disease progression for median, upper and lower quartile take-all incidence (a and c) and take-all index (b and d), at monthly assessments in second wheat crops, 2004/05 (0–6 pg Gaeumannomyces graminis var. tritici (Ggt) DNA/g soil eight fields, 6–80 pg 14 fields, >80 pg, nine fields) 2005/06 (6–80 pg six fields, >80 pg, nine fields). Data for a single 0–6 pg field in 2005/06 are not presented.

Median TAI increased only very gradually in all Ggt soil categories in the 2004/05 growing season until the December assessment, which showed markedly higher TAI in the 6–80 and 80+ pg/g soil categories (Fig. 5(b)). Further increases were recorded in the January assessment in the 6–80 and 80+ pg/g soil categories. Take-all incidence remained low in the 0–6 pg/g soil category, although the January assessment showed small increases. For the 2005/06 growing season, median TAI increased slowly in both Ggt categories until the November assessment (Fig. 5(d)). There was a consistent sharp increase in TAI for both soil categories between late October and January, although this increase commenced a month earlier in 2005/06 than in the 2004/05 growing season.
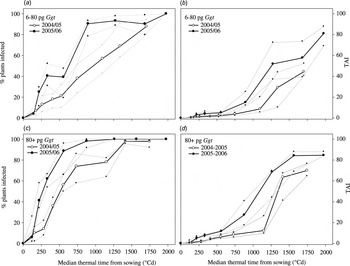
Disease progress was also plotted in relation to soil temperature thermal time to enable a comparison between the two growing seasons (Fig. 6). There was greater thermal time accumulation over the assessment period in 2005/06 than in 2004/05; overall 2005/06 was a warmer growing season. Disease incidence for the 6–80 pg/g soil category fields increased more rapidly in 2005/06 than in 2004/05, but progression was irregular for the 250–500 °Cd period in 2005/06 (Fig. 6(a)). For both growing seasons, for fields in the 80+ pg/g soil category there was a short lag phase followed by rapid increases in TAI (Fig. 6(c)). The 2004/05 median incidence reached that of 2005/06 after ~1400 °Cd.
Take-all disease progression for median, upper and lower quartile take-all incidence (a and c) and take-all index (TAI) (b and d) over thermal time (°Cd) from sowing in second wheat crops, 2004/05 (0–6 pg Gaeumannomyces graminis var. tritici (Ggt) DNA/g soil eight fields, 6–80 pg 14 fields, >80 pg, nine fields) 2005/06 (6–80 pg six fields, >80 pg, nine fields).

The progression of TAI on a thermal time basis for fields in both the 6–80 and 80+ pg/g soil categories had a clear lag phase followed by a linear phase after ~1100 °Cd for the 2004/05 growing season and after c. 600 °Cd for the 2005/06 growing season (Fig. 6(c) and ( d )). The TAI progression of 80+ pg/g soil category fields, but not the 6–80 pg/g category fields, then plateaued after ~1400 °Cd near the end of each growing season. There was no evidence in either season for plateaus in TAI progression for the 6–80 pg/g soil category.
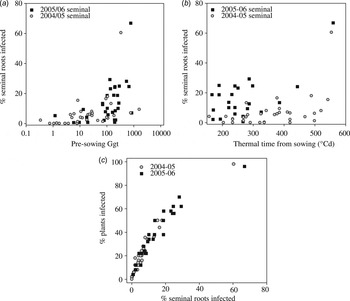
Median seminal root numbers across fields in August 2004/05 and 2005/06 were 6·2 and 4·8 per plant. There was a high incidence (20–30%) of August seminal root infection for a group of 2005/06 high inoculum fields. The incidence of seminal root infection exceeded 20% in only two 2004/05 fields in August (Fig. 7(a)). There was minimal nodal root infection in August; only eight 2004/05 crops (average nodal root incidence, 0·8%) and four 2005/06 crops (average nodal root incidence 4·6%) had nodal infection (data not presented).
Average August seminal root incidences of take all infection for second wheat fields in the 2004/05 (n = 35) and 2005/06 (n = 31) seasons, plotted against (a) pre-sowing Gaeumannomyces graminis var. tritici (Ggt) soil DNA concentrations (pg Ggt DNA/g soil) values, (b) thermal time from sowing at August sampling and (c) average take-all incidence at August sampling.

Seminal root infection was greatest where pre-sowing Ggt DNA concentrations were highest (2004/05 r = 0·470, 2005/06 r = 0·503), especially for the 2005/06 growing season (Fig. 7(a)), primary infection was also positively related to the thermal time value from sowing (2004/05 r = 0·462, 2005/06 r = 0·635) (Fig. 7(b)). The August seminal root infection was clearly related to TAI (2004/05 r = 0·932, 2005/06 r = 0·927) (Fig. 7(c)). In general, the proportions of seminal roots infected were equal to half the proportions of plants infected.
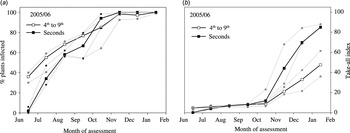
Progress of TAI was similar between second and later stage wheat crops (4th–9th) from August onwards (Fig. 8(a)). Initially, TAI progression was similar in second and long-term wheat crops, but from late spring (October) onwards the increase in TAI was more rapid in second than in later stage wheat crops. This resulted in a much higher mean TAI during grain fill (GS 70–87) and ripening (GS 90–93) in December and January (Fig. 8(b)).
Take-all disease progression for median, upper and lower quartile (a) take-all incidence, and (b) take-all index at monthly assessments for consecutive wheat (two-fourth wheat, one-fifth wheat, two-sixth wheat and one-ninth wheat) and nine second wheat in the 2005/06 season. All fields had pre-sowing soil Gaeumannomyces graminis var. tritici (Ggt) DNA concentrations >80 pg.

DISCUSSION
While the general pattern of inoculum and disease increase with host cropping and between crops was similar to that reported previously across a range of environments (Polley & Thomas Reference Polley and Thomas1991; Paulitz et al. Reference Paulitz, Schroeder and Schillinger2010), there were important exceptions among wheat crop sequences that commenced in the different years. It is likely that differences in weather conditions between the six growing seasons were responsible for most of these exceptions: a markedly higher TAI in first wheat crops in the 2004/05 growing season than in any other growing season; variation in inoculum increase in first wheat crops between years; and particularly high disease severity in second wheat crops in 2005/06 and 2006/07.
The current study allowed additional comparisons to be made, as the soil Ggt DNA concentrations allowed the identification of cropping sequences where there were differences in take-all among common years of wheat when pre-sowing Ggt DNA concentrations were similar and where post-harvest Ggt DNA values differed despite similar take-all values. It was found that epidemics with differing characteristics could be related to environmental effects on disease and inoculum in the prior crops and during the current crop. In previous field trials comparing sequences of consecutive wheat crops initiated in different growing seasons, differences have been found in TAI or severity for the same year of wheat (e.g. second wheat) among sequences (Werker & Gilligan Reference Werker and Gilligan1990; Werker et al. Reference Werker, Gilligan and Hornby1991; Bateman & Hornby Reference Bateman and Hornby1999; Bateman et al. Reference Bateman, Gutteridge and Jenkyn2004, Reference Bateman, Gutteridge, Jenkyn and Self2008; Pillinger et al. Reference Pillinger, Paveley, Foulkes and Spink2005). Environmental factors such as differences in rainfall or soil temperatures between growing seasons have been proposed to contribute to these differences among sequences (Werker & Gilligan Reference Werker and Gilligan1990; Werker et al. Reference Werker, Gilligan and Hornby1991; Bateman & Hornby Reference Bateman and Hornby1999; Bateman et al. Reference Bateman, Gutteridge and Jenkyn2004; Pillinger et al. Reference Pillinger, Paveley, Foulkes and Spink2005).
Increases in Ggt inoculum during the first year of wheat have important consequences for epidemics in later years. The amounts of spring and early summer rainfall were important for Ggt inoculum build-up in first wheat. Determining what environmental factors contribute to inoculum build-up in first wheat has previously proved difficult (Werker et al. Reference Werker, Gilligan and Hornby1991; Hornby Reference Hornby1998). The growing seasons of 2004/05, 2005/06 and 2006/07, where median post-harvest Ggt DNA concentrations ranged from 219 to 247 pg Ggt DNA/g soil, and where large Ggt build-up occurred in first wheat, all had above long-term average rainfall in early summer (December). High rainfall that occurred in late spring in these growing seasons may also have contributed to inoculum build-up in the first wheat crops. The contribution of late spring rainfall was shown in the 2008/09 growing season, when there was only moderate Ggt build-up following slightly higher than long-term average rainfall in December, but below average rainfall in both October and November. In the seasons when there was generally low rainfall over the spring to summer periods, there was a low inoculum build-up in first wheat crops. The current study showed that low spring–summer rainfall may limit take-all epidemics and the resulting build-up of Ggt inoculum in first wheat.
The role of environmental or management factors contributing to take-all epidemics in particular years of wheat has been examined previously (Werker & Gilligan Reference Werker and Gilligan1990; Werker et al. Reference Werker, Gilligan and Hornby1991; Pillinger et al. Reference Pillinger, Paveley, Foulkes and Spink2005). However, the relationship between the seasonal climate experienced during the first wheat crop on take-all including quantification of resulting inoculum and ongoing influences on take-all epidemics and inoculum build-up in wheat crops later in the sequence has not been previously examined. The current research programme showed that weather influences on disease and inoculum in 1 year of wheat within a sequence can also influence epidemics in later years, a result that has not been previously demonstrated simultaneously across different years of wheat and across a region. This was particularly so for the first wheat crops, for which all the three growing seasons had a low inoculum build-up. In contrast, inoculum build-up was high in the first wheat of other sequences. The inoculum arising from the first wheat (as influenced by weather patterns during that crop) determines the amount of primary inoculum for the subsequent second wheat, and so influences the severity of take-all in that second wheat.
The pattern of take-all epidemics over the course of a wheat cropping sequence was influenced by the year in which the sequence started. For example, in a study of consecutive wheat sequences in England that was initiated in different growing seasons at one site, a pattern of a slowly developing increase in take-all peaked in the third wheat, while a faster developing disease pattern had high take-all in second wheat and even higher take-all in the third wheat (Bateman et al. Reference Bateman, Gutteridge, Jenkyn and Self2008). It was found that differing combinations of seasonal conditions during first wheat crops in a sequence, and the conditions experienced by the current crop, provided an explanation of the severity of take-all at grain fill and the resulting post-harvest soil Ggt DNA concentrations in second wheat crops. A sequence in which the second wheat had low pre-sowing soil Ggt DNA concentrations (2004/05 growing season) and a high December rainfall preceded by average rainfall and cool soil temperatures resulted in a moderate epidemic and a late build-up of inoculum. However, second wheat crops that had high pre-sowing soil Ggt DNA concentrations (2005/06 and 2006/07 seasons) and non-limiting seasonal rainfall had both severe take-all and moderate to high inoculum build-up. In a study of second wheat by Werker & Gilligan (Reference Werker and Gilligan1990), the wettest season had the highest take-all incidence, while in another season a dry period during the maximum root growth period was considered to have restricted the development of the epidemic. The Werker & Gilligan (Reference Werker and Gilligan1990) study supported the current findings for the importance of seasonal rainfall to the severity of take-all epidemics. However, the present study was able to extend on these conclusions by incorporating seasonal effects on the extent of inoculum build-up in the prior and current wheat crops.
Weather conditions during the first wheat determine the inoculum for the second wheat, but weather conditions also regulate the take-all epidemic during the second wheat. The current studies results showed that low spring and early summer rainfall slows epidemic development in second wheat crops, even where there have been high pre-sowing soil Ggt DNA concentrations. In the present study, the 2007/08 growing season had below long-term average rainfall in 3 of the 4 months from spring to early summer and the TAI, proportion of severely infected plants and moderate post-harvest inoculum concentrations showed that the epidemic had failed to develop strongly, but despite the moderate epidemic take-all incidence was high (82%). The incidence results for 2007/08 indicate that the epidemic may have started similarly to other sequences which also had high pre-sowing Ggt DNA concentrations in second wheat crops (2005/06 and 2006/07), but drier than average periods from September to December restricted lesion development and hence severity despite high plant infection incidences. The current study's conclusions for the importance of periods of below average rainfall in some months for take-all epidemic outcomes are supported by other studies (Werker & Gilligan Reference Werker and Gilligan1990; Pillinger et al. Reference Pillinger, Paveley, Foulkes and Spink2005). Finally, the combination of low pre-sowing soil Ggt DNA concentrations and slightly less rain than usual over the September–November period in the 2008/09 growing season provided a weak epidemic and the lowest second wheat post-harvest inoculum concentrations of the six seasons in the study.
Preceding growing seasons influenced the pre-sowing Ggt DNA concentrations of second wheat crops. It was found, for a field and growing season basis, that high pre-sowing Ggt DNA concentrations were associated with a high incidence of seminal root infection. Seasonal troughs in the amount of viable inoculum in spring implicate a reliance by the subsequent epidemic on how successfully infections can spread from the primary infections that occurred during the period from late autumn to early spring (Hornby Reference Hornby, Asher and Shipton1981; Bailey & Gilligan Reference Bailey and Gilligan1999). The current results for second wheat fields sampled prior to 600 °Cd (spring, August, c. 6 months since harvest of the first wheat crop) showed that seminal root infection could range from 20 to 30%, with higher proportions also observed in some high inoculum fields. A wheat infection model of multi-season crop rotation experiments at Rothamsted (UK) showed that second wheat had a maximum seminal root infection value of ≈15% from 600 to 1000 °Cd (T b 3 °C) after sowing (Bailey & Gilligan Reference Bailey and Gilligan1999). Higher (>20%) seminal root infection values for the commercial New Zealand second wheat fields were recorded in high inoculum fields (>80 pg). The New Zealand wheat crops had total seminal root numbers similar to those of the Rothamsted crops. The differences in seminal root infection incidence may have been the result of higher concentrations of inoculum in some New Zealand fields than the inoculum concentrations at Rothamsted. It was also clear that the effects of seasonal conditions in the growing season of first wheat had flowed through to second wheat fields, as fields from the preceding 2003/04 season had overall lower post-harvest Ggt DNA concentrations than fields from the 2004/05 growing season. The subsequent second wheat in 2004/05 had an overall lower seminal root infection than fields in the subsequent season.
Differences in inoculum distribution over a consecutive wheat crop sequence affect the frequency of primary and secondary infection. Due to more evenly distributed inoculum in long-term consecutive wheat (≥3 years) crops, primary infection is considered to contribute to higher proportions of plant incidence than secondary infection (Hornby et al. Reference Hornby, Bateman, Gutteridge, Ward, Yarham and Hornby1998). Conversely, in second wheat where take-all is usually spatially aggregated (Gosme et al. Reference Gosme, Willocquet and Lucas2007), secondary infection via nodal roots is regarded as important because it allows take-all to spread to plants in areas of the crop where Ggt inoculum is not present (Werker et al. Reference Werker, Gilligan and Hornby1991; Hornby Reference Hornby1998; Bailey & Gilligan Reference Bailey and Gilligan1999). However, the current results for two seasons when a large build-up of inoculum occurred in the preceding seasons’ first wheat crops showed that relatively high early-season (August) incidence can occur in second wheat crops prior to substantial nodal root infection occurring. These results indicated that primary infection alone in second wheat crops can lead to high take-all plant incidence when environmental conditions lead to a substantial Ggt build-up in the preceding first wheat. A substantial contribution of primary infection to overall TAI (especially in medium to high inoculum fields) in second wheat can only occur if there is a relatively even dispersal of pre-sowing inoculum established in the first wheat. A relatively even distribution of inoculum in first wheat may have resulted from substantial secondary infection from aggregated primary infection point sources and/or from management practices (e.g. cultivation; Prew Reference Prew1980) that distribute inoculum.
The importance of the environmental conditions experienced during a particular growing season is further illustrated by differences between growing seasons in progress of TAI for fields in the same pre-sowing soil Ggt take-all risk categories. In the current study, fields with medium and high pre-sowing soil Ggt DNA concentrations had TAI that diverged after the first quarter (c. 500 °Cd) of the two growing seasons through to their end. In contrast, although mid-season disease incidences differed in the 2004/05 and 2005/06 growing seasons, they were very similar by the end of the seasons. Although large differences between growing seasons in the progress of take-all epidemics in second wheat have been found in other studies (Werker & Gilligan Reference Werker and Gilligan1990; Werker et al. Reference Werker, Gilligan and Hornby1991), those studies did not measure inoculum concentrations and so could not determine how seasonal factors affected inoculum and disease. However, by grouping sites by pre-sowing inoculum concentrations based on take-all risk categories to examine disease progress, it was shown that for both pre-sowing soil Ggt DNA take-all risk categories, the season that had the highest mid-season incidence values then had the highest end of season TAI values.
Two growing seasons had contrasting take-all epidemics in first and second wheat. The median TAI in 2004/05 was unusually high in first wheat and unusually low in second wheat, while in 2005/06 TAI was low (as usual) in first wheat and unusually high in second wheat. Data were further examined to determine whether the low TAI in second wheat in 2004/05 could be explained simply by the low median pre-sowing inoculum concentrations in second wheat in that growing season. The disease progress results with groupings of take-all ‘risk’ categories enabled this hypothesis to be examined. Irrespective of Ggt category, take-all severity was greater in 2005/06 than 2004/05 at both the December and January assessments, indicating that the difference between growing seasons was not solely related to pre-sowing inoculum. It was also shown that month based seasonal differences also remained for soil temperature-based thermal time comparisons where at equivalent thermal time units after c. 500 °Cd disease progression was greater for the 2005/06 than 2004/05 season.
Two key factors affect an epidemic: the amount of inoculum remaining when host roots are present and the subsequent favourability of environmental conditions to disease progression. Soil moisture and temperature affect the rate of Ggt inoculum breakdown as measured by host infection, with the most rapid decline in moist, warm soil (Wong Reference Wong1984). In association with high rainfall in the 2004/05 season over the period from crop ripening to harvest (February) followed by below average early winter rainfall, proportional declines of close to 0·7 of soil post-harvest Ggt DNA concentrations in New Zealand second wheat fields occurred from April to July (pre-sowing-early 2005/06 season period) (Bithell et al. Reference Bithell, McLachlan, Hide, McKay and Cromey2009). These findings indicated that greater take-all severity in the 2005/06 than 2004/05 season may have occurred despite substantial inoculum breakdown in the pre-sowing and early crop establishment phase of the 2005/06 season. There was no inoculum breakdown data for other seasons, but similar residue and so inoculum breakdown rates were expected when soil moisture conditions were non-limiting (Hornby Reference Hornby, Asher and Shipton1981; Quemada Reference Quemada2004). The 2005/06 season did have a dry winter (June–August) while the 2004/05 season had a typically wet winter. As the pre-sowing and early crop establishment phase (March–May) of the 2004/05 season was no drier than 2005/06 season until June, it was concluded that in-crop environmental conditions favoured early disease progression during the 2005/06 season (the warmer season). Furthermore, inoculum persistence over this winter period may have also been enhanced by drier than usual soil moisture conditions in the 2005/06 than 2004/05 season and so contributed to greater primary infection relative to pre-sowing soil Ggt concentrations as shown for seminal root infection incidence in a number of fields.
The authors thank the farmers who gave access to their fields and field management information for this study, and also thank Ina Dumitrescu, Russell Burns and Aidan Thomson at SARDI for processing soil samples for DNA analyses. The research was funded by the New Zealand Ministry of Research Innovation and Employment contract (LINX0804), the New Zealand Foundation for Arable Research and the Ministry for Primary Industries Sustainable Farming Fund.