

INTRODUCTION
Brooches are one of the most commonly encountered metal small finds in Roman Britain; considerable amounts of time have been devoted to their study over many years. The numbers now being found are annually increased by those recorded by the Portable Antiquities Scheme (PAS), with over 18,000 recorded in the decade since 2003.Footnote 1 Yet despite all of this, it could be argued that they are a much under-used resource.
What do brooches tell us about the people of Roman Britain? At a very fundamental level, they are reflecting differences in costume. People in areas where brooch use was high were undoubtedly wearing different fashions than those in areas where it was low or non-existent. Some forms clearly have very restricted distributions. This should all be basic data for anyone wishing to explore issues of identity and regionality in the province and, indeed, attempts have been made to do this.Footnote 2
To exploit the information they contain fully, basic information about where and when the different types occur needs to be in place. Broad patterns of use have long been apparent, such as the rise in popularity of brooches starting in the first century b.c.,Footnote 3 their apparent abandonment by many parts of the population in the later second century and the use of the crossbow brooch as a mark of authority in the fourth.Footnote 4 Our knowledge, though, is on an almost anecdotal level.
The publication in 2011 of Don Mackreth's magisterial, but occasionally somewhat daunting,Footnote 5 corpus Brooches in Late Iron Age and Roman Britain now enables us to explore such patterns in a more rigorous and quantified manner. It also reveals other patterns which may not have been so clearly demonstrated before. The focus of this paper is on the temporal and regional patterns apparent as these need to be established before more nuanced work, on issues of identity and the like, can be carried out. Our analyses, based on Mackreth's corpus, confront a much larger body of material than is customarily studied, using novel methods of interrogating the data. Our results both confirm and challenge ‘received wisdoms’ as well as providing new insights into regional patterns of brooch use in Britannia. To achieve this the often neglected area of how long objects remained in use has had to be addressed. We also draw attention to problems that arise when interpreting material containing a high proportion of metal-detected artefacts.
TYPOLOGIES AND DATA SELECTION
For any class of find to be useful there has to be a sound underlying typological foundation which allows material both to be assigned to a type and for that type to be dated. For many years despite the considerable amounts of specialist literature, brooches have lacked this foundation. The first typology was Collingwood's which provided at best a series of categories into which brooches could be fitted.Footnote 6 Rex Hull, who was the principal brooch specialist of the middle years of the twentieth century, worked on a corpus. This has never been published in full,Footnote 7 though the late Grace Simpson and now Nina Crummy continue to work to bring it to publishable form.Footnote 8 The basic outline of the Hull typology has been available for some decades as Richard Hattatt made reference to it in the four volumes in which he published his collection.Footnote 9 A more systematic presentation of it was given in the volume on the brooches from Richborough.Footnote 10 At present, though the Hull types can be used as an organising principle, systematic information on chronology and distribution is lacking.
The Mackreth corpus has completely changed the situation as it provides not only a very detailed typology and all known contextual dates for each sub-type, but also the full listing of the more than 15,000 brooches in his records in a digital form. The latter contain the results of both a thorough literature search and the unpublished material in many museums, including, for example, the major urban centres of Cirencester, Silchester and Leicester. As he was the leading brooch specialist of the later twentieth century and the person to whom the archaeological community sent their brooches as a matter of course from the 1970s, it also contains the large body of material for which he provided specialist reports. This includes both published reports and major unpublished groups. In addition, it contains material from the early days of metal-detecting as he provided help to the pioneering efforts of the Norwich Museum to record the finds which were being recovered. It contains very little formal PAS data as he closed the corpus in 2004, i.e. at about the time that scheme was becoming fully established.
The nature of the data set means that it is much more representative of brooch wearing in the province as a whole compared with the PAS data which has started to be exploited to explore such questions as regionality.Footnote 11 The latter of course is restricted to rural sites, where either the landowner or the state allows access,Footnote 12 and various authors have drawn attention to the fact that to fully exploit the information brooches can give us, it is necessary to look at their social distribution across different site types.Footnote 13 The fact that there is a large body of metal-detected material in the corpus allows a systematic exploration of the biases that material collected in this way can show. This is important, as such material is increasingly used to inform our picture of Roman BritainFootnote 14 and any biases need to be taken into account.
As the main areas to be explored here are variations in use through time and space within the province, only a subset of the full corpus has been used. All the brooches come from the English and Welsh mainland and are ones where a findspot was given and could be identified. This reduced the possible corpus to 13,509 brooches from a total of 1,265 sites. The Mackreth typology is a hierarchical one, dividing the brooches first into 59 basic families. It then sub-divides the families, on various criteria as appropriate to each, into basic types and then these are divided into sub-types which in some cases themselves have sub-types. Some of the lowest levels of sub-types can have very few or, in some cases, no members. The latter were included only as possibilities as Mackreth felt logically they might exist.Footnote 15 All of the types and their sub-divisions were inspected to decide whether it was appropriate to consider them at type, sub-type or sub-sub-type level. Sub-divisions which contained only a small number of items were ignored, as were those brooches left outside the typology.Footnote 16 In total 230 Type or Sub-type divisions were considered usable and these will be called Groups here to distinguish them from the Mackreth nomenclature. The concordance between the Mackreth Types and the Groups is available as Table S1 in the online Supplementary Material: Section 1.
Following all these exclusions the total number of brooches available for analysis was 11,569. Within archaeology, this is a big data set, though, as BevanFootnote 17 has pointed out, big in archaeological terms is not at the scale that is meant by ‘big data’ in other disciplines. It is certainly at a scale that needs a range of statistical techniques to explore it and that has governed the approaches we have taken here. It provides a body of data which can be modelled to see if prior assumptions about a much-studied group of material are tenable. Modelling archaeological data is now commonplace when radiocarbon dates are explored via Bayesian statistics.Footnote 18 Our approach demonstrates the potential a data set such as this has to explore those prior beliefs and generate new ones. Though not a Bayesian analysis in the sense that we do not use the data to convert prior beliefs into posterior beliefs, it partakes of something of the same spirit. More specifically, our methodology allows different and possibly competing views about patterns of brooch loss and their typical use-life to be explored rapidly, in order to see if archaeological conclusions are sensitive to the assumptions embodied in such views.
DATING THE GROUPS
Although brooches are often valued because they are perceived as being datable, it is not always easy to date them. Dates tend to be assigned on a period level such as Claudio-Neronian, Antonine etc., and attention focuses on when they first start to appear in the archaeological record. Like all artefacts though, brooches can have lives which extend beyond the period of their first appearance. Some appear to have had truly remarkable biographies. The first-century a.d. brooches found being worn by two women in later fifth- or sixth-century graves at Lechlade are one example,Footnote 19 but even more remarkable is the enamelled trumpet brooch found in a wearable condition next to the shoulder of someone found buried in a grave which can be no earlier than the eleventh century in Leicester.Footnote 20 The concept that artefacts can have biographies and are not simply commodities with little meaning to the user, is one which is frequently considered in the archaeological literature, with Kopytoff's influential paper often being cited.Footnote 21 Biographical approaches are frequently called upon to explain apparent heirlooms in graves,Footnote 22 but formal consideration of how long a use-life an artefact or type might have had when found in other types of archaeological context is rare. Setting aside exceptional occurrences such as the brooches from Lechlade and Leicester, here it is necessary to consider what the use-life of a Group might have been.
The approach taken was first to inspect the dated contexts of each Group and to identify the first relatively narrow one, i.e. if the first date range given was a.d. 50–150 and the second a.d. 60–70, the second date was used. The mid-point of the range, in that case a.d. 65, was taken as the notional starting point of when that Group started to be lost. This enabled all of the Groups to be put in a chronological sequence. In the case of continental imports, the relevant continental literature was inspected to check that the dates from the British contexts were accurately reflecting the start dates, or to provide such dates where British ones were lacking.Footnote 23 The Aucissa family posed a special problem. This is a continental form which developed in the Augustan periodFootnote 24 but which arrived in Britain with the army in a.d. 43, not having been much imported before. A start date of a.d. 1 was therefore used, rather than a Claudian one which would be appropriate if only the British evidence was considered. The Hod Hill family, which was the other major continental import that arrived with the army, posed less of a problem. It was developing in the late Tiberian/Claudian period and frequently the first British dated contexts are some of the earliest known for the variants.Footnote 25
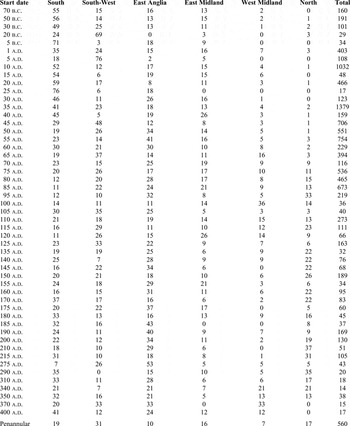
It proved impossible to provide realistic start dates for a sub-set of the Groups and these were excluded from the analysis. Penannular brooches posed another problem. Some of the penannular Groups appeared to have use-lives similar to other brooch types, but others appeared to have very long use-lives or ones which were apparently bimodal over several centuries. They frequently appear in the late Iron Age to early Roman period, while examples of the same types are also found in late Roman contexts and in Anglo-Saxon cemeteries. The more readily dated penannular brooches amounted to approximately one-third of the penannular brooches in the corpus and were included in the main analyses. The remaining ones, referred to in what follows as the undated penannulars, consisted of 560 brooches. These have been excluded from the main analyses but are explored as special cases as will be noted below. The final basic data used consisted of 10,921 brooches with 51 different start dates which are shown in Table 1 as row percentages with the totals allowing the original counts to be reconstructed. The table of raw counts is available as Table S3 in the online Supplementary Material: Section 2, which also includes the data arranged by Group as Table S2.
THE BROOCH DATA BY REGION AND START DATE
(The final row is the penannular brooch groups which have long use-lives (see text for discussion). The data are Row percentages which may not sum to 100 per cent due to rounding. The final column provides the total count. The raw data are available in the online Supplementary Information (Table S3).)

Converting first known dates of deposition to a single date as has been done is open to many objections but, as will be described below, analyses were carried out varying the assumptions about start dates and no fundamental differences were found in the results. So dealing with the dating in this way appears to be a useful approach.
Having established a notional start date of loss, the question of how long a Group might have remained in use needs to be considered. Were brooch types something that could be expected to have relatively short lives? Mackreth often writes as if his types cannot be expected to have lives of more than 50 years,Footnote 26 but it is not difficult to find evidence at both the type and individual brooch level to suggest this may not have been the case, even if brooches with extraordinary biographies such as those from Leicester and Lechlade are ignored. As already noted the Aucissa family first appears in the Augustan period but was still the commonest brooch type found in the eruption levels at Pompeii,Footnote 27 indicating that they were still being regularly worn 80 to 90 years after the family originated. At the individual brooch level examples of complete brooches found in contexts where residuality is not to be expected, can be considered. A good example of such a context is the fortress baths drain deposit at Caerleon where the assemblage of finds shows clear evidence of items being lost and discarded by people using the baths. The upper drain deposit, which was accumulating between a.d. 160 and 230, contains a virtually complete brooch with broken pin belonging to Mackreth's Trumpet 1.3b.Footnote 28 The earliest known example is one from the first fort at Castleford in a context dated a.d. 71/3–86, which indicates this type could have had a use-life of between 70 and 160 years depending on which end of the ranges are chosen. At Brougham a brooch of Mackreth's type Proto Crossbow 1c was placed on the pyre of an individual who must have died between a.d. 240 and 270.Footnote 29 The type was in use by the end of the second century, so the Brougham example indicates a use-life of half a century at a minimum. The Stanegate ‘Claudio-Neronian’ brooches can also be noted.Footnote 30 These sites are not thought to have been occupied before the Trajanic to early Hadrianic period, but several types first attested in Augusto-Tiberian contexts, including an Aucissa brooch and two Augenfibel,Footnote 31 have been found on them.
Against this background it does not seem unreasonable to assume that the Groups could have had use-lives of 100 years. It is then necessary to consider how loss of individual brooches within that period might be modelled. The next section explains how this can be done and introduces various statistical techniques which will be used in the rest of the paper.
STATISTICAL METHODOLOGY
The focus here is on the ideas involved in the statistical methods used. Finer points of technique and application are dealt with in context.
The starting point is a table of counts with n rows (the estimated start dates referred to here as TPQs) and p columns (regions). The term row profile for these values is used. Correspondence analysis and cluster analysis, noted below, are standard techniques for archaeological data analysis of this kind.Footnote 32
Correspondence analysis
Correspondence analysis was not used much in Roman archaeology up to about 2000.Footnote 33 Since then the situation has changed.Footnote 34 A table of counts is reduced to a map where row profiles are represented by points; it is hoped that the closer the points are on the map the more similar are their profiles. Column profiles are similarly treated and both maps inspected to see how row and column categories are related.
Cluster analysis
In hierarchical cluster analysis rows are initially treated as individual clusters then successively clustered together on the basis of their similarity until all are merged in a single cluster. Results are represented in the form of a tree diagram (dendrogram); ‘branches’ of the tree are cut with the hope that they consist of ‘leaves’ (row profiles) similar to each other and distinct from other branches. It is often useful to examine cluster analysis output in conjunction with a correspondence analysis plot.
The rows in Table 1 have a natural temporal ordering. Constrained clustering as used here forces this to be respected. Only temporally adjacent rows/clusters are allowed to merge, so the leaves of the dendrogram have the same ordering as the rows. The aim is to see if clusters can be identified that can be associated with points in the temporal sequence where there is a change in the typical row profile.
Modelling regional distributions of brooch use over time
Our approach is simply described, but not standard. The South region is used as an example; there are 3,349 brooches of which 88 have an estimated terminus post quem (TPQ) of 70 b.c.
(a) A random set of 88 plausible dates is generated; this is repeated for each of the 51 TPQs, generating 3,349 random but ‘believable’ dates.
(b) The distribution of dates is summarised in the form of a kernel density estimate (KDE); the same process is repeated for other regions; KDEs are overlaid to investigate temporal differences in the regional use of brooches. The KDEs can be thought of as smoothed histograms, much more suited to comparing distributions.Footnote 35 Assume we know the terminus ante quem (TAQ) for a brooch Group. The use-life of the brooch is L = TAQ – TPQ. Assume, also, that all Groups have the same use-life. Random dates, D, for brooches with a common TPQ can be generated using
 $$D = {\rm TPQ}{\rm} + L \times E$$
where E is a random number lying between 0 and 1. To generate values of E we sample from a probability distribution lying between 0 and 1. A flexible model is the beta distribution. Readers can be spared most of the mathematical details, the number generation is straightforward with modern (open-source) software.
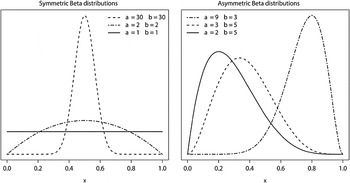
The shape of the beta distribution depends on two numbers, or shape parameters, α and β. The values α = β = 1 give rise to a uniform distribution. Other examples for different α and β are shown in fig. 1.
Beta distributions showing how the shape varies with different choices of the shape parameters α and β.

The mode is at (α – 1)/(α + β – 2); if α = β, greater than 1, a symmetrical distribution with a mode at 0.5 occurs. This corresponds to the belief that brooch loss peaks halfway through the use-life of a type. The magnitude of the parameters controls the concentration about the mode. If L = 100 and α = β = 2, maximum brooch loss peaks at 50 years but is spread through the entire use-life of a brooch; if α = β = 50 brooch loss is concentrated between 40 and 60 years from the TPQ. To model the belief that brooch loss is likely to peak earlier during the use-life of a type fix α at a greater value than 1 and choose β to be larger. Thus, if α = 2 peak loss occurs at 1/β; a fifth of the way through the use-life if β = 5, a third if β = 3 and so on.
There are 10,921 brooches in all and the outcome of an analysis is contingent on the 10,921 dates randomly generated. To see if this sampling variation has an effect we generated 99 sets of dates and overlaid their KDEs (e.g. fig. 5). Apart from providing reassurance that distributional patterns are insensitive to the random nature of date generation, this mode of display provides a more vivid and interpretable picture of regional variation than plotting single KDEs allows.
Issues of more purely archaeological concern include the following:
-
(a) Uncertainty surrounding the choice of TAQ.
-
(b) Assuming a common use-life for all types is almost certainly unrealistic.
-
(c) The appropriate model for the distribution of brooch loss is not obvious.
The analyses presented assume L = 100 with α = β = 2. Results are, however, remarkably insensitive to this choice. Extensive experimentation was undertaken using different assumptions, some of which are illustrated in the online Supplementary Material: Section 3. This includes allowing the use-life to vary with each TPQ, placing different limits on the maximum use-life and varying the model used for the brooch loss distribution. If brooch types are allowed any sort of life at all the regional differences on which we comment below seem to be unaffected by the kind of life we might realistically assume they have led.
A final point is that the estimated TPQs used, while rather more secure than any TAQs we might assume, are subject to some uncertainty. This was explored by breaking the data set down into Groups and taking as the TPQ the earliest possible date compatible with the archaeological record. This had no effect on the regional patterns observed except that — for obvious reasons — they were shifted back in time a little.
EXPLORATION OF POSSIBLE BIASES IN THE DATA
With any large data set accumulated over a considerable time and from many sources, it is wise to examine it for bias which might obscure and in some cases overwhelm any underlying pattern. For many years, for example, Romano-British archaeology was biased towards that recovered from military and urban sites as those were the ones excavated.Footnote 36 The wide range of rural sites where the majority of the population would have lived only started to be explored in comparable numbers in the 1990s so the corpus could only benefit from this during the final decade or so of data collection. Throughout his book Mackreth himself regularly warned about likely bias in the data.Footnote 37 He was concerned about what he perceived to be a patchy geographical coverage including the possible under-representation of rural sites in some places, especially the North, and over-representation in his home area of East Anglia. As one of us has often noted that there appear to be biases in collections derived from metal-detecting, it was decided to explore this as well.
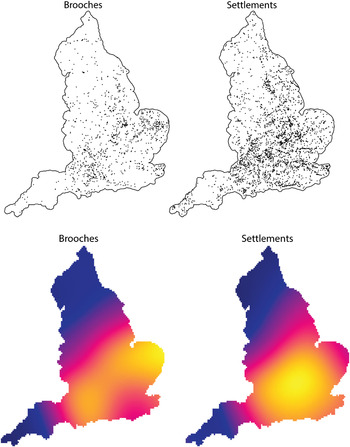
At the time the work for this paper was being conducted, the Rural Settlement of Roman Britain projectFootnote 38 had recently made available its data for England and the intensity of occupation this showed was taken as an index against which to judge the geographical coverage of the corpus. The Rural Site map co-ordinate data were downloaded and similar co-ordinate data generated for the sites with brooches. The intensity maps can be compared in fig. 2. As can be seen there is a general overall similarity, though East Anglia stands out as having a much more intense concentration of sites for the brooches than for the Rural Sites. Approximately a quarter of the English brooch sites are at places which also have occupation recorded in the Rural Sites database. The number of sites common to both differs regionally with East Anglia having the most at 53 per cent of all brooch sites in the region being ones from the Rural Sites data. The next two highest regions are the South-West at 44 per cent and the East Midlands at 42 per cent. In the South and the West Midlands the figures are 29 per cent and 24 per cent respectively. As Mackreth suspected rural brooch sites in the North are comparatively poorly represented at 12 per cent. Of particular interest, though, is the low intensity of occupation seen for the Rural Sites project in the North. Given the low intensity of rural sites and the high intensity of military sites throughout the region, the Mackreth figures for brooch use in the North may not be as unrepresentative as he feared. The relatively small numbers of brooches coming from northern rural sites is something which has been noted in the PAS data,Footnote 39 while more generally a low uptake of material culture has also been noted from the excavated rural sites.Footnote 40
Maps comparing the distribution of rural sites and brooch sites, the latter to the left. The upper plots show the actual locations; the lower plots show smoothed relative density maps of the distribution, yellow corresponding to high and blue corresponding to low concentrations of sites for a type.

To explore the impact of metal-detecting on the corpus, the brooches were divided into those derived from conventional sources such as excavation, survey, chance finds in museums made prior to common use of metal-detectors etc., and those made most probably by metal-detectorists. The latter group could be identified in the corpus as having a private collection as the source.Footnote 41 Those in the Hattatt collection were kept as a separate group as, given the date when he was collecting, both conventional and metal-detected material can be expected within it. The results are shown in Table 2 ordered by the amount of the assemblage recovered through metal-detecting. As can be seen at least half the assemblage from East Anglia comes from metal-detected sources which explains the high proportion of rural sites in the region and the greater intensity of density of sites shown in fig. 2.
SOURCES OF THE BROOCHES BY REGION
(Row percentages may not sum to 100 per cent due to rounding. * indicates present but at less than 1 per cent.)

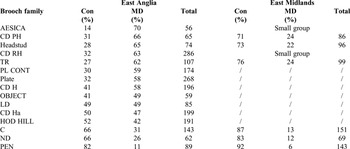
Table 3 shows the brooch data from East Anglia as percentages of each family found by metal-detecting and conventional means. Only those families with more than 50 examples in the East Anglian assemblage have been included and they have been arranged in order of the highest percentage of metal-detected material. All things being equal, an approximately equal split between the two sources might be expected, but as can be seen this is not the case. Two-thirds of the Aesicas, the Colchester Derivative Polden Hill and the Headstud families are derived from metal-detecting with the Colchester Derivative Rearhook being almost in that category. At the other end of the scale less than a third of the one-piece Colchester and Nauheim Derivative brooches were recovered by metal-detecting and only just over 10 per cent of the penannular brooches. The table also contains the figures for the same families from the East Midlands where 19 per cent of the assemblage was metal-detected. At the level of the Colchester Derivatives, Trumpets and Headstuds the differences are too subtle for it to be appropriate to draw conclusions, but for the one-piece and penannular brooches there is again an under-representation in the metal-detected assemblage.
THE SOURCES OF THE LARGEST FAMILIES FOUND IN EAST ANGLIA WITH DATA FROM THE EAST MIDLANDS INCLUDED FOR COMPARISON
(Row percentages with data from the Hattatt and unknown categories excluded. Abbreviations Con – conventional, MD – metal-detected.)

It has been obvious for some time that when the assemblages from sites which have been both conventionally excavated and metal-detected are compared, the proportion of penannular brooches in the metal-detected assemblage is regularly lower than that in the excavated assemblage.Footnote 42 The paucity of metal-detected penannular brooches is something which Booth also observed in her recent doctoral thesis on the brooch type.Footnote 43 For whatever reason metal-detected assemblages seem to under-record penannular brooches. That one-piece brooches might suffer from a similar under-representation is an interesting development. The over-representation of certain types may well be associated with the fact that the types are physically quite substantial, again something which has been noted before.Footnote 44 For the purposes of this study, the fact that metal-detecting may be biasing the overall profiles, is only something that has to be allowed for in the East Anglian material. For wider studies which seek to compare PAS data to conventionally sourced material, it will undoubtedly be a major problem that should be addressed. McIntosh in her study of brooches in the North clearly found penannular brooches a problem in her PAS data.Footnote 45 This bias would explain that. One-piece brooches do not appear to be a category she considered as there is ambiguity in her ‘Colchester’ category,Footnote 46 so exploring whether they too are under-represented in the PAS data using her study cannot be taken further here. Additional work with the PAS corpus which we have conducted and hope to publish elsewhere does, however, support the idea that one-piece brooches are under-represented in such data.
Other possible biases in the metal-detected assemblage will be considered further below in connection with the colour of the brooches, while the impact will be discussed in the concluding section.
REGIONAL PATTERNS OF USE THROUGH TIME
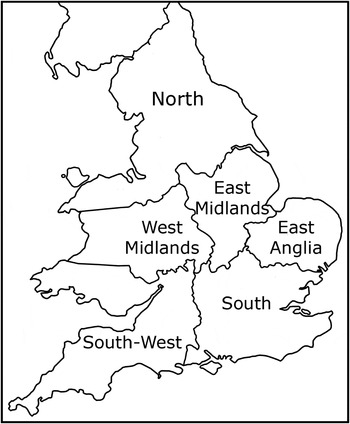
It has long been known that individual brooch types can have restricted distributions and at a broader level that there are marked regional preferences in how the pin is mounted within the large Colchester Derivative family. What it has not been possible to show before is that there were fundamental regional differences in the adoption and use of brooches. The regions the data are divided into were developed through exploring different groupings. The initial one consisted of the South, South-West, East Anglia, the Midlands and the North. The second divided all the areas other than East Anglia into smaller components. The final division into six regions evolved from that, as it showed there were marked differences within the Midlands area which justified an east/west division. The Cheshire and north Wales assemblage which was initially placed within the Midlands, was also found to be much more similar to that of the North than to the Midlands and so was moved to that area. The exploratory analyses that led to the regional grouping are summarised in the online Supplementary Material: Section 3, while the regions are shown in fig. 3.
The regional divisions used in this paper.

CORRESPONDENCE ANALYSIS
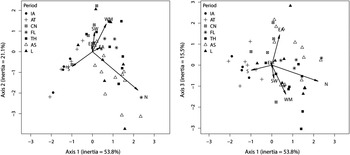
An initial correspondence analysis of the counts on which Table 1 is basedFootnote 47 separated the South-West from other regions because of the effect of three ‘outliers’ associated with the date-assemblages for 20 b.c., a.d. 5 and a.d. 45.Footnote 48 Inspection of the data revealed this was being caused by the number of Durotrigian brooches present in these date-assemblages. The first two date-assemblages for example, only had Durotrigian brooches in them. This family has a very strong regional distribution in the Dorset/Wiltshire area, hence the name that Mackreth assigned to it,Footnote 49 and was clearly developing in the late first century b.c. and into the first century a.d. Removing these assemblages, as in fig. 4, results in a dramatic shift and the South-West now plots closely to the markers for East Anglia and the East and West Midlands on the first two axes.
A correspondence analysis of the counts on which Table 1 is based. Plots of the first axis against the second and third axes are shown labelled by period. The date-assemblages for 20 b.c., a.d. 5 and a.d. 45, with exceptionally high counts for early dates in the South-West, are omitted. The periods, labelled chronologically in the legend are IA = Iron Age, AT = Augusto-Tiberian, CN = Claudio-Neronian, FL = Flavian, TH = Trajanic-Hadrianic, AS = Antonine-Severan, L = Late. The total inertia for the first three axes is 90.4 per cent.

The inertias listed on the axes measure the quality of the CA approximation. Defining what constitutes a good approximation is something of an arbitrary exercise. The first two axes account for 75 per cent of the total inertia which can be regarded as satisfactory. It leaves 25 per cent of the inertia unaccounted for, however, so it is worth looking at other axes. A plot involving the third axis which accounts for a further 15.5 per cent of the inertia — that to the right of fig. 4 — separates out East Anglia from the other regions; East Anglia recurs as unusual in other respects and this is discussed in more detail later.
Row (date-assemblage) markers are labelled by period, column (region) markers by letters (EA, EM, WM, N, S, SW) in an obvious fashion. The first axis has a clear chronological interpretation with the South plotting to the left in the same area as the markers for the earliest periods, in ‘opposition’ to the North which plots in the same area as the later periods. The other regions plot more centrally in the same general area as the intermediate periods. As noted, East Anglia plots separately on the third axis for reasons explored later that are not necessarily chronological. In summary, with the caveat that there are three untypical early date-assemblages dominated by brooches from the South-West, the correspondence analysis shows a clear chronological pattern that can be interpreted in terms of regional differences.
Undated penannular brooches were omitted from the analyses, but it is possible to see where they best fit by plotting the associated assemblage on the maps already produced, as a supplementary point. Loosely, the map can be thought of as a ‘landscape’ defined by prominent features (regions) and ‘settlements’ (date-assemblages). The undated penannular ‘settlement’ is dropped into this landscape nearest the settlements it most resembles in terms of its features.Footnote 50 If this is done (see fig. S2 in the online Supplementary Material: Section 3), then on the first two axes it lies on the later side of the plot in the region of Groups having a Flavian or later date; if the third axis is used, it plots near the periphery of the point scatter in the same region as Groups mainly of Trajanic/Hadrianic date or later. The overall conclusion is that the regional distribution of undated penannular brooches is not especially typical but certainly more akin to that of intermediate and later than earlier date-assemblages, with a bias towards the more northern and western regions. Such brooches in East Anglia are particularly under-represented — less than a tenth compared to more than a fifth of all other groups — due to the method of data collection that has already been noted in the previous section.
DENSITY ANALYSES
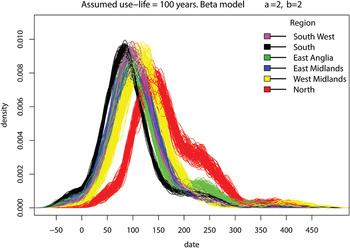
So far it has, effectively, been assumed that all brooches for a particular date-assemblage are lost at the same time, the TPQ. This is more than adequate to reveal broad temporal and other patterns in the data, but a more nuanced approach is now adopted by allowing for the fact that brooch Groups have a use-life and individual brooches are lost at different times. The protocol described earlier for comparing distributions across regions is adopted, assuming a use-life of 100 years. The beta distribution with α = 2 and β = 2 is used to model the distribution of dates within the use-life; that is, it is assumed that brooch loss peaks halfway through the use-life. For these analyses the date assemblages of 20 b.c., a.d. 5 and a.d. 45, which had been temporarily omitted to explore the basic temporal patterns via the correspondence analysis, were re-instated. fig. 5 is the result, based on the full data set.
Density plots of brooch use from 99 simulations assuming a use-life of 100 years, modelled using a beta distribution with α = 2 and β = 2.

The plot shows, quite starkly, the differences in the temporal variation of brooch use between regions. Looking first at the peaks, the South is earliest and the North latest; of the other four regions the West Midlands peaks later than the East Midlands, East Anglia and the South-West, with the last three peaking at roughly the same time. Looking at the beginning of the plot, brooch use clearly becomes well established in the South during the first century b.c. The East Anglia/East Midlands/South-West diagonal band across the country is beginning to adopt them in some numbers during the later years of the first century b.c., with the West Midlands following suit in the earlier first century a.d. In the North fashions requiring brooch wearing do not appear to start to be adopted until the mid to later first century a.d. This picture makes explicit the complexity of what has been termed the ‘Fibula Event Horizon’.Footnote 51 We are clearly dealing with multiple well-defined events or horizons.
Looking more closely at the curves, with the exception of the North, the other regions show a sharp increase in intensity of use from the early first century, peaking after c. 60 years for the South and 100 years for the West Midlands, with other regions intermediate. The North starts and peaks somewhat later than the other regions. The decline is interesting; it is quite sharp and mirrors that of the rise; in fact four of the regions have a very symmetric pattern of rise and decline. One exception is the North which declines at a fairly sharp rate to about the beginning of the third century a.d. when the intensity of use stabilises for c. 50 years before further decline sets in. The other exception is East Anglia where there is a noticeable ‘bump’ in the late second century and into the first half of the third century.
The Northern pattern would be consistent with a view that brooch use continued longest among the military community. It is normal to point to the new families such as the knee and proto-crossbow brooches coming into use during the mid-second century and into the third century as the types the military community were using at the time.Footnote 52 Inspection of the data at Group level suggests that while the knee family is regularly present in the North, accounting for c. 30 per cent of those in the corpus, it is regularly present in the other regions as well. Similarly while a third of the proto-crossbow and early crossbow brooches (Groups 208–11) in the corpus are from the North, the South and East Anglia account for just under a half. While members of the military were undoubtedly wearing these brooches, the data would suggest that many other parts of the population who still wanted to wear brooches were as well. This supports Eckardt's suggestion that knee brooches had less of a military distribution than is often thought.Footnote 53 An alternative interpretation would be that members of the military were stationed widely throughout the province and it is this that the data are reflecting. As a third of these brooches come from sites recorded within the Rural Sites database, this would imply a much more heavily militarised landscape than is normally assumed. At present, while the extended period of brooch use in the North compared to elsewhere seems to be a real pattern, it might not be wise to attribute it to a great extent to the military. Further discussion of the Northern pattern is provided in the online Supplementary Material: Section 3, in connection with fig. S3.
While the ‘bump’ seen in the East Anglia density picture might be reflecting a real pattern of brooch use, there seems no doubt that it is being amplified to a great extent by the method of recovery. Comparing the proportions of the different Groups found by conventional means and metal-detecting in East Anglia shows that from start dates of a.d. 115 for about a century many more were being recovered by metal-detecting than by conventional means. Earlier and later the picture is reversed. It seems likely, therefore, that this is contributing to the pattern. The possible reason for the different proportions recovered at different times will be considered at the end of the paper.
Finally to be noted in fig. 5, there is a subtle but noticeable temporal variation in the timing of the decline from the peaks to about a.d. 200. The South is obviously earliest, and the South-West, and East Midlands form the filling of a ‘sandwich’ bounded by the earlier East Anglia and the later West Midlands. This can be seen on careful inspection of fig. 5 and is even more apparent if transparent colours are used and the more extreme simulations omitted (see figs S3 and S4 in the online Supplementary Material: Section 3, for some examples).
This picture is remarkably insensitive to variation in either the assumed use-life or the assumed pattern of loss within the life-span, so long as the brooches are allowed to have a life at all (which does not necessarily have to be long and happy). The use-life can be constrained, so that, for example, all brooch Groups expire in or before their teens. The plots become much ‘messier’ and ‘spiky’ but the interpretation essayed above is still valid. In the limit, as use-life approaches zero for all groups, it amounts to expressing the data for each region as column percentages and plotting these against the assumed TPQs. We think the approach adopted here is much to be preferred, however; allowing the brooches a decent use-life (which can be somewhat less than 100 years) seems much more realistic, producing smoother and more interpretable plots that reflect the idea that brooch use rose and declined in a continuous fashion. Some analyses to illustrate the insensitivity to assumptions about use-life and patterns are provided in figs S3 and S4 in the online Supplementary Material: Section 3.
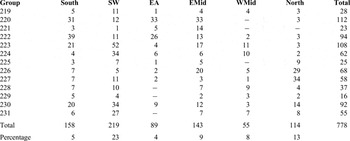
The question arises whether the group of 560 undated penannular brooches which were not included in the main analyses could make any difference to this pattern. As penannular brooches are sometimes suggested as being part of military dress,Footnote 54 their exclusion could plausibly be contributing to the very different use profile in the North. In passing it may be noted that in the material recorded in the corpus, though the North appears a more prolific user of penannular brooches than the South, it depends on what part of southern Britain is being referred to. Table 4 shows the data for all of the penannular brooches considered in this paper. As can be seen, it is the population of the South-West which was the most prolific user of penannular brooches judged by the proportion of the total brooch assemblage that they form.
The penannular brooches considered in this paper with the bottom line providing the percentage of the brooches from the region they form. Groups 221–3, 226–7, 230 and 231 form the undated penannulars

To explore whether the exclusion of the undated penannular brooches was having an effect, their data were added. Analyses were run giving this material different start dates and a variety of use-lives. In these analyses all of the other Groups maintained their normal 100 year use-life. The difference to the pattern seen in fig. 5 was negligible. To make any appreciable change a very early date of 70 b.c. and a short use-life had to be assumed. As such a model of their use is incompatible with what we know about them, i.e. they were obviously still in use late in the Roman period and beyond, it can be concluded that the exclusion of the group has had no effect on the regional patterns of use. Again the regional differences in the adoption and abandonment of brooch-wearing fashions demonstrated by fig. 5 remain robust.
As a final consideration in this section looking at broad regional differences in brooch use, it is useful to place the British pattern more widely within the continental pattern. While we talk of ‘Roman’ brooches it should be noted that in the early to mid-Imperial period brooch wearing was not particularly common in Italy itself. Though brooches were being worn by some of the population in Pompeii at the time of the eruption, they form a relatively small part of the finds assemblage.Footnote 55 This seems to have been the pattern for some time previously. At Insula VI.1 where virtually the entire pre-eruption-level insula has been excavated, brooches accounted for only 25 items out of a non-ferrous assemblage of 992 items belonging in the main to the first century b.c. to a.d. 79.Footnote 56
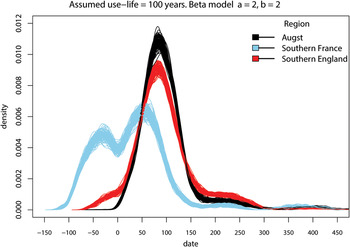
More useful comparisons can be made with the provinces of Gaul and Germania. Here the Feugère corpus of the material from the South of France and Riha's publication of the brooches from Augst and Kaiseraugst (Switzerland) have been used.Footnote 57 The former consists of the brooches from a range of site types. The latter relates to those from an élite urban settlement founded as a colonia in the Augustan period and becoming an important military centre in the late Roman period. The types and sub-types in both publications were inspected in a similar way as has been done for the Mackreth corpus and groups with start dates calculated in the same way extracted. The data consist of 1,874 brooches for the South of France and 2,790 for Augst. fig. 6 presents density plots for these two areas together with that for the South of England already reported on. As can be seen, southern France adopted and abandoned brooch wearing much earlier than was happening in the South of England. As was often the case, the latter area was a late adopter of new fashions and technologies, the very late adoption of wheel-thrown pottery being a good example.Footnote 58
Density plots of brooch use over time for Augst (Switzerland), southern France and southern England, from 99 simulations assuming a use-life of 100 years, modelled using a beta distribution with α = 2 and β = 2.

The comparison to the Augst data though is much more revealing. Allowing for the fact that Augst will start later, being an Augustan foundation lacking first-century b.c. occupation, the two plots are remarkably similar both peaking and declining at the same time. Is it possible that the pair are showing what the normal north-west province habit of brooch use was in the Imperial period? The actual brooches used were frequently different types, but the chronological signature is the same. To explore this further is beyond the scope of this paper. The two data sets used for comparison were chosen because they are directly comparable to the Mackreth corpus. The material has been typologised to a high level, the dated contexts of the types were considered so that the type of start date used here could be calculated and the quantities of each type found could be extracted. This sets the bar very high for data collection, but if comparable large data sets from elsewhere in the north-western provinces could be found, it would be useful to explore the patterns further.
REGIONAL PATTERNS IN THE LATER FIRST TO SECOND CENTURIES
Regionality in artefact use is often looked at by plotting the distribution of particular types to see if they have restricted distributions.Footnote 59 Within the Mackreth corpus there is a wealth of such data which can be extracted. Here we have chosen to explore just one family and one aspect of brooch preferences, as to do full justice to the data would require several papers and not just this one.
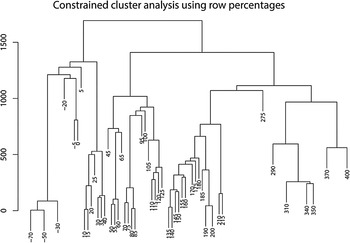
Clearly given the differing regional time signatures for use established in the previous section, it is sensible to choose a period when brooches were in use in the North, if a picture that covers the entire province is wanted. Choosing the boundaries of the period was done by inspecting the constrained cluster analysis of the row profiles of Table 1 (fig. 7).Footnote 60 This groups together rows with similar profiles while also constraining the result to respect the temporal ordering of the assemblage. This means that some assemblages look out of place in the cluster to which they are assigned. The assemblages for 20 b.c. and a.d. 5, for example, stand out from the other early assemblages they are forced to cluster with. The reason for this has already been discussed.
A constrained cluster analysis of the date-assemblages, expressed as row percentages using Manhattan distance as a dissimilarity measure.

The idea was to identify ‘natural’ breaks in the temporal sequence and two clear periods after the North becomes brooch using can be seen, one between a.d. 70 and 125 and the second at a.d. 135 to 200. Here we work with the first, which provided a data set of 2,708 brooches from 76 Groups. The data will be illustrated by density plots to allow a quick appreciation of the regionality. Only the English data have been plotted as this enables comparison to the overall Rural Sites density data if required (see fig. 2).
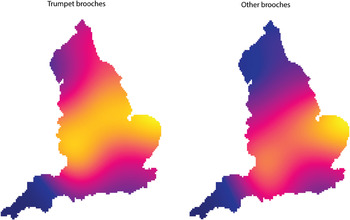
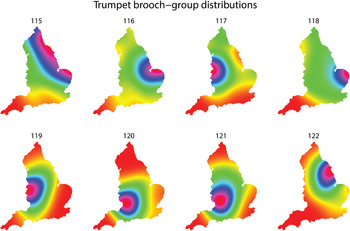
The family chosen to explore is the trumpet brooch which accounted for 14 of the Groups. fig. 8 compares overall distribution of the trumpet family with the distribution of all the other families within the same a.d. 70 to 125 start date period. It is often stated that the standard trumpet brooch is ‘native to’ or ‘generally associated with’ the North.Footnote 61 As the figure shows, it is hard to maintain this for the family as a whole. The main focus is broadly in the Midlands. In the North, though there is a higher density compared to other contemporary brooches, the evidence would scarcely support this being described as a northern type. If the distributions of the individual Groups are examined a much more complex picture emerges. fig. 9 shows density plots for the eight Groups which make up what Mackreth regarded as the standard trumpet form.Footnote 62 Here the colour palette can be rapidly appreciated from the plot for Group 115 where the highest density of the finds are in the North-East (red) and then grade through purple/blue to orange where it is lowest in the South-West. The case of Group 118, the enamelled trumpets of Mackreth Type 1.2bFootnote 63 will be considered separately as that can be shown to be a product of the way in which the data were collected.
Smoothed relative density maps of the distribution of the trumpet brooch family compared to all other brooches within the a.d. 70–125 start date group. The colour coding is as for fig. 2.

Smoothed relative density maps of the standard trumpet brooch Groups distribution of all the a.d. 70–125 start date brooches. Red corresponds to high shading through blue green and yellow to orange (low).

For the remaining seven Groups there are three (115, 116 and 122) with their highest densities in the east of England and four (117, 119, 120 and 121) in the west. Most unusually mould evidence for two of the groups exists and this strongly suggests that the highest density areas are indeed reflecting where these types were manufactured. Group 120 is Mackreth's Trumpet Type 1.3a,Footnote 64 sometimes known as the Chester type. A brooch of this type, precisely of Sub-type 1.3a2, was found together with fragments of the mould into which it fitted at Dymock.Footnote 65 This accurately matches the focus of the density distribution in Gloucestershire. A mould from PrestatynFootnote 66 would have made brooches of Group 121 (Mackreth Trumpet Type 1.3b). As can be seen in fig. 9, the focus of the density for this Group is further north in the western Midlands and had the Welsh material been plotted, the mould too would have been located in the area of highest density. Given that the higher density regions for Groups 120 and 121 have this association with known moulds, it is plausible to suggest that the highest density areas in other plots might well be indicating core manufacturing areas.
Naturally brooch-makers could have been itinerant, travelling around an area and making brooches at different locations within it, but there can be no doubt that the Mackreth corpus provides the starting point for much future work on exploring the organisation of the copper-alloy industries within Britannia during the first two centuries a.d. Attention has often been drawn to the regional groupings of other metal small finds during that period, for example hairpins,Footnote 67 toilet implementsFootnote 68 and cosmetic sets,Footnote 69 and it is clear that some of the trumpet brooch Groups have distributions which are very similar to some of those types. The advantage with using brooches is that they are far more numerous, appear sometimes to have much tighter regional groupings and the Mackreth corpus allows the whole of the province to be examined. The other studies are often more limited in their geographic scope. Density maps of the sort produced here are relatively simple to produce and Section 5 in the online Supplementary Material provides guidance on how to do this with open source software.
The case of the enamelled trumpet brooches of Group 118 does, though, point out that there can be no simple equation between the highest density of a type and its place of origin. The source of the data always has to be inspected before such a suggestion can be made. In this case the enamelled trumpet brooches have their highest density in East Anglia with the rest of the country having a relatively even, thin spread. This pattern is very different from those seen in the other seven Groups. Given that half the East Anglian assemblage is the result of metal-detecting and private collecting, the sources of the members of Group 118 were inspected and the results are given in Table 5.
A comparison of the origins of enamelled trumpet brooches (Mackreth type 1.2b, group 118 here) from East Anglia and all other parts of the country

That there is a strong association between the manner of brooch recovery and regional sub-divisions is obvious. The high density in East Anglia for Group 118 is based on the total number of the Group found in this region, most of which are metal-detected. If only conventionally recovered brooches had been plotted the density in East Anglia would drop and be ‘redistributed’ across the rest of the map, becoming much closer to that of Group 115 (Mackreth Trumpet Type 1.a, the classic Backworth type),Footnote 70 as approximately half of the data comes from the North-East, Yorkshire and East Midlands area. Note that we can say this because the data from other regions have a much lower incidence of brooches recovered by metal-detecting.
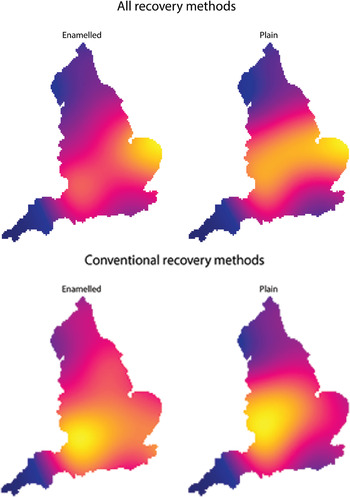
How might this be interpreted? One possibility, which we think is highly implausible, is that East Anglia is a core manufacturing area for Group 118 and that metal-detecting is revealing this but conventional recovery methods signally fail to do so. If this idea is rejected then the high density is reflecting the prevalence of metal-detecting and lacks a useful archaeological interpretation. Why is this problem manifest for this particular group? Group 118 is distinct from other standard trumpet brooch Groups in that the brooches are brightly enamelled. Some of the biases which metal-detected assemblages can show have already been explored, but this case points to another, suggesting that brightly coloured items may be easier to locate when detecting and may also have been more attractive to collect. The density distributions of the other trumpet family types decorated with enamel also show areas of high density in East Anglia (see fig. S5 in the online Supplementary Material) which would support this. This has a direct impact on the other aspect of the a.d. 70–125 start date assemblage being explored here.
This period sees the arrival of many types of enamelled brooches and one of us had previously noted that there appeared to be regional preferences in whether people adopted coloured brooches or not.Footnote 71 That study was based on the Mackreth corpus but the data had not been rigorously screened as has been done here. It was repeated with this data set looking at both the complete data and the subset which had been produced by conventional means (fig. 10). Naturally the latter may show a bias towards brightly coloured items as it will contain chance finds and some museums’ collecting policies favoured such items, as Mackreth himself noted in connection with the British Museum collection.Footnote 72 On the whole though, the conventional data contain a large quantity of excavated brooches and so such bias should be much less noticeable.
Smoothed relative density maps of the distribution of all the a.d. 70–125 start date brooches divided into enamelled and plain brooches. The upper two plots show the complete data set. The lower two show those recovered by conventional means. Yellow corresponds to high and blue corresponds to low concentrations for a type.

As can be seen, the upper plots of all the data indicate the highest density for enamelled brooches is in East Anglia. Once the metal-detected material is removed (lower plots), an entirely different picture emerges with the South-West/Severn area showing the highest density, with a much more even spread across the rest of the country. Plain brooches have their higher density overlapping with the northern part of the enamelled high density and spreading up into the West Midlands. The North and the south-east corner of England interestingly seem to show a relatively low density of plain brooches. This is a different pattern than was advanced simply by taking the whole Mackreth corpus of bow brooches for the later first to early second century.Footnote 73 It demonstrates both the need for rigorous data inspection before drawing conclusions and the bias towards coloured items which metal-detecting may produce. There do appear though, to be regional differences in whether people wanted coloured or plain brooches, such that a more focused exploration of the data could well be fruitful.
SOME CONCLUDING THOUGHTS
The aim of this paper has been to explore some fundamentals of brooch use in Britain to allow future, more detailed work on issues of identity, regionality etc. to proceed. We have deliberately taken a broad-brush approach but even this has revealed important new information relevant to these topics. Given brooches are intimately associated with costume and appearance, the major regional differences demonstrated in the adoption of brooches are a very rapid way of appreciating how many ‘Roman Britains’ there were. The oft-cited ‘Fibula Event Horizon’ is seen to be a much more complex process than perhaps appreciated and needs more detailed consideration. What has not attracted much attention is what could be termed the ‘Fibula Abandonment Horizon’ which has also been clearly demonstrated. Why did people fall out of love with the costumes that required brooches? What fashions did they adopt? Were they moving towards the more Mediterranean styles which had long before abandoned brooches? Was a new north-western provinces fashion evolving such as the Gallic coat?Footnote 74 A major question which also has to be asked is the following. If, as some have argued, the initial adoption of so many different brooch types in such large numbers expressed ‘the occurrence of important changes in personal social identities’,Footnote 75 what is their abandonment saying?
The different time signatures in broad regions, and the complexity in regional patterns we have demonstrated in just one family at one period, show that although brooches provide an immensely rich source of information about regionality, it is not going to be a story which is easily extracted. Simply comparing the incidence at the family level as is often done, will not take us very far. Engaging with the typology at a much more detailed level will be required and this will probably also apply to explorations of identity which look at what styles were favoured by urban, military, rural communities etc.
It will be important in the future to study the regional patterns of brooches alongside those seen in other contemporary copper-alloy small finds. By doing that it may be possible to see whether the brooches are signalling a deliberately chosen local or regional visual identity, or whether more prosaically the regional patterns arise from what was available to buy. McIntosh has shown that even with a very distinctive enamelled brooch with a tight regional distribution, it is very difficult to associate it with being a marker of tribal identity.Footnote 76 It is tempting to modern eyes to think of brooches as being like badges, identifying the wearer to others; but the common regional distributions some brooches share with objects which would not have been worn points to marketing areas as having an important influence. It is an avenue that could and should be explored.
The opportunity which has been taken to explore the impact of metal-detecting on the corpus has produced some important information about bias in that sort of data. The Portable Antiquities Scheme itself has been exploring bias in its data,Footnote 77 but has not considered the ones to do with shape and colour to which we have drawn attention here. Work to be reported on elsewhere shows that the shape bias continues to be seen in the more recent PAS data. The reasons for this clearly need to be explored, i.e. is it a technical issue of signal strength or is it a reporting issue as Booth has hypothesised.Footnote 78
Whatever the cause, the impact of the biases is likely to have a direct effect on the date profile of a metal-detected assemblage. In any area where one-piece brooches are to be expected in some quantity, metal-detecting is likely to be under-reporting the earliest part of brooch use. This almost certainly explains at least in part the curious pattern noted above when exploring the East Anglian ‘bump’. There it was seen that from start dates of a.d. 115 for about a century many more were being recovered by metal-detecting than by conventional means. The steady rise in the proportion recovered by metal-detecting from the mid-first century probably reflects the fact that brooches of that date become more substantial and more are enamelled. The fact that more of the third- to fourth-century brooches were recovered conventionally is probably to be explained by the fact that these would mainly have been the crossbow family. Those were markers of authority and rank and more likely to have been recovered from known military installations and towns. The rural ones are likely to be Scheduled Ancient Monuments where detecting is forbidden. All of this indicates that explorations of combined metal-detected and conventionally sourced data sets, which will undoubtedly become more common, will have to be done with some care and attention to detail as we have done here.
The methodology we have developed for exploring use-lives of Groups in different regions could be applied to any other large body of data which contains similar types of information. It has the advantage of making the researcher formulate their beliefs about such questions as how long a particular artefact type might last in use. These questions are ones we perhaps do not ask often enough and undoubtedly should do. The modelling approach allows beliefs to be investigated and challenged.
Finally it is appropriate to pay tribute to the wonderful corpus of data Don Mackreth gave us, whose value has not always been appreciated.Footnote 79 The fruits of a lifetime's work, it provides a sound foundation on which to build. The typology is a complex system, but brooches are a complex body of data. People expending the effort needed to explore it will be repaid generously by the avenues of research it opens up both in the Mackreth corpus itself, and all the thousands of brooches which have been recorded since 2004.
SUPPLEMENTARY MATERIAL: CONTENTS
For supplementary material for this article please visit http://journals.cambridge.org/bri
Note: the Supplementary Material includes online figs S1–5 and Tables S1–3.
SECTION 1: Introduction D1
SECTION 2: Data D1–11
SECTION 3: Regional patterns of use through time D11–15
SECTION 4: Regional patterns in the later first to second centuries D15–16
SECTION 5: Computational and related matters D16–19
Bibliography D19
ACKNOWLEDGEMENT
We are grateful to the two anonymous referees for their helpful comments.