




No CrossRef data available.
Article contents
Working memory and processing speed deficits in systemic lupus erythematosus as measured by the paced auditory serial addition test
Published online by Cambridge University Press: 06 February 2004
Abstract
As many as 66% of systemic lupus erythematosus (SLE) patients have been reported to have cognitive deficits. These deficits are often associated with information processing speed and working memory. Similarly, processing speed and working memory impairments are the hallmark of cognitive dysfunction in multiple sclerosis (MS). The Paced Auditory Serial Addition Test (PASAT) places high demands on processing speed and working memory. Fisk and Archibald, however, demonstrated that the total score of the PASAT does not accurately reflect impairments in these cognitive processes. They found that MS patients used a chunking strategy to obtain correct responses and reduce the cognitive demands of the task. In the present study, PASAT performance was examined for 45 SLE patients and 27 controls using alternative scoring procedures. Although the total number of correct responses did not differ between SLE and controls at the 2.4 or 2.0 s presentation rates, SLE patients had fewer dyads (correct consecutive responses) than controls at the faster rate, and more chunking responses than controls at both rates. Disease activity, disease duration, depression, fatigue, and corticosteroids could not account for these differences. The findings suggest that SLE patients, like MS patients, chunk responses more often than controls, and that this scoring procedure may better reflect the working memory and processing speed deficits present in SLE. (JINS, 2004, 10, 35–45.)
Keywords
Information
- Type
- Research Article
- Information
- Journal of the International Neuropsychological Society , Volume 10 , Issue 1 , January 2004 , pp. 35 - 45
- Copyright
- © 2004 The International Neuropsychological Society
INTRODUCTION
Systemic lupus erythematosus (SLE) is a chronic autoimmune disease in which cellular and humoral reactivity to different soft tissues can produce damage to multiple organ systems. A number of SLE patients (ranging between 14–75%) develop overt central nervous system (CNS) disease (Kozora et al., 1996; West et al., 1995) and many SLE patients complain of memory problems and lack of mental sharpness. The reported percentage of patients with CNS involvement varies due to a lack of uniform clinical criteria (Glanz et al., 1997). For example, CNS involvement may encompass a wide range of neurological disturbances from mild headache to stroke, and psychiatric disturbances from mild depression to psychosis (Ainiala et al., 2001; Carbotte et al., 1986; Kozora et al., 1996; West et al., 1995). Generally, SLE patients with overt disturbances in the more severe range of neurologic or psychiatric involvement are now referred to as having neuropsychiatric SLE (NP-SLE) or CNS-SLE, and those without overt symptoms are categorized as “non-CNS” SLE (Ainiala et al., 2001; West et al., 1995). An American College of Rheumatology ad hoc committee (1999) defined 19 NP-SLE syndromes, which are categorized as either central (CNS) or peripheral, and within the CNS category, as focal or diffuse. Cognitive dysfunction and mood disorders are considered diffuse CNS SLE syndromes. However, many SLE patients without any other overt CNS involvement report cognitive difficulties and mild mood disturbances, and these patients are often categorized as non-CNS SLE because of the subtle nature of these disturbances.
Impaired cognition has been reported in SLE using a variety of neuropsychological testing methods (Breitbach et al., 1998; Carbotte et al., 1986; Denburg et al., 1987; Fisk et al., 1993; Hanly et al., 1992; Hay et al., 1992; Kozora et al., 1996; Kutner, 1988; Wekking et al., 1991). The prevalence of cognitive impairment in SLE varies across studies by as much as 21–66% due to variation in testing methods, threshold for positive tests, and sample composition (Denburg et al., 1997; Hanly & Liang, 1997). Despite these differences in the prevalence of cognitive impairment, there is now agreement that a large proportion of SLE patients have at least mild cognitive impairment, even in the absence of recent disease activity and overt neuropsychiatric signs of CNS disease (Carbotte et al., 1986; Denburg et al., 1992; Hanly et al., 1992, 1994; Hay et al., 1992). These subtle cognitive deficits suggest brain involvement and have been estimated to occur in 15 to 38% of “non-CNS” SLE patients (Carbotte et al., 1986; Denburg et al., 1992; Hanly et al., 1992; Hay et al., 1992).
There is some evidence to suggest that the cognitive impairments seen in SLE involve vascular abnormalities in subcortical white matter and/or pathology of subcortical–cortical neural circuits. Recent magnetic resonance imaging (MRI; Chinn et al., 1997; Gonzalez-Crespo et al., 1995) and functional imaging (Kao et al., 1999; Lin et al., 1997; Stoppe et al., 1990; Weiner et al., 2000) studies provide evidence that subcortical systems that connect to prefrontal cortical systems may be involved in the cognitive disturbances seen in SLE. Slowed speed of information processing has been associated with abnormalities in these subcortical circuits (Cummings, 1990; Leritz et al., 2000).
Although neuropsychological studies of SLE do not reveal a consistent profile of cognitive deficits, many of these studies provide support for a pattern of cognitive dysfunction consistent with subcortical brain involvement. For example, the most frequently reported deficits across studies are in the areas of immediate memory or recall, fluency, attention, speed of information processing, and psychomotor speed (Denburg et al., 1987, 1997; Glanz et al., 1997; Kozora et al., 1996, 2001; Skeel et al., 2000). Fisk et al. (1993) found that increased SLE disease activity was related to impaired immediate memory and concentration. Denburg et al. (1997) noted that slowed processing is consistent with a diffuse vasculopathy. Similar results have been reported in asymptomatic HIV-positive patients and these results are also interpreted as subcortical involvement (Grant & Heaton, 1990).
In a recent study by Leritz et al. (2000), a discriminant analysis of non-CNS SLE patients' scores on the Mini-Mental State Examination (MMSE; Folstein et al., 1975) was used to classify patients' profiles as either suggestive of “cortical” or “subcortical” cognitive dysfunction. They found that 95% of the SLE patients' discriminant scores fell in the subcortical range. This pattern of performance is typical of Huntington's disease (Brandt et al., 1988), a known subcortical syndrome, and unlike the cortical dysfunction of Alzheimer's disease. The SLE patients with the most impaired scores were particularly low on serial sevens, a task that places demands on the processes of attention, working memory, and mental tracking, all of which have been linked to connections between the basal ganglia and prefrontal cortex (Leritz et al., 2000).
This “subcortical” pattern is regarded as a hallmark of cognitive dysfunction in multiple sclerosis (MS; Beatty & Scott, 1993; Grafman et al., 1990; Litvan et al., 1988a, 1988b; Rao, 1990, 1996; Rao et al., 1993; Ruchkin et al., 1994). Although the lesions in SLE and MS are likely due to different causative factors, and there is a wide spectrum of brain pathology in both groups, there are some neuropathological similarities between the two diseases. For example, the disease process diffusely affects white matter in MS (Butman & Frank, 2000) and in SLE, as mentioned above (Chinn et al., 1997; Gonzalez-Crespo et al., 1995; Kao et al., 1999; Lin et al., 1997; Stoppe et al., 1990; Weiner et al., 2000). Further, Hanly et al. (1992) reported clinical features suggestive of demyelination in patients with SLE. Therefore, a similar pattern of cognitive deficits might be predicted for both MS and SLE.
Individuals with MS have been shown to have consistently impaired performance on the Paced Auditory Serial Addition Task (PASAT; Gronwall et al., 1977), a speed-dependent continuous performance serial-addition task that is a sensitive measure of working memory, sustained attention, and information processing speed (e.g., DeLuca et al., 1993; D'Esposito et al., 1996; Diamond et al., 1997; Fisk & Archibald, 2001; Litvan et al., 1988b). To perform the PASAT correctly, the respondent must add each number to the number that immediately follows it so that the first number is added to the second number, the second number is added to the third number, the third number to the fourth, and so on. Thus, the respondent is required to comprehend the auditory input, hold one digit in working memory while performing the addition of the two previous numbers, respond verbally and perform at a set pace. The PASAT increases processing demands by increasing the speed of stimulus presentation for each block of trials (Spreen & Strauss, 1991). A total correct score is calculated for each presentation rate separately, and across all presentation rates.
Snyder et al. (1993), in a study of MS patients, observed that participants commonly skipped PASAT items intermittently in order to chunk the presented information into more manageable units. By performing the task in this manner, it becomes easier and less cognitively taxing, while the overall score can still be normal. Thus, scores obtained on the PASAT may not be a valid measure of working memory or speed of information processing if participants are not performing the task correctly.
Following the lead of Snyder et al. (1993), Fisk and Archibald (2001) examined the percentage of total correct responses that were dyads (only answers given consecutively without skipping) for the four presentation rates of the PASAT (2.4, 2.0, 1.6, and 1.2 s rates) between MS patients and a control group. The MS patients had a significantly lower total correct score than controls at the two slowest presentation rates, but the percentage of correct responses that were dyads was lower for MS than controls at all four presentation rates. Dyad percentages decreased for both groups as the presentation rate increased, but more so for the MS group. The decrease in percentage of dyads was interpreted as suggesting increased chunking. The authors concluded that MS patients used a different strategy to perform the task than that required by the instructions, and that the total number of correct responses on the PASAT may not be an accurate measure of working memory.
As pointed out by Fisk and Archibald (2001), while the analysis of dyads reveals a problem inherent with the use of the total number of correct responses, the percentage of correct responses accounted for by dyads (percent dyads) does not reflect overall performance on the task. This percentage score only reflects the proportion of correct responses in which the task was performed according to instructions. The total number of correct responses (which includes dyads and chunking) may be a more representative measure of speed of information processing, whereas, the percent of dyads may be a more accurate measure of the degree to which working memory processes are utilized. The percent of dyads, however, provides only an indirect measure of the number of times that the chunking strategy was performed.
In an extension of this work, Snyder and Cappelleri (2001) and Snyder et al. (2001) both counted the total number of dyads as a more direct measure of accurate PASAT performance. Snyder and Cappelleri (2001) found that the mean of the total number of dyads across PASAT trials correlated with the total area of sclerotic brain lesions in MS patients, and Snyder et al. (2001) reported that the mean total dyad score was able to discriminate relapsing–remitting MS patients from secondary–progressive patients better than the standard PASAT scoring method. No studies to date have analyzed the total number of times chunking occurred in order to determine the role this score may play in the analysis of performance strategies. While dyads reflect correct performance, the total number of chunkings is a more direct measure of the use of a compensatory strategy to obtain a higher score on the PASAT. Thus, the total chunking score could provide additional information to evaluate PASAT performance in patient populations with subtle cognitive deficits.
As mentioned previously, studies of individuals with SLE have shown deficits on tests that place demands on attention, working memory, and speed of information processing (Denburg et al., 1987, 1997; Kozora et al., 1996, 2001). Two studies used the PASAT as part of their battery to test the domain of attention and speed of information processing (Kozora et al., 1996, 2001). Both studies found significantly lower scores in this domain for SLE patients compared to controls. The PASAT scores, however, were averaged with other tests to create a domain score, and thus, performance specific to the PASAT was not included in these studies.
In the present study we hypothesized that SLE patients will exhibit a similar performance bias on the PASAT as that observed in Fisk and Archibald's study of MS patients. This approach should provide information about the more subtle cognitive deficits in WM and speed of information processing thought to be present in SLE. The total number of correct responses, the percentage of total correct responses accounted for by dyads and chunking, total number of dyads, and total number of chunkings were compared between SLE patients and healthy controls to determine (1) if differences are present between the two groups that reflect a working memory deficit in SLE patients, and (2) whether the analysis of the total number of dyads and chunkings provides information useful in discriminating between the groups. We also compared the performance of SLE patients on two working memory span tests with scores on the PASAT to evaluate further the relationship between the PASAT measures and other neuropsychological tests of working memory.
METHODS
Research Participants
The final study sample consisted of 45 SLE patients (44 females and 1 male) and 27 healthy controls (23 females and 4 males). The SLE patients were recruited from area rheumatologists and from advertisement in local newspapers. Those interested in participating were first screened for general selection criteria (including head trauma, neurologic problems, hearing problems, etc.) by using a short phone interview. Medical records were then obtained for all SLE participants who met the phone screening selection criteria and who signed informed consent. The diagnosis of SLE was independently confirmed by a rheumatologist at Buffalo General Hospital, where the study was conducted. All SLE patients in the final sample met the standard diagnostic criteria of four or more of the 1982 American Rheumatism Association revised criteria for SLE (Tan et al., 1982).
All of the SLE patients were classified as non-CNS SLE. Patients with a history of neurologic or psychiatric manifestations as specified by the ACR Ad Hoc Committee (1999), Ainiala et al. (2001), and West et al. (1995) were excluded from the study. These manifestations included cerebrovascular disease, movement disorder, transverse myelitis, seizure, meningitis, organic brain syndrome, intractable/severe headache or migraine, Guillain-Barre syndrome, autonomic disorder, myasthenia gravis, and psychosis. Two exceptions to these exclusionary criteria were made, mood disorder and cognitive dysfunction, which are both considered diffuse CNS syndromes by the ACR Ad Hoc Committee (1999).
Patients with active and inactive disease states at the time of testing were included. Disease activity was based on standardized criteria specified in the Systemic Lupus Activity Measure (SLAM, Liang et al., 1989). For the present study, a disease activity checklist of 19 items was developed that included all of the clinical manifestation categories from the SLAM. If the SLE patient had a SLAM administered by their rheumatologist within 2 weeks prior to neuropsychological testing, the SLAM was used to complete the checklist (n = 11). If a SLAM was not administered within 2 weeks, SLE patients completed the checklist at the time of neuropsychological testing (n = 33). Data were missing for 1 participant. In addition to the checklist, 33 patients recorded their perception of current disease activity on the visual analog scale (VAS) from the SLAM. This scale ranges from zero (no disease activity) to 10 (the most disease activity they have experienced), and it has been shown to have a high correlation with objective testing of disease activity (Liang et al., 1989).
Disease duration was recorded in years from year of diagnosis. Patients were categorized as either experiencing fatigue or not experiencing fatigue based on responses from the disease activity checklist. All current medications were recorded, and history of and recent use of corticosteroids were coded separately. Symptoms of depression were obtained from patients and controls using the Beck Depression Inventory (BDI; Beck, 1987).
The control group consisted of volunteers who were screened for neurological, psychiatric, learning, and general medical disorders. They were matched with the SLE group for age, years of education, and estimated full scale IQ as measured by the WAIS–III Vocabulary and Block Design subtests. Participants in the control and SLE groups were not included in the study if their estimated Full Scale IQ fell below 80. Two SLE participants were excluded based on this IQ criterion. The control group did not complete the working memory span tests administered to the SLE patients, and, thus, scores could not be compared for all of the tests.
Measures
The PASAT was administered using the procedure described by Gronwall (1977). A practice list of 10 numbers recorded at 2.4 s presentation rate was administered first. The PASAT consists of four test trials each at an increasingly faster rate of presentation of numbers (1 number every 2.4, 2.0, 1.6 and 1.0 s). In this study, the PASAT was administered only at the two slowest presentation rates of 2.0 s and 2.4 s. For each trial, the numbers 1 to 9 are presented randomly. A total of 61 numbers are presented in the same random order for each test trial. The numbers are recorded on audiotape. The duration for each number is 0.4 s. The trials were presented to participants via audio tape on a dual speaker tape player at a comfortable listening level adjusted for each participant. The participants were instructed to add the first pair of numbers together and then add the next number presented to the last number heard (not the sum of the two previous numbers), and so on. For example, if the numbers given are “1, 5” the person must add 1 and 5 and answer verbally “6”; if the next number is 8, the subject must then add the 8 to the 5 and answer “13” verbally. The total number correct is scored separately for each trial out of a possible 60 correct responses; the subject must say his/her answer before the next number is given or it is not considered correct. A written demonstration of how to perform the task was presented to the participant. Sample trials continued to be presented until the participant understood how to correctly perform the task. All participants began with the 2.4 s presentation rate and were given a break between trials. They were instructed that the next trial given would be at a faster rate.
Both correct and incorrect answers given by the participants were recorded. The PASAT was then scored for the total number correct, the total number of correct accounted for by dyads, and total number of correct accounted for by chunking. Dyad and chunking scores were calculated following the procedures of Fisk and Archibald (2001). A dyad was scored when two consecutive correct answers were given, including the first pair of numbers given at each presentation rate. The dyads were then tallied and a total dyad score was obtained for each presentation rate. A chunking score was calculated for each presentation rate by counting the number of correct responses that followed a skipped response. Table 1 presents examples for each type of scoring. Seven participants' chunking scores were not included because the experimenter failed to write in both correct and incorrect answers given, which is needed to determine if chunking occurred. The proportion of the total correct responses accounted for by dyads and by chunking were calculated for each participant at both presentation rates [(percent dyad = (total correct dyad score/total correct score) × 100; percent chunking = (total correct chunking score/ total correct score) × 100]. The percent dyad score does not provide a measure of overall performance accuracy on the PASAT, but rather, a measure of the degree to which correct responses reflect performance according to the test instructions (Fisk & Archibald, 2001). For example, Participant 1 may have a higher percentage of dyads than Participant 2, but a lower total correct score than Participant 2. However, the participant with the higher percent dyad score has a greater proportion of responses that were attained performing the task correctly.
PASAT scoring procedure

In addition to the PASAT, all SLE patients completed both the digit span and spatial span subtests of the Wechsler Memory Scale (Wechsler Memory Scale, Third Edition; Wechsler, 1997) as part of a comprehensive neuropsychological examination. Raw scores were converted to standard scores for each subtest based on normative data from the test manual (Wechsler, 1997). The raw scores for the forward and backward measures of each subtest were used in the correlational analyses.
Statistical Analysis
Each of the PASAT scoring measures was compared between the SLE and control groups using independent samples t tests. Unequal sample size was accounted for by using Levene's test for equality of variances. Significance was determined using a two-tailed test with a 95% confidence interval, and a probability level of .025 or less to account for multiple testing (for t tests only). Effect sizes were determined by calculating eta squared (η2), which is an estimate of the proportion of variance of each PASAT score that can be explained by group membership. Correlational analyses were performed among digit and spatial span scores and PASAT scores within the SLE group. One-way analysis of variance (ANOVA) was used to test for PASAT score differences among SLE corticosteroid groups.
RESULTS
Participant Characteristics
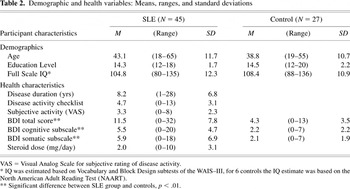
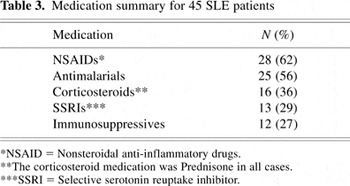
Participant demographics and health-related characteristics can be found in Table 2. Table 3 summarizes the current medications for the SLE group. The control and SLE groups did not differ for age [t(70) = 1.54, n.s.], years of education [t(70) = −.32, n.s.] and estimated full scale intelligence [t(64) = 1.27, n.s.]. For the BDI total scores, 2 SLE patients fell in the lowest end of the severe range, 4 in the moderate range, 5 in the mild range, 12 in the minimal range, and 22 in the normal range. BDI scores differed significantly between the SLE and control groups for the total score and the two subscales.
Demographic and health variables: Means, ranges, and standard deviations

Medication summary for 45 SLE patients

The SLE patients' scores on the disease activity checklist (possible range of 0–19) ranged from zero to 13. Thirty-three patients had a score of 5 or lower, 9 had scores from 6 to 9, and 3 patients had scores from 10 to 13. The clinical manifestations of disease activity experienced by the SLE patients within two weeks of testing are summarized as follows: 80% reported joint pain; 79% fatigue; 58% myalgia; 40% Raynaud's; 18–24% hair loss, fever, oral ulcers, rash, vasculitis, or hypertension; 9–16% lymph, kidney, pulmonary, or gastrointestinal involvement; 2–4% weight loss, eye, liver or spleen involvement, or carditis. The disease activity rating scores were significantly correlated with the subjective disease activity (VAS) ratings (r = .61, p < .001).
Group Differences on the PASAT
The percentage of SLE patients that scored in the impaired range (in excess of 2 SD's of the age-based normative data for the total scores) was 11.1% at the 2.4 s rate and 17.8% at the 2.0 s rate. The control sample did comparatively better with 7.4% scoring in the impaired range at the 2.4 s rate, and 3.7% scoring in the impaired range at the 2.0 s rate. None of the participants in either group had a score of zero for the 2.4 s or 2.0 s rates.
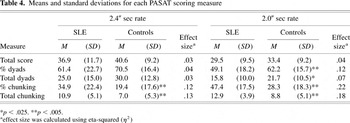
The means, standard deviations, and effect sizes for the five PASAT measures at the two presentation rates for the SLE and control groups are presented in Table 4. Comparison of group differences for the total score of the PASAT revealed that the total number of correct responses did not differ between the SLE and controls at either presentation rate [2.4 s rate: t(70) = −1.4, n.s.; 2.0 s rate: t(70) = −1.7, n.s.].
Means and standard deviations for each PASAT scoring measure

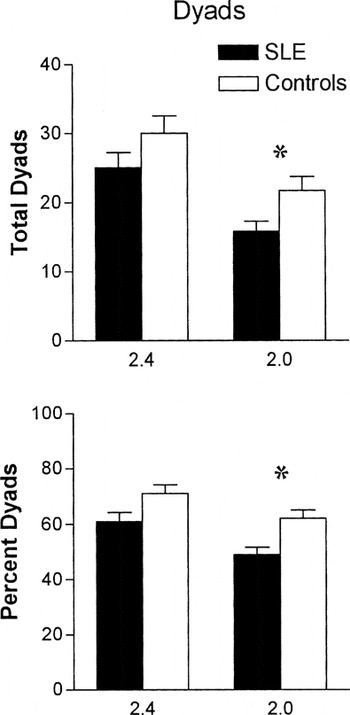
Analysis of the total number of dyads and percent of correct responses accounted for by dyads (% dyads) revealed that there was no difference between SLE and controls at the 2.4 s presentation rate. At the 2.0 s rate, controls had significantly more dyads and a higher percent of dyads [total dyads: 2.4 s rate: t(70) = −1.4, n.s.; 2.0 s rate: t(70) = −2.35, p < .02; percent dyads: 2.4 s rate: t(70) = −1.8, n.s.; 2.0 s rate: t(70) = −3.12, p < .003]. These findings are illustrated in Figure 1.

Comparisons of the means of the total number of dyads (top) and the percentage of dyads (bottom) between SLE and control groups at the 2.4 and 2.0 s presentation rates of the PASAT. The asterisks represent a significant difference between the two groups. Error bars represent the standard error of the mean.
The total number of chunking and the percent chunking scores revealed group differences at both the 2.4 s and 2.0 s presentation rates, with SLE patients having more chunking responses and a higher percent of chunking than controls [total chunking: 2.4 s rate: t(63) = 3.0, p < .004; 2.0 s rate: t(63) = 3.65, p < .001; % chunking: 2.4 s rate: t(63) = 2.97, p < .004; 2.0 s rate: t(63) = 4.24, p < .001]. The findings for chunking scores are presented in Figure 2.

Comparisons of the means of the total number of chunking scores (top) and the percentage of chunking scores (bottom) between the SLE and control groups at both the 2.4 and 2.0 s presentation rates of the PASAT. The asterisks represent a significant difference between the two groups. Error bars represent the standard error of the mean.
The effect size estimates revealed that the largest group differences were obtained for the chunking measures, with moderate effect sizes at the 2.4 s rate and somewhat higher effect sizes at the 2.0 s rate. The percent dyad score revealed a moderate group difference only at the 2.0 s rate, and the total score and total dyads had much smaller group differences at both presentation rates.
An illustration of the proportion of responses that are dyads, chunking, and “other” responses that make up the total correct responses for each group at both presentation rates is presented in Figure 3. The responses scored as “other” are the correct responses that are preceded by an incorrect response (see Table 1). Thus, the “other” responses are preceded by responses in which the participant adds the numbers incorrectly but is still attempting to perform the task correctly.

Comparisons of the means of the total correct scores of the PASAT between the SLE and control groups at the 2.4 and 2.0 presentation rates. Each bar represents the number of dyad, chunking, and “other” scores that comprise the total correct scores for the SLE and control groups at each presentation rate.
Separate analyses were performed to determine the possible effects of depression, fatigue, disease duration, disease activity, and current corticosteroid dosage on PASAT performance. SLE patients were divided into “low” and “high” groups for each measure. For the BDI, the low group had scores 9 or less (the normal range, n = 23) and the high group had scores 10 or more (minimal to low end of severe range, n = 22). For fatigue, the low group had no fatigue on the disease activity checklist (n = 9) and the high group reported fatigue (n = 35). The disease duration low group had SLE 5 years or less (n = 19), and the high group 6 years or more (n = 26). For disease activity, the low group had checklist scores of 4 symptoms or less (n = 23), and the high group 5 symptoms or more (n = 21). For current corticosteroid usage, the low group was not on steroids (n = 29), and the high group was on a dosage of 1 mg/day or more (n = 16). Comparisons (t tests) of PASAT total, dyad, and chunking scores between the low and high depression (BDI), fatigue, disease duration, disease activity, and corticosteroid groups did not yield significant differences.
To test for possible effects of a chronic history of corticosteroid use on PASAT performance, SLE patients were separated into four groups based on overall history of use since diagnosis: (1) never used (n = 6), (2) mild steroid use for flare-ups (1–3 times; n = 10), (3) moderate steroid use only during flare-ups (4+ times; n = 14), and (4) heavy use, with periods of consistent use of steroids on a daily or every-other day basis, with higher doses during flare-ups (n = 13). One-way analyses of variance showed no significant differences in PASAT scores (total, percent chunking, percent dyads) among the four history of corticosteroid use groups.
Digit Span/Spatial Span Comparisons with PASAT Scores for SLE Group
The Digit and Spatial Span data were available only for the SLE group. The mean standard scores on these subtests fell within the normal range for age-based norms. Table 5 presents correlations between the forward and backward raw scores for both span tests and PASAT scoring measures for the SLE group. Two patterns are apparent from these correlations. First, the 2.4 s rate PASAT measures produced more correlations with the span measures than did the 2.0 s rate measures. The percent dyads and percent chunking scores correlated significantly with all four span measures at this presentation rate. Second, the backward scores, but not the forward scores for both span tests consistently produced significant correlations with the PASAT measures, with the highest correlations present between PASAT measures at the 2.0 s rate and Spatial Span backward.
Correlations among PASAT scores and Span scores, SLE only

DISCUSSION
The findings of the present study support Fisk and Archibalds' (2001) concern that limitations are present in the PASAT as a measure of working memory when the traditional scoring method is used. The total score of the PASAT may not be an accurate reflection of underlying impairments in working memory and speed of information processing due to compensatory approaches that can be adopted to perform the task. Fisk and Archibald (2001) examined the percentage of the total correct score that was accounted for by dyads (percent dyads), and subsequently, Snyder et al. (2001) and Snyder and Cappelleri (2001) included a total dyad score to evaluate PASAT performance in MS patients. These studies concluded that the analysis of dyads, as opposed to traditional scoring procedures, was better able to differentiate PASAT performance of MS patients and controls.
In our study, in addition to the percent dyad score, we calculated the total number of dyads (total dyads). We also determined the percentage of the total score accounted for by chunking (percent chunking), and the total number of times that chunking occurred (total chunking). Our findings revealed that no differences were present at either the 2.4 or 2.0 presentation rates between the SLE and control groups when the traditional PASAT scoring method was used (total score). The percent dyad and total dyad scores revealed group differences only at the 2.0 s rate, with SLE patients having a significantly lower percentage of dyads and total number of dyads at this rate. Both the percent chunking and total chunking scores, however, produced significant group differences at the 2.4 and 2.0 s PASAT presentation rates. The SLE patients had a higher percentage of the total score accounted for by chunking and a higher total chunking score than controls at both rates (see Figure 2). These findings could not be accounted for by current levels of depression, fatigue, disease activity, or steroid dosage in the SLE group.
It is interesting to note, as seen in Figure 3, that the combined total of dyad and chunking scores for the SLE and control groups was almost identical at both presentation rates even though the proportion of each type of score differed between the groups. Controls, however, had more than twice as many “other” responses than SLE patients. Because an “other” response must be preceded by an incorrect response, this increase in “other” responses by controls suggests that they made more errors in an attempt to perform the task according to instructions. Although differences in the total score were not present between groups in our study, the “other” responses may be important to consider in studies in which group differences are present. For example, the reported differences in the total score between MS patients and controls at the two slowest presentation rates in Fisk and Archibald's study (2001) may have occurred not only because controls had significantly more total dyads that made up the total score, but because they made more incorrect responses followed by a correct response (“other” response). If a greater number of “other” responses were present for controls, it may suggest that they attempted to maintain a performance set of responding to as many items as possible, thus maintaining a greater working memory burden.
Previous studies of PASAT strategy and scoring problems (Fisk & Archibald, 2001; Snyder & Cappelleri, 2001; Snyder et al., 1993, 2001) are consistent with our findings. The PASAT is designed to measure both working memory (where the subject has to hold the previous digit to be added to the next) and information processing (addition of two numbers). A third component that is also evident is speed of information processing due to the timed requirements of the test. If the PASAT is performed correctly, it assesses working memory functioning, however, it is also a test of information processing speed or efficiency (Fisk & Archibald, 2001). When efficient processing of information is present, a total PASAT score in the normal range reflects normal working memory functioning. As efficiency of information processing decreases, the total PASAT score can remain in the normal range when respondents adopt a chunking strategy to avoid the working memory demands of the task. In our study, we demonstrated that the direct measures of chunking, both the total chunking and percent chunking scores, consistently yielded the greatest effect sizes at both the 2.4 s and 2.0 s presentation rates. While the effect sizes for the chunking scores are modest, ranging from 12 to 22% of the variance accounted for by group membership, this amount of variance is more impressive given that the SLE group did not differ from the controls for the total PASAT score at either presentation rate. Effect sizes would be predictably larger between two groups with more divergent cognitive ability. Thus, the chunking scores appear to be sensitive to working memory deficits in patient groups, such as SLE, in which cognitive deficits are generally more subtle.
Comparison of the span test measures with PASAT scores within the SLE group revealed that correlations were present between PASAT measures and span measures, and more so for the backward version of both Digit Span and Spatial Span. This pattern of correlations suggests that deficits in established measures of working memory and information processing (i.e., Digit Span and Spatial Span) are associated with deficits on the PASAT measures of this study. Further, the percent dyads and percent chunking may be the most sensitive measures of working memory processes, particularly at the 2.4 s presentation rate. Of specific importance are the negative correlations between chunking scores and digit span and spatial span scores. These findings indicate that chunking, as hypothesized, is related to poorer working memory ability.
The possible effect of corticosteroid use on PASAT performance was also examined. Some previous studies not related to SLE have reported detrimental but inconsistent effects of steroids on brain functioning and cognition (Joels et al., 1997; Lupien & McEwen, 1997; Wolkowitz et al., 1997). A number of SLE studies, however, have found no effects of corticosteroid use or dosage on cognition (Carbotte et al., 1986; Glanz et al., 1997; Hay et al., 1992; Kozora et al., 1996). Interestingly, Denburg et al. (1994) showed that a brief exposure of a low corticosteroid dosage in SLE had a positive effect on cognition in SLE patients (Denburg et al., 1994). Consistent with these previous SLE studies, we found that neither the degree of chronicity of corticosteroid use nor the current use of corticosteroids had an effect on PASAT performance in SLE patients. It should be noted, however, that while a number of patients had a history of chronic steroid usage, the dosage at the time of testing did not exceed 10 mg/day for any patients. In addition to the absence of effects of corticosteroid use on PASAT performance, the lower PASAT dyad and chunking scores for the SLE group could not be accounted for by disease duration, disease activity, depression, or fatigue.
In summary the findings of our study suggest that MS and SLE patients have similar cognitive deficits as measured by the PASAT, and that they compensate for these deficits in a similar way. It has been previously shown that healthy controls chunk items on the PASAT as reflected by the percentage of correct responses that are dyads, and this percentage decreases as the presentation rate of the PASAT increases (Fisk & Archibald, 2001; Snyder et al., 1993). The MS and SLE groups both showed a significant reduction in the percentage of dyads compared to controls, even at the two slowest presentation rates. We further demonstrated that the chunking scores reflected performance differences between SLE and controls more accurately than the dyad scores. The processing speed and WM deficits of MS are thought to result from damage to subcortical areas of the brain and their connections to the frontal lobes (Gonzales et al., 1994; Raine, 1990; Sibley 1990; Swirsky-Sacchetti et al., 1992). Leritz et al. (2000) reported cognitive findings in SLE that also support a subcortical model of deficits. The similarity in the deficits on the PASAT between MS and SLE patients suggests that the brain systems involved in working memory and speed of information processing may be implicated in both diseases.
ACKNOWLEDGMENTS
This project was supported in part by a grant from the Oishei Foundation (P.I.J. Ambrus, Jr.). We would like to thank the participants who volunteered their time for this project. We would also like to thank Noemi Voelker for her assistance with the manuscript.
References
REFERENCES
ACR Ad Hoc Committee on Neuropsychiatric Lupus Nomenclature.
(1999).
The American College of Rheumatology nomenclature and case
definitions for neuropsychiatric lupus syndromes.
Arthritis and Rheumatism,
42,
599–608.Google Scholar
Ainiala, H.,
Loukkola, J.,
Peltola, J.,
Korpela, M., &
Hietaharju, A.
(2001).
The prevalence of neuropsychiatric syndromes on systemic lupus
erythematosus.
Neurology,
57,
496–500.CrossRefGoogle Scholar
Beatty, W.W. &
Scott, J.G.
(1993).
Issues and developments in the neuropsychological assessment of
patients with multiple sclerosis.
Journal of Neurologic Rehabilitation,
7,
87–97.Google Scholar
Beck, A.T.
(1987).
Beck Depression Inventory: Manual.
San Antonio, TX:
The Psychological Corporation.
Brandt, J.,
Folstein, S.E., &
Folstein, M.F.
(1988).
Differential cognitive impairment in Alzheimer's disease and
Huntington's disease.
Annals of Neurology,
23,
555–561.Google Scholar
Breitbach, S.A.,
Alexander, R.W.,
Daltroy, L.H.,
Liang, M.H.,
Boll, T.J.,
Karlson, E.W.,
Partridge, A.J.,
Roberts, W.N.,
Stern, S.H.,
Wacholtz, M.C., &
Straaton, K.V.
(1998).
Determinants of cognitive performance in systemic lupus
erythematosus.
Journal of Clinical and Experimental Neuropsychology,
20,
157–166.CrossRefGoogle Scholar
Butman, J.A. &
Frank, J.A.
(2000).
Overview of imaging in multiple sclerosis and white matter diseases.
Neuroimaging Clinics of North America,
10,
669–687.Google Scholar
Carbotte, R.M.,
Denburg, S.D., &
Denburg, J.A.
(1986).
Prevalence of cognitive impairment in systemic lupus erythematosus.
Journal of Nervous and Mental Disease,
174,
357–364.CrossRefGoogle Scholar
Chinn, R.J.S.,
Wilkinson, I.D.,
Hall-Cragge, M.A.,
Paley, M.N.J.,
Shortall, E.,
Carter, S.,
Kendall, B.E.,
Isenberg, D.A.,
Newman, S.P., &
Harrison, M.J.G.
(1997).
Magnetic resonance imaging of the brain and cerebral proton
spectroscopy in patients with systemic lupus erythematosus.
Arthritis and Rheumatism,
40,
36–46.Google Scholar
Cummings, J.
(1990).
Introduction. In
J.L. Cummings (Ed.),
Subcortical dementia, (pp.
3–16).
New York:
Oxford University Press.
DeLuca, J.,
Johnson, S.K., &
Natelson, B.H.
(1993).
Information processing efficiency in chronic fatigue syndrome, and
multiple sclerosis.
Archives of Neurology,
50,
301–304.CrossRefGoogle Scholar
Denburg, S.D.,
Carbotte, R.M., &
Denburg, J.A.
(1987).
Cognitive impairment in systemic lupus erythematosus: A
neuropsychological study of individual and group deficits.
Journal of Clinical and Experimental Neuropsychology,
9,
323–339.CrossRefGoogle Scholar
Denburg, S.D.,
Carbotte, R.M., &
Denburg, J.A.
(1992).
Cognitive deficit in nonneuropsychiatric SLE (fact or fiction?).
Arthritis and Rheumatism,
35
(Suppl.),
s208.Google Scholar
Denburg, S.D.,
Carbotte, R.M., &
Denburg, J.A.
(1994).
Corticosteroids and neuropsychological functioning in patients with
systemic lupus erythematosus.
Arthritis and Rheumatism,
37,
1311–1320.Google Scholar
Denburg, S.D.,
Carbotte, R.M.,
Ginsberg, J.S., &
Denburg, J.A.
(1997).
The relationship of antiphospholipid antibodies to cognitive
function in patients with systemic lupus erythematosus.
Journal of the International Neuropsychological Society,
3,
377–386.Google Scholar
D'Esposito, M.,
Onishi, K.,
Thompson, H.,
Robinson, K.,
Armstrong, C., &
Grossman, M.
(1996).
Working memory impairment in multiple sclerosis: Evidence from
dual-task paradigm.
Neuropsychology,
10,
51–56.Google Scholar
Diamond, B.J.,
DeLuca, J.,
Kim, H., &
Kelley, S.M.
(1997).
The question of disproportional impairments in visual and auditory
information processing in multiple sclerosis.
Journal of Clinical and Experimental Neuropsychology,
19,
34–42.CrossRefGoogle Scholar
Fisk, J.D.,
Eastwood, B.,
Sherwood, G., &
Hanly, J.G.
(1993).
Patterns of cognitive impairment in patients with systemic lupus
erythematosus.
British Journal of Rheumatology,
32,
458–462.CrossRefGoogle Scholar
Fisk, J.D. &
Archibald, C.J.
(2001).
Limitations of the Paced Auditory Serial Addition Test as a measure
of working memory in patients with multiple sclerosis.
Journal of the International Neuropsychological Society,
7,
363–372.CrossRefGoogle Scholar
Folstein, M.F.,
Folstein, S.E., &
McHugh, P.R.
(1975).
Mini-mental state: A practical method for grading the cognitive
state of patients for the clinician.
Journal of Psychiatric Research,
12,
189–198.CrossRefGoogle Scholar
Glanz, B.I.,
Slonim, D.,
Urowitz, M.B.,
Gladman, D.D.,
Gough, J., &
MacKinnon, A.
(1997).
Pattern of neuropsychologic dysfunction in inactive systemic lupus
erythematosus.
Neuropsychiatry, Neuropsychology and Behavioral Neurology,
10,
232–238.Google Scholar
Gonzales, C.F.,
Swirsky-Sacchetti, R.,
Mitchell, D.,
Lublin, F.D.,
Knobler, R.L., &
Erlich, S.M.
(1994).
Distributional patterns of multiple sclerosis brain lesions.
Journal of Neuroimaging,
4,
188–195.Google Scholar
Gonzalez-Crespo, M.R.,
Blanco, F.J.,
Ramos, A.,
Ciruelo, E.,
Mateo, I.,
Lopez Pino, M.A., &
Gomez-Reino, J.J.
(1995).
Magnetic resonance imaging of the brain in systemic lupus
erythematosus.
British Journal of Rheumatology,
34,
1055–1060.Google Scholar
Grafman, J.,
Rao, S.M., &
Litvan, I.
(1990).
Disorders of memory. In
S.M. Rao (Ed.),
Neurobehavioral aspects of multiple sclerosis (pp.
102–117).
New York:
Oxford University Press.
Grant, I. &
Heaton, R.K.
(1990).
Human immunodeficiency virus-type 1 (HIV-1) and the brain.
Journal of Consulting and Clinical Psychology,
58,
22–30.CrossRefGoogle Scholar
Gronwall, D.M.
(1977).
Paced auditory serial addition task: A measure of recovery from
concussion.
Perceptual and Motor Skills,
44,
367–373.Google Scholar
Hanly, J.G.,
Fisk, J.D.,
Sherwood, G., &
Eastwood, B.
(1994).
Clinical course of cognitive dysfunction in systemic lupus
erythematosus.
Journal of Rheumatology,
21,
1825–1831.Google Scholar
Hanly, J.G.,
Fisk, J.D.,
Sherwood, G.,
Jones, E.,
Jones, J.V., &
Eastwood, B.
(1992).
Cognitive impairment in patients with systemic lupus erythematosus.
Journal of Rheumatology,
19,
562–567.Google Scholar
Hanly, J.G. &
Liang, M.H.
(1997).
Cognitive disorders in systemic lupus erythematosus: Epidemiologic
and clinical issues.
Annals of the New York Academy of Sciences,
823,
60–68.CrossRefGoogle Scholar
Hay, E.M.,
Black, D.,
Huddy, A.,
Creed, F.,
Tomenson, B.,
Bernstein, R.M., &
Holt, P.J.
(1992).
Psychiatric disorder and cognitive impairment in systemic lupus
erythematosus.
Arthritis and Rheumatism,
35,
411–416.CrossRefGoogle Scholar
Joels, M.,
Karten, Y.,
Hesen, W., &
de Kloet, E.R.
(1997).
Corticosteroid effects on electrical properties of brain cells:
Temporal aspects and role of antiglucocorticoids.
Psychoneuroendocrinology,
22
(Suppl. 1),
S81–S86.Google Scholar
Kao, C.H.,
Ho, Y.J.,
Lan, J.L.,
Changlai, S.P.,
Liao, K.K., &
Chieng, P.U.
(1999).
Discrepancy between regional cerebral blood flow and glucose
metabolism of the brain in systemic lupus erythematosus patients with
normal brain magnetic resonance imaging findings.
Arthritis and Rheumatism,
42,
61–68.3.0.CO;2-9>CrossRefGoogle Scholar
Kozora, E.,
Thompson, L.L.,
West, S.G., &
Kotzin, B.L.
(1996).
Analysis of cognitive and psychological deficits in systemic lupus
erythematosus patients without overt central nervous system
disease.
Arthritis and Rheumatism,
39,
2035–2045.CrossRefGoogle Scholar
Kozora, E.,
Laudenslager, M.,
Lemieux, A., &
West, S.G.
(2001).
Inflammatory and hormonal measures predict neuropsychological
functioning in systemic lupus erythematosus and rheumatoid arthritis
patients.
Journal of the International Neurospychological Society,
7,
745–754.CrossRefGoogle Scholar
Kutner, K.C.,
Busch, H.M.,
Mahmood, T.,
Racis, S.P., &
Krey, P.R.
(1988).
Neuropsychological functioning in systemic lupus erythematosus.
Neuropsychology,
2,
119–126.Google Scholar
Leritz, E.,
Brandt, J.,
Minor, M.,
Reis-Jensen, F., &
Petri, M.
(2000).
“Subcortical” cognitive impairment in patients with
systemic lupus erythematosus.
Journal of the International Neuropsychological Society,
6,
821–825.CrossRefGoogle Scholar
Liang, M.H.,
Socher, S.A.,
Larson, M.G., &
Schur, P.H.
(1989).
Reliability and validity of six systems for the clinical assessment
of disease activity in Systemic Lupus Erythematosus.
Arthritis and Rheumatism,
32,
1107–1118.CrossRefGoogle Scholar
Lin, W.Y.,
Wang, S.J.,
Yen, T.C., &
Lan, J.L.
(1997).
Technetium-99m-HMPAO brain SPECT in systemic lupus erythematosus
with CNS involvement.
Journal of Nuclear Medicine,
38,
1112–1115.Google Scholar
Litvan, I.,
Grafman, J.,
Vendrell, P., &
Martinez, J.
(1988a).
Slowed information processing in multiple sclerosis.
Archives of Neurology,
45,
281–285.Google Scholar
Litvan, I.,
Grafman, J.,
Vendrell, P.,
Martinez, J.M.,
Junque, C.,
Vendrell, J.M., &
Barraquer-Bordas, L.
(1988b).
Multiple memory deficits in patients with multiple sclerosis:
Exploring the working memory system.
Archives of Neurology,
45,
607–610.Google Scholar
Lupien, S.J. &
McEwen, B.S.
(1997).
The acute effects of corticosteroids on cognition: Integration of
animal and human model studies.
Brain Research–Brain Research Reviews,
24,
1–27.Google Scholar
Raine, C.S.
(1990).
Neuropathology. In
S.M. Rao (Ed.),
Neurobehavioral aspects of multiple sclerosis (pp.
15–36).
New York:
Oxford University Press.
Rao, S.M. (Ed.).
(1990).
Neurobehavioral aspects of multiple sclerosis.
New York:
Oxford University Press.
Rao, S.M.
(1996).
White matter disease and dementia.
Brain and Cognition,
31,
250–268.CrossRefGoogle Scholar
Rao, S.M.,
Grafman, J.,
Diguilio, D.,
Mittenberg, W.,
Bernardin, L.,
Leo, G.J.,
Luchetta, T., &
Univerzagt, F.
(1993).
Memory dysfunction in multiple sclerosis: Its relation to working
memory, semantic encoding and implicit learning.
Neuropsychology,
7,
364–374.CrossRefGoogle Scholar
Ruchkin, D.S.,
Grafman, J.,
Krauss, G.L.,
Johnson, R., Jr.,
Canoune, H., &
Ritter, W.
(1994).
Event-related potential evidence for a verbal working memory
deficit in multiple sclerosis.
Brain,
117,
289–305.CrossRefGoogle Scholar
Sibley, W.A.
(1990).
The diagnosis and course of multiple sclerosis. In
S.M. Rao (Ed.),
Neurobehavioral aspects of multiple sclerosis (pp.
5–14).
New York:
Oxford University Press.
Skeel, R.L.,
Johnstone, B.,
Yangco, D.T., Jr.,
Walker, S.E., &
Komatireddy, G.R.
(2000).
Neuropsychological deficit profiles in systemic lupus erythematosus.
Applied Neuropsychology,
7,
96–101.Google Scholar
Snyder, P.J.,
Aniskiewicz, A.S., &
Snyder, A.M.
(1993).
Quantitative MRI correlates and diagnostic utility of multi-modal
measures of executive control in multiple sclerosis.
Journal of Clinical and Experimental Neuropsychology,
15,
18.Google Scholar
Snyder, P.J. &
Cappelleri, J.C.
(2001).
Information processing speed deficits may be better correlated with
the extent of white matter sclerotic lesions in Multiple Sclerosis than
previously suspected.
Brain and Cognition,
46,
279–284.CrossRefGoogle Scholar
Snyder, P.J.,
Cappelleri, J.C.,
Archibald, C.J., &
Fisk, J.D.
(2001).
Improved detection of differential information-processing speed
deficits between two disease-course types of Multiple Sclerosis.
Neuropsychology,
15,
617–625.CrossRefGoogle Scholar
Stoppe, G.,
Wildhagen, K.,
Seidel, J.W.,
Meyer, G.J.,
Schober, O.,
Heintz, P.,
Kunkel., H.,
Deicher, H., &
Hundeshagen, H.
(1990).
Positron emission tomography in neuropsychiatric lupus
erythematosus.
Neurology,
40,
304–308.CrossRefGoogle Scholar
Spreen, O. &
Strauss, E.
(1991).
A compendium of neuropsychological tests.
New York:
Oxford University Press.
Swirsky-Sacchetti, T.,
Mitchell, D.R.,
Seward, J.,
Gonzales, C.,
Lublin, F.,
Knobler, R., &
Field, H.L.
(1992).
Neuropsychological and structural brain lesions in multiple
sclerosis: A regional analysis.
Neurology,
42,
1291–1295.CrossRefGoogle Scholar
Tan, E.M.,
Cohen, A.S.,
Fries, J.F.,
Massi, A.T.,
McShane, D.J., &
Rothfield, N.F.
(1982).
The 1982 revised criteria for the classification of systemic lupus
erythematosus.
Arthritis and Rheumatism,
25,
1271–1277.Google Scholar
Wechsler, D.
(1997).
Wechsler Memory Scale–Third Edition administration and
scoring manual.
San Antonio, TX:
The Psychological Corporation.
Weiner, S.M.,
Otte, A.,
Schumacher, M.,
Klein, R.,
Gutfleisch, J.,
Brink, I.,
Otto, P.,
Nitzsche, E.U.,
Moser, E., &
Peter, H.H.
(2000).
Diagnosis and monitoring of central nervous system involvement in
systemic lupus erythematosus: Value of F-18 fluorodeoxyglucose PET.
Annals of Rheumatic Diseases,
59,
377–385.CrossRefGoogle Scholar
Wekking, E.M.,
Nossent, J.C.,
Van Dam, A.P., &
Swaak, A.J.
(1991).
Cognitive and emotional disturbances in systemic lupus
erythematosus.
Psychotherapy and Psychosomatics,
55,
126–131.CrossRefGoogle Scholar
West, S.G.,
Emlen, W.,
Wener, M.H., &
Kotzin, B.L.
(1995).
Neuropsychiatric lupus erythematosus: A 10 year prospective study
on the value of diagnostic tests.
American Journal of Medicine,
99,
153–163.CrossRefGoogle Scholar
Wolkowitz, O.M.,
Reus, V.I.,
Canick, J.,
Levin, B., &
Lupien, S.
(1997).
Glucocorticoid medication, memory and steroid psychosis in medical
illness.
Annals of the New York Academy of Sciences,
823,
81–96.Google Scholar

PASAT scoring procedure
Demographic and health variables: Means, ranges, and standard deviations
Medication summary for 45 SLE patients
Means and standard deviations for each PASAT scoring measure
Comparisons of the means of the total number of dyads (top) and the percentage of dyads (bottom) between SLE and control groups at the 2.4 and 2.0 s presentation rates of the PASAT. The asterisks represent a significant difference between the two groups. Error bars represent the standard error of the mean.
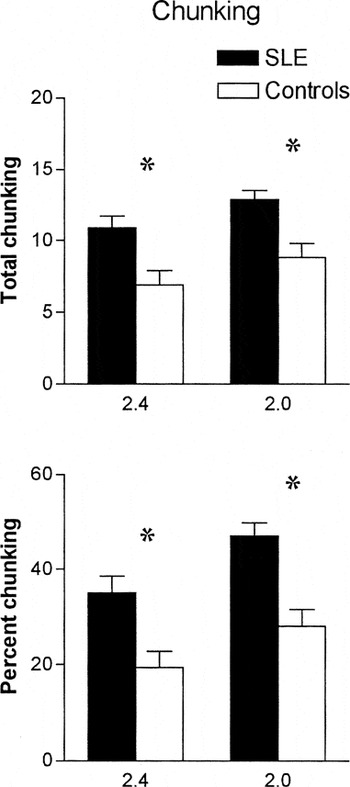
Comparisons of the means of the total number of chunking scores (top) and the percentage of chunking scores (bottom) between the SLE and control groups at both the 2.4 and 2.0 s presentation rates of the PASAT. The asterisks represent a significant difference between the two groups. Error bars represent the standard error of the mean.
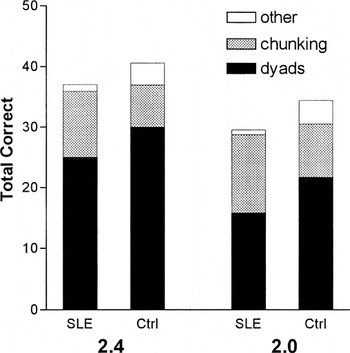
Comparisons of the means of the total correct scores of the PASAT between the SLE and control groups at the 2.4 and 2.0 presentation rates. Each bar represents the number of dyad, chunking, and “other” scores that comprise the total correct scores for the SLE and control groups at each presentation rate.
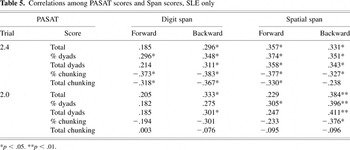
Correlations among PASAT scores and Span scores, SLE only
 You have
Access
- 47
- Cited by