Introduction
The pupillary light reflex (PLR) is a fundamental autonomic reflex that varies the size of the pupil according to the intensity of light entering the eye. Although the PLR has been extensively studied in mammals, the reflex exhibits unusual characteristics in reptilian species that remain poorly understood. For example, the PLR in the turtle was initially thought not to exist (Walls, Reference Walls1942), even though the relevant efferent pathway had been previously identified (Iske, Reference Iske1929). Pupil changes were thought to be governed by simple accommodative movement of the lens. More recent investigation established that the turtle in fact has a motile pupil responsive to varying light intensities over a four-log range and involves feedback from multiple photoreceptor classes (Granda et al., Reference Granda, Dearworth, Kittila and Boyd1995). A distinctive characteristic of the turtle PLR is its sluggish dynamics, with maximum constriction requiring between 5 and 10 min following exposure to light and as long as 30 min to return to maximum size in the dark. It is not known if this slowness in turtle results primarily from photoreceptive mechanisms or from characteristics of the neural signaling of the efferent pathway driving iris constriction.
To obtain a better understanding of the PLR in turtle, in vivo studies have reexamined the efferent pathway and have identified receptor types at the neuromuscular junction used to control the iris. Application of the nicotinic cholinergic antagonist vecuronium bromide to the corneas of the eyes causes mydriasis, and the muscarinic cholinergic antagonist atropine does not (Dearworth et al., Reference Dearworth, Cooper and McGee2007). Rate of mydriasis also is enhanced when the α1 adrenergic agonist phenylephrine is combined with vecuronium bromide, indicating a sympathetic influence on the parasympathetic pathway (Dearworth & Cooper, Reference Dearworth and Cooper2008). Based on the receptor types used by the iris, these studies suggest an efferent control that is less similar to mammals and now instead more similar to birds (Loerzel et al., Reference Loerzel, Smith, Howe and Samuelson2002) but do not provide much insight regarding how the efferent pathway could be involved in generating the slow response in turtles.
In the present study, we investigated pupillary responses in the turtle evoked by electrical stimulation of the short ciliary nerve and compared responses to those generated by stimulating the oculomotor nerve (nIII). This permitted us to quantify the dynamic performance of the pupil and investigate transformation of contractile drive interposed at the ciliary ganglion. Additionally, because of the pond turtle’s remarkable resistance to hypoxia (Lutz & Milton, Reference Lutz and Milton2004; Storey, Reference Storey2007), tissues of this species can remain viable in vitro for several hours, which facilitates systematic investigation. This allowed us to study the mechanism of pupillary constriction in a highly controlled fashion, in the absence of retinal feedback, preferentially activating a pure efferent parasympathetic response.
Materials and methods
Animals
Animal care and all experimental procedures were approved by the Institutional Animal Care and Use Committee at the Lafayette College. Red-eared slider turtles, Trachemys scripta elegans, both male and female, weighing between 0.3 and 2.5 kg, with carapace lengths between 10 and 25 cm, were purchased from Kons Scientific Co., Inc. (Germantown, WI). Turtles were housed in a warm animal suite containing two 60-gallon tubs equipped with brick islands for sunning under 250-W infrared lights. The environment was maintained on a 14/10-h light/dark cycle with water temperature at 22°C. Lights were turned on at 6:00 am and turned off at 8:00 pm. A radiometer (model DR-2000-LED; Gamma Scientific, San Diego, CA) measured radiant intensity at 3.86 × 10⁻² W/cm2/sr. The tanks equipped with filtering systems were cleaned weekly, and turtles were fed ad libitum every other day.
Dissection of nIII and ciliary nerve
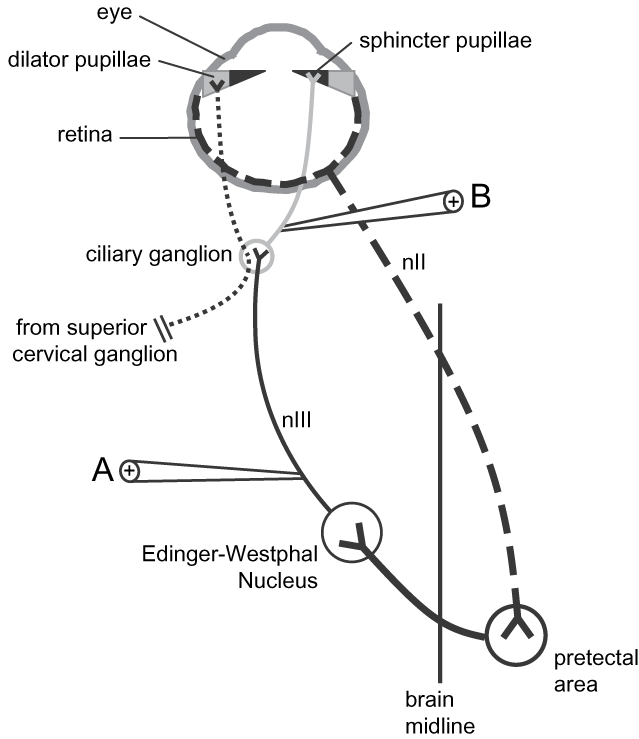
Turtles were cryoanesthetized (Maxwell, Reference Maxwell, Harless and Morlock1979; Keifer & Houk, Reference Keifer and Houk1991; Fan et al., Reference Fan, Scudder and Ariel1997) at 4°C for 60 min and euthanized by decapitation. After decapitation, dorsal cranial bones and connective tissues were quickly dissected, and the brain removed after carefully cutting both nIIIs at their attachment to the brain stem. The nerves were cleared of connective tissue in preparation for stimulation at the preganglionic site (site “A” in Fig. 1), and the upper and lower eyelids were also removed from the orbits to optimize the camera view of the pupil. The cranial cavity was submerged in physiological media (in mM: 96.5 NaCl, 2.6 KCl, 2.0 MgCl2, 31.5 NaHCO3, 20.0 d-glucose, and 4.0 CaCl2), bubbled with 95%/5% O2/CO2, and maintained at room temperature.
Circuitry controlling the PLR in vertebrate animals. In isolated head preparations, the eye and orbit were kept intact, and the brain removed from the cranial cavity exposing the oculomotor nerve (nIII) for preganglionic stimulation (site A). Pupil constriction was evoked postganglionically in enucleated eyes by stimulating the short ciliary nerve distal to the ciliary ganglion (site B).

In other preparations, the eye was enucleated from the orbit, and the short ciliary nerves were stimulated to examine and compare the responses evoked directly via the postganglionic site (site “B” in Fig. 1). Dorsal portions of the orbits were carefully removed to expose the ciliary ganglion. Ciliary nerves were transected slightly distal to the ciliary ganglion, and the eye was taken out of the orbit. The eye was anchored in a dish at the posterior temporal pole of the eye. The preparation was perfused with bubbled physiological media, with preparations remaining responsive for up to 36 h when maintained under these conditions. Although preparations were observed to be responsive for this extended period, all the data were from fresh preparations collected shortly after dissections and from experiments completed during the light phase of the cycle used for housing the turtles.
Stimulation
Suction electrodes (A-M Systems, Carlsborg, WA) were used for nerve stimulation. Electrode tips were made from capillary glass, having 1.0 mm outer diameter and 0.5 mm inner diameter, and fire polished to different tip sizes to accommodate either the nIII or the transected end of the ciliary nerve. Care was taken to ensure precise fits for delivery of consistent current amounts, allowing adequate comparison among different preparations.
Pupil responses were evoked using two extremes of stimulation: 100-Hz trains or single pulses, applied either to nIII or postganglionically at the ciliary nerve. A stimulator with an isolation unit (Grass model S88 and PSIU6; Astro-Med, Inc., West Warwick, RI) was used to deliver constant current single pulses or spike trains referenced to a silver chlorided wire placed into the bath or pinned into connective or muscle tissue. Output of the stimulator was stored in a computer using a real-time analog to digital voltage interface controlled by a commercial eye tracking system (ViewPoint EyeTracker®; Arrington Research, Inc., Scottsdale, AZ) for subsequent analysis.
Pupillometry
Pupil size was recorded by an infrared-sensitive camera fitted with an infrared light-emitting diode at a viewing distance of 12 cm. The video signal was delivered to a computer running the eye tracking system. Horizontal pupil diameter was tracked by thresholding on the dark pupil with a resolution of 0.03 mm. The system was calibrated using a metric ruler placed in the focal plane of the imaged pupil.
Data analysis
Data collected by the eye tracking software were imported into Microsoft® Excel (Microsoft Corporation, Redmond, WA), and SigmaPlot (SPSS, Inc., Chicago, IL) was used for analysis. To compare responses across preparations, data were normalized as percent changes in pupil diameter. Analysis of variance (ANOVA) or t-tests were used for statistical comparison.
Current threshold and maximal responses were determined by fitting Hill equations to the data (Gamlin et al., Reference Gamlin, McDougal, Pokorny, Smith, Yau and Dacey2007). Equations define a sigmoid curve, y = axb/(cb + xb), fitted to responses (y) obtained at increasing current intensity (x), where a gives the maximum pupillary constriction, b is a constant, and c is the threshold current, which produces half-maximal constriction.
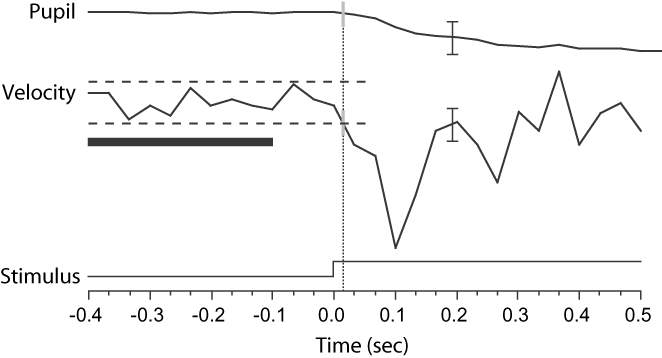
To avoid arbitrary assignment, response onset was defined quantitatively when pupil velocity exceeded 2 standard deviations (s.d.) from an average baseline calculated from data collected during a time period before the stimulus (Fig. 2). Baseline was calculated from the time period occurring 300 ms before the stimulus. In some cases when greater sensitivity of response onset was necessary, 1 s.d. was used. In the example shown in Fig. 2, latency was identified when the velocity deviated more than −0.32 mm/s from the average baseline marked as 16 ms after stimulus.
Definition of response latency using velocity of pupil size change. Latency (gray vertical lines connected with dotted lines) was identified when the velocity deviated more than 2 s.d. (±0.32 mm/s, black dashed horizontal parallel lines) from the average baseline, here marked as 16 ms after stimulus. Baseline was calculated from the velocity data occurring 300 ms before the stimulus (black horizontal bar). Black vertical scale bars = 0.25 mm and 0.50 mm/s. Example shows a response from an enucleated eye after stimulating the short ciliary nerve.

Rates for pupil changes in response to stimulations were determined by time constant equations (Granda et al., Reference Granda, Dearworth, Kittila and Boyd1995; Clarke, Reference Clarke2007; Dearworth et al., Reference Dearworth, Cooper and McGee2007; Dearworth & Cooper, Reference Dearworth and Cooper2008). Pupillary constriction was determined by fitting data with a decay time constant equation, y = y 0 + a (e−t/τ), where y is pupil size, y 0 is the offset pupil size, a is the amplitude of pupillary constriction, t is time, and τ is the time constant. Relaxation, the rate of return to baseline after stimulation, was determined using a rise-to-maximum time constant equation, y = y 0 + a (1 − e−t/τ).
In vivo pupillometry
The PLR was measured in alert behaving animals for direct comparison with pupil dynamics observed in vitro. Turtles were secured in a restraint that immobilized head movements. Heads were positioned at the center of a light-integrating sphere of 40 cm diameter, and the pupils monitored through small apertures by infrared-sensitive cameras set at an angle of 35 deg to the longitudinal axis of the turtle. Light adaptation came from a 150-W tungsten lamp mounted behind the turtle’s line of sight. Intensity was measured by a radiometer and converted to units of retinal irradiance equal to 2.92 × 10⁻¹² J/μm2/s using the derivation by Dvorak et al. (Reference Dvorak, Granda and Maxwell1980) and the schematic of the turtle eye (Northmore & Granda, Reference Northmore and Granda1991). Animals were acclimated to the setup for at least 10 min before the experiments began. Measures from pupils were taken for 10 min in the light and continued after shuttering the light off for 40 min. After adaptation to the dark, the light was shuttered back on and pupils measured for another 14 min. Because of the slower nature of the response, measurements were taken only at every 2 min. Additional measures 30 s just after shuttering the light on and off also were taken.
Results
Responses from the short ciliary nerve and nIII stimulations
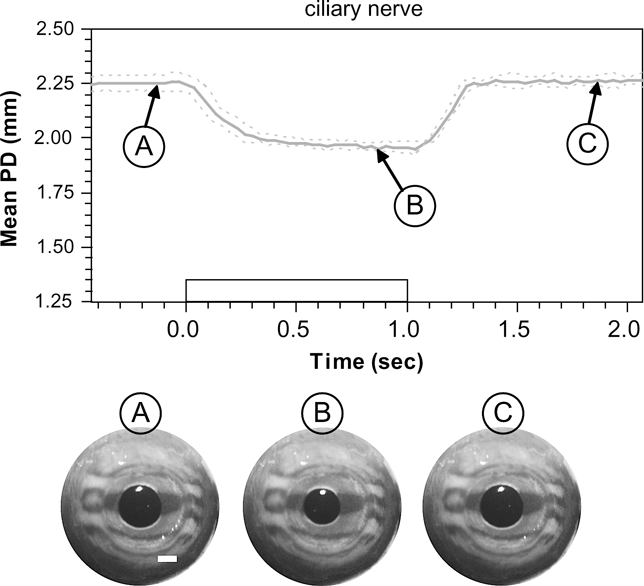
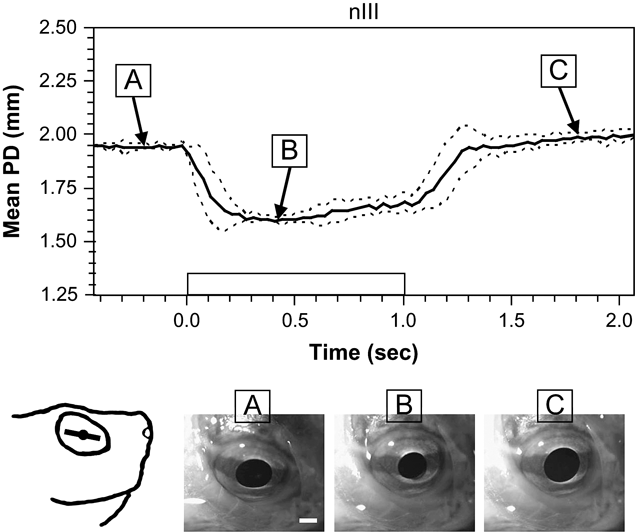
Representative examples of pupil constrictions measured in an isolated eye after stimulating the short ciliary nerve and in the isolated head after stimulating nIII are shown in Figs. 3 and 4, respectively. The stimulus was a 1-s train of 1-ms pulses with 50 μA amplitude at 100 Hz. The solid traces in Figs. 3 and 4 are the mean response averaged over six trials in one preparation, with dashed lines showing ±1 s.d. Constriction in the isolated eye began 34 ± 28 ms (±s.d.) after the onset of stimulation and continued for the duration of the train, reducing mean pupil diameter from 2.25 ± 0.04 to 1.95 ± 0.02 mm. Stimulation generated sustained constriction, which was reached approximately 400 ms after stimulus onset. After termination of the pulse train, the pupil returned to its initial size, with recovery occurring over approximately 300 ms (Supplemental Movie 1). Constriction following nIII stimulation in the isolated head preparation was similar to that observed in the enucleated eye but was accompanied with other eye movements such as adduction, extorsion, elevation, depression, and/or retraction (Supplemental Movie 2). In the example shown, constriction onset occurred 46 ± 58 ms (±s.d.) and reduced the mean pupil diameter from 1.95 ± 0.01 to 1.60 ± 0.01 mm.
Example of pupil constriction in the enucleated eye evoked by stimulation of the short ciliary nerve. Gray trace is the mean pupil diameter (PD) from six stimulations in one preparation, and dashed lines show ±1 s.d. Rectangular waveform on the x-axis denotes onset and offset of a 100-Hz train of 1-ms pulses with amplitude of 50 μA. At bottom are still frames of a representative trial showing eye before (A), during (B), and after stimulation (C). Mean PD was reduced from 2.25 ± 0.04 to 1.95 ± 0.02 mm. White scale bar = 1 mm.

Example of pupil constriction evoked by stimulating the oculomotor nerve (nIII) in the whole-head preparation. Parameters of stimuli are the same as described in Fig. 3. Data shown are mean response from six stimulations in one preparation. Sketch at lower left shows orientation of the iris line in the eye prior to stimulation (after Brown Reference Brown1969; Rodieck Reference Rodieck1998), and images at bottom show still frames from a representative trial before (A), during (B), and after stimulation (C). Mean pupil diameter (PD) was reduced from 1.95 ± 0.01 to 1.60 ± 0.01 mm.

Quantification of responses
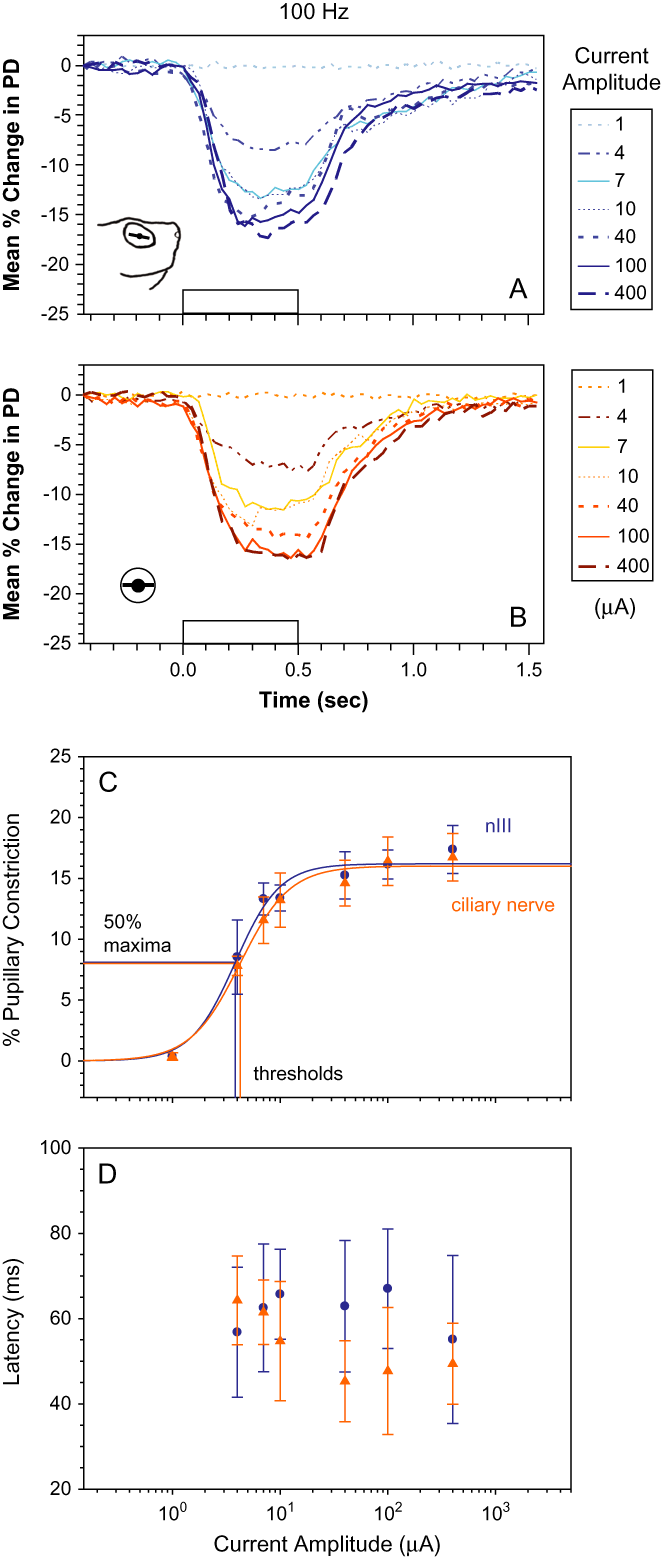
Fig. 5 shows responses to nIII (Fig. 5A) or ciliary nerve (Fig. 5B) stimulation using 100-Hz trains of 0.5-s duration. In Fig. 5A, normalized responses to nIII stimulation are plotted for the series of increasing current amplitudes indicated in the legend to the right of the traces. Each trace depicts mean responses from five preparations. Error bars are omitted from the figure for clarity. Peak pupil constrictions differed significantly as a function of current amplitudes (ANOVA, P < 0.001) with a maximal constriction of 17.4 ± 2.0% [± standard error (s.e.)] observed at 400 μA. Responses are plotted on a semilogarithmic axis and fitted using Hill equations, which predict a maximum constriction of 16.2 ± 0.56% and threshold current of 3.8 ± 0.41 μA (Fig. 5C, blue circles and traces).
Quantification of responses to 100-Hz stimulation. Mean pupil constrictions evoked by stimulating nIII (A) or the short ciliary nerve (B) using 0.5-s current trains with 1-ms pulses. Current levels are indicated in legend at right. Traces show mean response from five preparations, with stimulus presented twice at each current level. (C) Peak of mean constriction from nIII (blue circles), or ciliary nerve stimulation (orange triangles) plotted as a function of the current amplitude on a log scale. Hill equations were fit to results for nIII (blue curve: a = 16.2 ± 0.56%, ±s.e., b = 2.1 ± 0.46, and c = 3.8 ± 0.41 μA, r 2 = 0.98) and the ciliary nerve (orange curve: a = 16.0 ± 0.49%, b = 1.9 ± 0.34, and c = 4.2 ± 0.39 μA, r 2 = 0.99). Maxima, a, constants, b, and threshold currents, c, are closely matched for stimulations. (D) Mean response latencies plotted as a function of current amplitude. These exhibited no statistically significant differences. PD, pupil diameter.

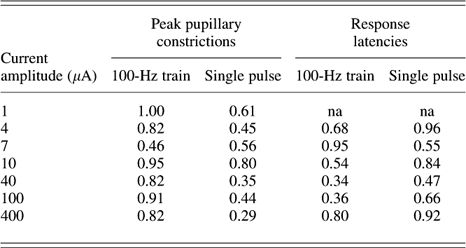
Responses evoked by identical stimulation of the short ciliary nerve in five enucleated eye preparations are shown in Fig. 5B. A maximal pupil constriction of 16.7 ± 2.0% was obtained at 400 μA, and again, pupil constriction differed significantly with current amplitudes (ANOVA, P < 0.001). A maximum response of 16.0 ± 0.49% and a threshold current of 4.2 ± 0.39 μA were predicted by Hill equations (Fig. 5C; orange triangles and traces) and nearly matched the values derived for response to nIII stimulation. Results of t-tests (Table 1) also showed that peak pupil constrictions from ciliary nerve and nIII stimulations were not significantly different from each other when compared at each of the current amplitudes (P > 0.05).
P values of t-tests comparing peak pupillary constrictions and response latencies by preganglonic (nIII) and postganglionic (ciliary nerve) stimulations

Latencies not measurable at subthreshold current. na, not available.
Response latencies to 100-Hz stimulation are shown in Fig. 5D. For nIII stimulation, latencies ranged from a high of 67 ± 14 ms at 100 μA to a low of 55 ± 20 ms at 400 μA, but these differences were not statistically different (ANOVA, P = 0.99). For stimulation of the ciliary nerve, latencies ranged from 45 ± 9.5 ms at 40 μA to 64 ± 10 ms at 4 μA but again did not differ significantly with current amplitude (P = 0.77). Paired t-tests (Table 1) showed that latencies of ciliary nerve and nIII stimulations also were not significantly different from each other at each of the applied current amplitudes (P > 0.05).
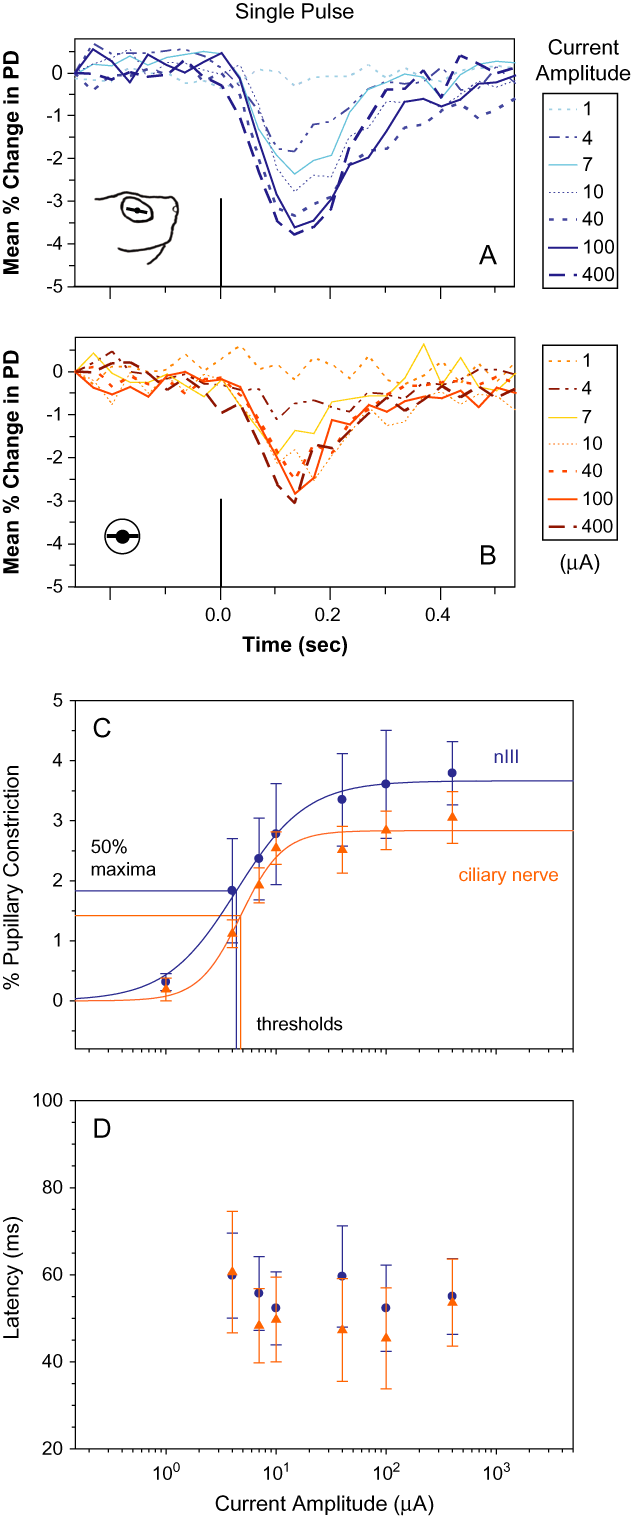
Responses evoked using single current pulses are shown in Fig. 6. Mean responses to nIII and ciliary nerve stimulations are shown in Fig. 6A and 6B, respectively, with current amplitude indicated to the right of the traces. Constriction evoked by single pulses was approximately 20% of that obtained using 100-Hz train stimulation reaching maxima of 3.8 ± 0.53% for nIII and 3.1 ± 0.43% for ciliary nerve at 400 μA. These differed statistically with current amplitudes, ANOVA (P < 0.05), as was observed using train stimulation. Results of t-tests for single-pulse stimulations also indicated that peak pupil constrictions from ciliary nerve and nIII stimulations were not significantly different from each other (P > 0.05) when compared at each current amplitude (Table 1). Maximum constrictions predicted by Hill equations fit to the data were 3.7 ± 0.089% for nIII stimulation (Fig. 6C, blue circles and traces) and 2.8 ± 0.13% for ciliary nerve stimulation (Fig. 6C, orange triangles and traces). Threshold currents were similar to those observed for 100-Hz trains and were computed to be 4.8 ± 0.53 μA for ciliary nerve and 4.4 ± 0.35 μA for nIII.
Quantification of responses evoked by single 1-ms current pulses. Mean pupil constriction from 10 stimulations, two each from five preparations, evoked by single pulse at nIII (A) and the ciliary nerve (B). (C) Peaks of mean constriction from nIII (blue circles) and the ciliary nerve stimulations (orange triangles) plotted versus current amplitude and fitted with Hill equations. Preganglionic stimulation (blue curve): a = 3.7 ± 0.089%, ±s.e., b = 1.4 ± 0.16, and c = 4.4 ± 0.35 μA, r 2 = 0.99. Postganglionic stimulation (orange curve): a = 2.8 ± 0.13%, b = 2.3 ± 0.61, and c = 4.8 ± 0.53 μA, r 2 = 0.97. Threshold values overlapped with those determined after stimulation with 100-Hz trains. (D) Response latency plotted as a function of current amplitude. As was the case for 100-Hz stimulation, these exhibited no statistically significant differences. PD, pupil diameter.

Mean latencies of observed responses to single pulses ranged from 45 ± 12 to 61 ± 14 ms (Fig. 6D), but just as for the 100-Hz stimulations, latencies did not differ significantly with current amplitude. This was true for both nIII (ANOVA, P = 0.99) and ciliary nerve (P = 0.94) stimulations. Mean latencies of the two groups compared at different current amplitudes again did not differ significantly from each other (Table 1).
Time constants
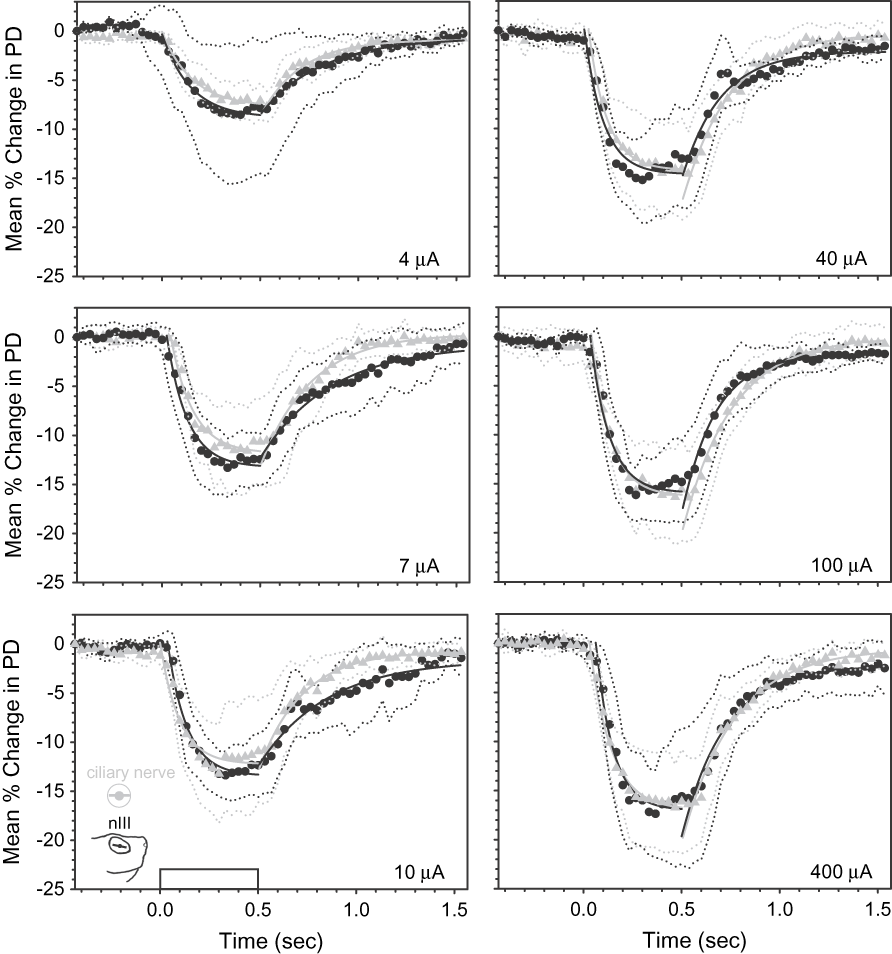
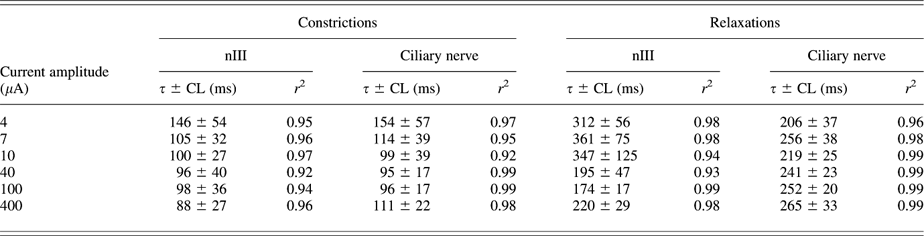
The temporal dynamics of the in vitro PLR were quantified by fitting exponential curves to the constriction and relaxation (return to baseline) of responses evoked by 100-Hz train stimulation. In Fig. 7, mean responses ± 95% confidence limit (CL) from ciliary nerve stimulations (gray triangles with gray dotted lines) are plotted together with responses obtained using nIII stimulations (black circles with black dotted lines) for each current amplitude. Instead of traces, individual data points are plotted in the figure for easier comparison to the fitted exponential curves. As shown, there is substantial overlap of the responses, and statistical testing found no significant differences. Time constant (τ) values ranged from 88 ± 27 ms (±CL) at 400 μA to 146 ± 54 ms at 4 μA and were comparable to those determined from ciliary nerve stimulations: 95 ± 17 ms at 40 μA to 154 ± 57 ms at 4 μA (Table 2). All fits of time constant curves closely matched the data having r 2 values not less than 0.92.
Time constant (τ) equations computed for pupil constrictions and relaxations in enucleated eyes (gray curves) and isolated heads (black curves) using current amplitudes of 4, 7, 10, 40, 100, and 400 μA by fitting exponential curves to the data. Table 2 shows τs and r 2 for the fits. Gray triangles and dotted lines are means ± 95% CLs evoked after stimulating ciliary nerves in enucleated eyes. Black circles and dotted lines are means ± CL evoked after stimulating nIII in isolated heads. PD, pupil diameter.

Time constants for pupillary constrictions and relaxations evoked after 0.5-s 100-Hz trains
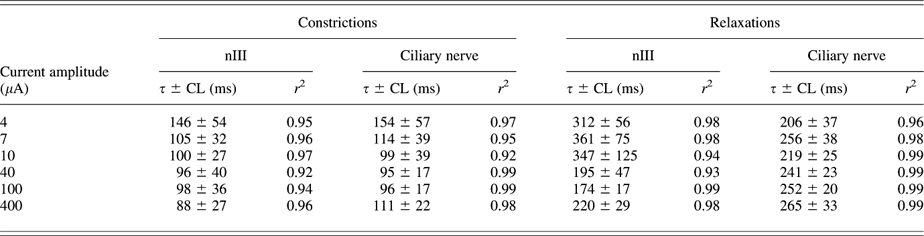
Time constants for relaxation ranged from 174 ± 17 ms at 100 μA to 361 ± 75 ms at 7 μA for nIII stimulations, roughly twice the magnitude of values obtained for constriction. For ciliary nerve stimulations, time constants ranged from 206 ± 37 ms at 4 μA to 265 ± 33 ms at 400 μA.
Sustained constriction
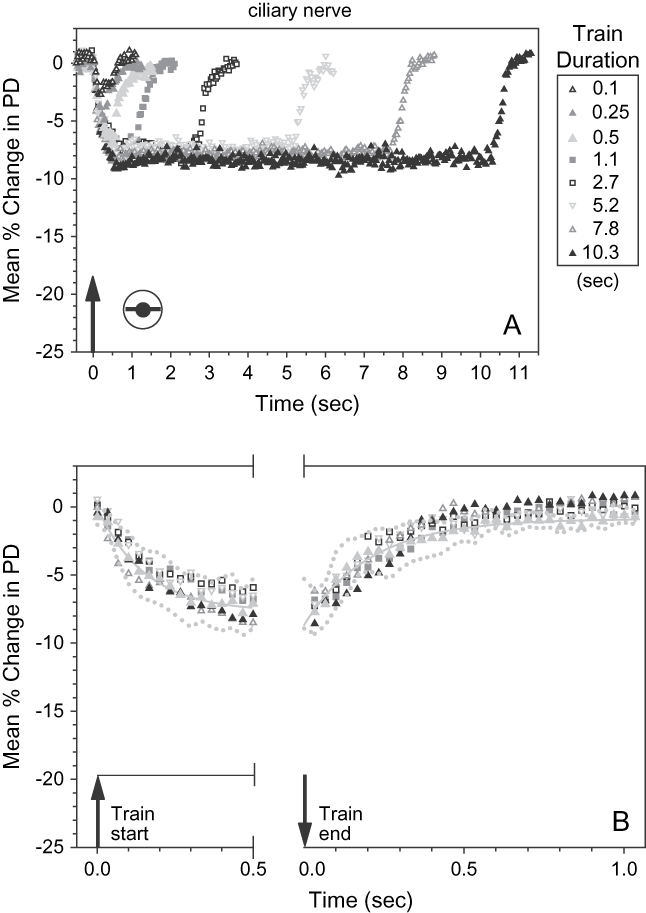
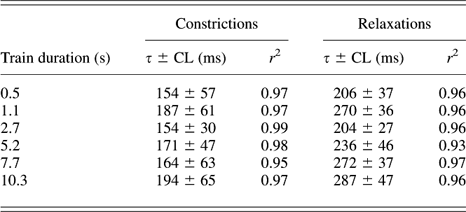
Pupil constriction evoked by prolonged stimulation was examined to further test the performance of contraction under in vitro conditions. The data shown in Fig. 8A depict responses to 100-Hz stimulation of the ciliary nerve (pulse width: 1 ms; amplitude: 4 μA) with stimulus duration ranging from 0.1 to 10.3 s (indicated to the right of the plot). Each plot is the mean response from four preparations. s.e. bars were omitted for clarity as in previous figures, and individual data points are plotted for easier comparison of the responses to different stimulus durations and the exponential fits. Duration stimuli of 0.1 and 0.25 s were insufficient in generating maximal constrictions, but at stimulus durations of 0.5 s and greater, the timing of constriction and relaxation was qualitatively similar. There was rapid onset of pupil constriction following stimulation, and pupil diameter rapidly returned to baseline when stimuli were terminated. Notably, constriction was sustained throughout the duration of stimulation without apparent fatigue.
(A) Sustained pupillary constriction evoked by prolonged stimulation of the ciliary nerve. Stimulation was 100-Hz trains of 1-ms pulses with 4 μA amplitude, with stimulus duration indicated to the right of the plot. Data points show mean responses from four preparations, each response average from eight stimulus repetitions for a given stimulus duration. Arrow on time axis shows stimulus onset. (B) Data points from constriction and relaxation phases from (A) superimposed on the exponential curve fitted to response using 0.5-s stimulation (gray trace). Dotted lines are 95% CLs. Note that these enclose almost all the other data points. PD, pupil diameter.

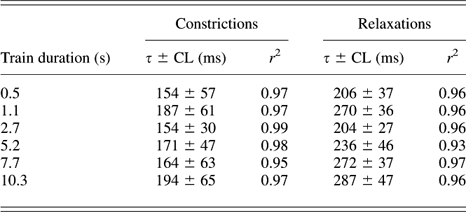
Time constants were determined as before for pupil constrictions and relaxations. Timing of constrictions ranged from 154 ± 30 ms (±CL) for duration of 2.7s to 194 ± 65 ms for duration of 10.3 s (Table 3). Relaxations ranged from a low of 204 ± 27 ms to a high of 287 ± 47 ms but otherwise similar to the timing of constrictions that did not differ statistically from those measured for 0.5-s stimulation. In Fig. 8B, constriction and relaxation evoked using 0.5-s trains with their corresponding exponential curve fits are superimposed on those evoked by durations of longer stimulation. Gray dotted envelopes are plus or minus the CL for the mean responses evoked using 0.5-s stimuli. The majority of data for the stimuli of longer durations fall within the envelopes.
Time constants for pupillary constrictions and relaxations evoked after different train durations
In vivo PLR
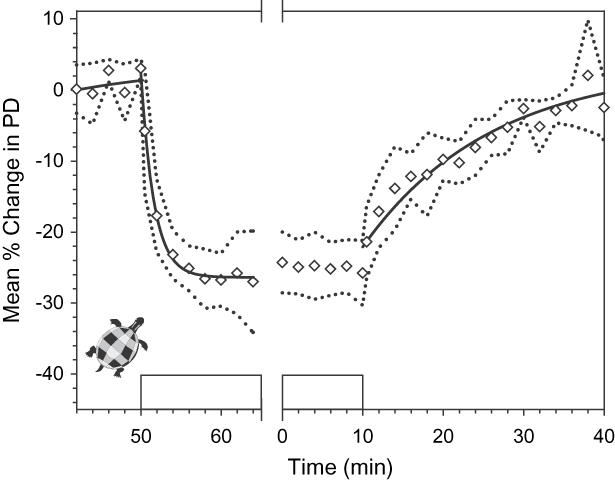
Light-evoked pupil constriction was measured in the intact animal for direct comparison with the electrically evoked pupil responses recorded in vitro. Fig. 9 shows the PLR measured in left and right eyes from six animals. The pattern of light stimulation presented in real time during the experiment is shifted to match the sequence for current stimulations. A maximal pupil constriction of 27.1 ± 7.1% (±CL) occurred approximately 5 min after light onset, with pupil size gradually returning to baseline after approximately 30 min in the dark. Time constants of exponential curves fitted to constriction and dilation had values 1.66 ± 0.10 min (±CL), r 2 = 1.00, and 15.87 ± 2.94 min, r 2 = 0.95, respectively.
The light-evoked PLR recorded in vivo. Data points indicate mean percent constriction measured in left and right eyes in six animals (n = 12) with 95% CL indicated by dotted lines. Starting at time 0 min on the x-axis, pupil responses were tracked for 10 min in light, 40 min in the dark, and then again for 14 min after return to light. For better comparison to the results obtained by current stimulations, the pattern of light stimulation was shifted to show the sequence: light off/light on/light off. Mean pupil diameter (PD) in the dark at 42 min in metric units was 3.06 ± 0.11 mm, ±CL, relatively larger than starting values for the enucleated eye and the isolated head (cf. Figs. 3 and 4) and in the light was reduced to a minimum of 2.19 ± 0.23 mm. Rectangular waveform on the x-axis (boxes) denotes onset and offset of the light at a retinal irradiance of 2.92 × 10⁻¹² J/μm2/s. Pupil constriction occurred approximately 5 min after light onset with τ = 1.66 ± 0.10 min, ±CL, r 2 = 1.00. Diameter returned to baseline after approximately 30 min in the dark with τ = 15.87 ± 2.94 min, r 2 = 0.95. Black curves are time constant equations fit to data for constriction and the return to baseline.

Discussion
Electrical stimulation of the efferent pathway of the PLR evoked rapid pupil constriction, exhibiting a mean onset ranging from 45 to 67 ms (Fig. 5D) and peak constriction occurring within as little as 400 ms (Fig. 5A). These results are in agreement with current stimulation studies done in rodent (Clarke, Reference Clarke2007), pig (Schaeppi & Koella, Reference Schaeppi and Koella1964), cat (Schaeppi et al., Reference Schaeppi, Rubin and Koella1966; Hultborn et al., Reference Hultborn, Mori and Tsukahara1978), and primate (Jampel, Reference Jampel1962; Törnqvist, Reference Törnqvist1970; Westheimer & Blair, Reference Westheimer and Blair1973; Pong & Fuchs, Reference Pong and Fuchs2000) and match best the behavior of those for bird, which show the fastest response dynamics (Pilar & Vaughan, Reference Pilar and Vaughan1969a,Reference Pilar and Vaughanb). Shorter latencies and faster dynamics by the sphincter pupillae in avian species are thought partly to be attributed to its striated composition, which is supported by its block of contraction by nicotinic cholinergic antagonists, a property recently demonstrated in the turtle (Dearworth et al., Reference Dearworth, Cooper and McGee2007).
Time constants for pupil constriction and relaxation obtained in these experiments ranged from 88 to 154 and 174 to 361 ms, respectively (Table 2; Fig. 7). These values reflect temporal dynamics several orders of magnitude faster than that of the light-evoked response in intact turtles, 1.66 min for constriction and 15.87 min for dilation (Fig. 9), and are comparable to the observations reported in Granda et al. (Reference Granda, Dearworth, Kittila and Boyd1995). In fact, the in vitro response more closely approximates PLR dynamics observed in mammalian species. Time constants of 0.3–1.5 s (constriction) and 0.9–2.5 s (relaxation) have been reported for light-evoked responses in cat (Smith et al., Reference Smith, Masek, Ichinose, Watanabe and Stark1970). In rat, mean values reported for constriction and relaxation time constants are 1.41 and 6.97 s, respectively (Clarke, Reference Clarke2007). Taken together, these results suggest that the sluggish pupil dynamics observed in the turtle are not due to limitations imposed by the ciliary ganglion or the contractile mechanism of the iris.
Pupil diameter was reduced by more than 17% by electrical stimulation (Fig.. 5A). This value is notably less than the ~27% light-evoked constriction observed in vivo (Fig. 9). The source of the 10% discrepancy between the in vitro and the in vivo responses is not clear. Prolonged stimulation evoked sustained pupil constrictions for up to ~10 s without fatigue or failure (Fig. 8), suggesting that the briefer (0.5 s) stimuli used for systematic quantification of the pupil response (Fig.s. 5 and 6) should not have taxed the sphincter muscle beyond its capabilities. However, a lack of dilator control may be responsible for the effect. In the intact turtle, the baseline pupil size is determined by a balance of parasympathetic and sympathetic drive to the intraocular musculature (Dearworth & Cooper, Reference Dearworth and Cooper2008). The latter is absent in the in vitro preparation. A logical consequence of the loss of dilator drive would be a reduction in baseline pupil size, a hypothesis supported by larger baseline pupil diameters observed in the intact animal. As such, the 10% deficit in maximum pupil constriction observed in these experiments occurs because the baseline pupil is already partially constricted under in vitro conditions. It should be noted that an absence of dilator drive would not bias the constricted pupil size as this signal is inhibited during the PLR (Lowenstein & Loewenfeld, Reference Lowenstein and Loewenfeld1950a,Reference Lowenstein and Loewenfeldb; Loewenfeld, Reference Loewenfeld1958; Nisida et al., Reference Nisida, Okada and Nakano1960; Passatore & Pettorossi, Reference Passatore and Pettorossi1976; McDougal & Gamlin, Reference McDougal, Gamlin, Masland, Albright, Basbaum, Shepherd and Westheimer2008). Indeed, the effect of dilator drive was inadvertently demonstrated in enucleated eye preparations in the present study. Sometimes, the long ciliary nerve was mistakenly selected for stimulation as this nerve runs through the ciliary ganglion after leaving the superior cervical ganglion (Fig. 2). Such stimulation-evoked pupil dilation (Supplemental Movie 3) suggests that any tonic drive supplied by this pathway would result in a larger baseline pupil diameter.
Signal transformation at the ciliary ganglion
There exists ample physiological evidence that an interposed synapse at the ciliary ganglion participates in the PLR (Loewenfeld, Reference Loewenfeld1993; Gamlin, Reference Gamlin, Burnstock and Sillito2000, Reference Gamlin2005; Kardon, Reference Kardon, Miller, Newman, Biousse and Kerrison2005; McDougal & Gamlin, Reference McDougal, Gamlin, Masland, Albright, Basbaum, Shepherd and Westheimer2008). The decreased effectiveness of high-frequency stimulation when applied to preganglionic sites via the nIII compared to postganglionic sites via the ciliary nerve has been cited as functional evidence (Westheimer & Blair, Reference Westheimer and Blair1973; Clarke, Reference Clarke2007). As the frequency of nIII stimulation increases, the pupil becomes progressively more difficult to drive due to a putative increase of synaptic transmission failures.
We did not systematically explore such frequency effects in the present study. However, it is notable that single-pulse stimulation evoked a larger pupil constriction when applied to nIII than when the ciliary nerve was directly stimulated (Fig. 6C). The effect at any single current amplitude is not significant, but the entire nIII response does appear to be shifted upward, as can be seen from a comparison of the Hill equation fit to each data set. The effect is not apparent when 100-Hz train stimulation was used, which may have equally saturated the pre- and postganglionic responses for a given current level and thus occluded any response differential. Nonetheless, this result is consistent with the presence of an interposed synapse at the ganglion and further permits a tentative hypothesis that the role of the ganglion is to amplify the incoming efferent signal. It may be possible to test for such amplification directly in the in vitro preparation by simultaneous recording of the population volley at pre- and postganglionic sites following nIII pulse stimulation.
Source of the sluggish PLR in turtle
These results indicate that the sluggish PLR of the turtle is not due to limitations imposed by the efferent arm of the reflex. As such, the slow dynamics must reflect features of transduction or central processing. Whole-cell recordings in the brain stem nuclei of this species (Kogo & Ariel, Reference Kogo and Ariel1997; Jones & Ariel, Reference Jones and Ariel2008) have reported no unusual intrinsic cellular properties that might suggest that central processing exhibits unusual temporal dynamics in this species. It seems to us that signal transduction in the retina is a more likely source, perhaps mediated by a specialized receptor class. One possible candidate is intrinsically photosensitive retinal ganglion cells (ipRGC) expressing the photopigment melanopsin (Provencio et al., Reference Provencio, Jiang, De Grip, Hayes and Rollag1998, Reference Provencio, Rodriguez, Jiang, Hayes, Moreira and Rollag2000; Berson et al., Reference Berson, Dunn and Takao2002; Warren et al., Reference Warren, Allen, Brown and Robinson2003). These have been implicated in PLR control (Lucas et al., Reference Lucas, Douglas and Foster2001) mediating slow sustained pupil responses that may be obscured by faster rod and cone feedback (Gamlin et al., Reference Gamlin, McDougal, Pokorny, Smith, Yau and Dacey2007; Young & Kimura, Reference Young and Kimura2008). Although ipRGC have yet to be demonstrated in the turtle, melanopsin has recently been found in the retina of reptiles (Frigato et al., Reference Frigato, Vallone, Bertolucci and Foulkes2006). Establishing a role of ipRGC in the sluggish PLR of the turtle would provide a better understanding of the reflex and may shed light on the elaboration of pupil control in higher species compared to evolutionarily older animals. We are currently pursuing this line of investigation.
Acknowledgments
The authors thank Mrs. Paulette McKenna in this study for secretarial support and Mr. Phil Auerbach for technical support. The authors also thank Dr. Michael Ariel (Saint Louis University School of Medicine) for introducing us to the in vitro isolated head preparation and helpful comments on the article. Funding to support this collaboration was provided by the Department of Biology (Robert S. Chase Fund), the Academic Research Committee, and the Neuroscience Program at the Lafayette College.