Autism (or autistic disorder) is a behaviorally defined, pervasive neurodevelopmental disorder characterized by a triad of deficits: (a) impairments in social interactions; (b) delays in and absences of communicative skills; and (c) restricted interests and stereotyped, repetitive behaviors, as well as a distinctive developmental course with an onset no later than first 2 to 3 years of life (American Psychiatric Association, 1994). Kanner originally described the disorder in 1943 upon seeing it in a set of 11 young patients in his clinic. His characterization of the disorder highlighted two common threads: “(a) the children's inability from the beginning of life to relate themselves to people and situations in the ordinary way, and (b) an anxiously obsessive desire for the preservation of sameness” (Kanner, Reference Kanner1971, p. 140). The vast amount of heterogeneity within each symptom domain is one of the most scientifically challenging features of autism. Social deficits may range from a complete lack of interest in engaging with others to more subtle difficulties managing the complex back and forth of social interactions requiring comprehension of context and intentions. Communication deficits can be profound, as exhibited by individuals with autism who lack basic speech abilities, or the deficits can be relatively subtle (e.g., limited to the presence of pragmatic language deficits). Repetitive and stereotyped actions may range from complex and elaborate rituals, accompanied by “meltdowns” or failures of emotion regulation when these procedures are interrupted, to simple motor tics, compulsions, and a preference for consistency. In addition to the heterogeneity in these three key symptom domains, there is also considerable variability in intelligence and adaptive functioning. The majority of people with autism exhibit some level of mental retardation, but IQs can vary from the severe and profoundly mentally retarded range to well above average intelligence. In addition to the variability within the autism diagnosis, there is a set of pervasive developmental disorders that have symptoms that partially overlap with autism. These include Asperger syndrome, in which individuals show fewer language deficits, and pervasive developmental disorder—not otherwise specified, where some of the criteria for autism are met (American Psychiatric Association, 1994). These three pervasive developmental disorders, combined with two others, childhood disintegrative disorder and Rett's disorder, have come to be known more informally as “autism spectrum disorders.” These disorders are strikingly common. Approximately 1 child in 150 has an autism spectrum disorder, according to recent estimates (Centers for Disease Control, 2007).
The social deficits and a characteristic developmental course appear to be unique, pathognomic features of autism spectrum disorders (Kanner, Reference Kanner1943; Wing & Gould, Reference Wing and Gould1979). Although repetitive behaviors and restricted interests as well as language deficits are seen in other disorders (e.g., obsessive compulsive disorder and specific language impairment, respectively), only autism presents with a set of deficits that includes social dysfunction. Kanner (Reference Kanner1943) and Asperger (Reference Asperger1944) published the first accounts of autism independently of each other. These papers contained detailed case descriptions and offered the first theoretical attempts to explain the disorder. Both observers believed that there was a fundamental disturbance in the ability to relate socially that was present from birth and gave rise to highly characteristic problems. The social deficits were particularly emphasized in Kanner's (1943) descriptions of children with “infantile autism.” He described the children as lacking the necessary skills for normal social functioning, with a particular impairment in emotional interactions. To wit: “We must, then, assume that these children have come into the world with innate inability to form the usual, biologically provided affective contact with other people, just as other children come into the world with innate physical or intellectual handicaps” (p. 250). In his view, the most notable social difficulties were the lack of variation in emotional expression, withdrawn interest in other people, detachment and inaccessibility in social interactions, and the preference for objects over people. Although each individual varied along a spectrum of severity, they all shared an inherent lack of understanding of social situations and an inability to offer an emotional connection when interacting with others. In a 30-year follow-up of these same children, Kanner (Reference Kanner1971) found little improvement in affective contact.
Are the Social Deficits in Autism Central?
It is possible that the social deficits in autism are central in autism in the sense that early failures in social engagement could play a causal role in the emergence of the communication deficits and the repetitive, stereotyped behaviors and interests (Pelphrey & Carter, Reference Pelphrey, Carter, Coch, Dawson and Fischer2007; Volkmar, Carter, Sparrow, & Cicchetti, Reference Volkmar, Carer, Sparrow and Cicchetti1993; Volkmar & Mayes, Reference Volkmar and Mayes1990). This hypothesis is difficult to address given limited opportunities for experimental manipulation. However, there are now several strands of evidence supporting this position. First, the onset of the social deficits appears to predate onsets of deficits in the other two domains. As Volkmar, Chawarska, and Klin (Reference Volkmar, Chawarska and Klin2005) remarked: “Early signs of autism appear to include a lack of social interest in the first months of life, with reduced levels of social engagement and social–communicative interchanges; differences in the nonsocial areas are much less striking” (p. 319). Typically, social interest emerges soon after birth (Volkmar et al., Reference Volkmar, Chawarska and Klin2005). Deficits in social development in infants who go on to be diagnosed with autism can be seen even in the first year of life. For example, in a study of the first birthday videos of typically developing children and children with autism, four social behaviors were found to differentiate the two groups: looking at others, orienting to one's own name, showing objects to others, and pointing (Osterling & Dawson, Reference Osterling and Dawson1994). A later study reported that children with autism spectrum disorders looked at others less and oriented to their names with less frequency than those with mental retardation at age 1 year (Osterling, Dawson, & Munson, Reference Osterling, Dawson and Munson2002). This same group found that infants later diagnosed with autism spectrum disorders and those with mental retardation both showed fewer gestures, increased repetitive motor actions, and less looking toward items held by others relative to typically developing infants. A prospective longitudinal study of 1-year-old infants at either high or low risk of developing autism further suggested that those at high risk exhibited abnormal social behaviors, including reduced eye contact, social smiling, imitation, and social interest, along with delayed receptive and expressive language (Zwaigenbaum et al., Reference Zwaigenbaum, Bryson, Rogers, Roberts, Brian and Szatmari2005). Research has even suggested that by the age of 6 months, infants who will go on to be diagnosed with an autism spectrum disorder prefer nonsocial stimuli and have a specific deficit in social attention, along with reduced vocalizations and object exploration; however, they show no differences in motor stereotypies relative to other infants (Maestro et al., Reference Maestro, Muratori, Cavallaro, Pei, Stern and Golse2002). Together, these results suggest a primacy of social deficits, with reduced social engagement levels present before noticeable language delays and motor stereotypies.
With regard to the role of social deficits as a mechanism in the emergence of language deficits, many elegant behavioral studies in developmental psychology demonstrate that early social behaviors that are implicated in language learning, including eye contact and joint attention (e.g., Tomasello & Farrar, Reference Tomasello and Farrar1986), are not found or are different in degree in infants and children who develop autism (Baron-Cohen, Reference Baron-Cohen1995; Dawson, Munson, et al., Reference Dawson, Munson, Estes, Osterling, McPartland and Toth2002; Lord et al., Reference Lord, Pickles, McLennan, Rutter, Bregman and Folstein1997; Sigman et al., Reference Sigman, Ruskin, Arbeile, Corona, Dissanayake and Espinosa1999). Moreover, the degree to which affected children eventually develop language is modulated by their joint attention abilities (e.g., Mundy, Sigman, & Kasari, Reference Mundy, Sigman and Kasari1990; Thurm, Lord, Lee, & Newschaffer, Reference Thurm, Lord, Lee and Newschaffer2006). Specifically, deficits in imitation and joint attention (particularly those that involving triadic gaze switching) have been found to correlate with reduced language ability and increased social and communication symptoms (Charman, Reference Charman2003), providing an early mechanism by which social manifestations of autism can induce communicative deficits. Further, children with autism do not participate in social and cultural interactions and contexts, perhaps producing a failure to develop the higher cognitive operations resulting from such involvement, including learning strategies, metacognition, and executive functions (e.g., Fischer & Bidell, Reference Fischer, Bidell and Lerner1998; Rogoff, Reference Rogoff1990; Valsiner, Reference Valsiner1987; Vygotsky, Reference Vygotsky1978).
Finally, experimental work in nonhuman primates has provided dramatic demonstrations of the mechanisms by which social isolation can lead to the emergence of restricted, repetitive behaviors. For example, monkeys who have been reared in social isolation exhibit odd, persistent behavior patterns that resemble those that are characteristic of humans with autism (e.g., Cross & Harlow, Reference Cross and Harlow1965; Harlow, Dodsworth, & Harlow, Reference Harlow, Dodsworth and Harlow1965; Harlow, Rowland, & Griffin, 1964). Of importance, this same line of research demonstrates the plasticity of the brain mechanisms supporting social behavior. To illustrate, monkeys who were socially isolated for the first 6 months of life consistently displayed severe deficits in virtually every aspect of social behavior. However, when these 6-month-old social isolates were allowed to interact with 3-month-old normal monkeys, they achieved almost total social recovery (Harlow & Suomi, Reference Harlow and Suomi1971). These findings point to a potentially high degree of plasticity inherent in the brain mechanisms supporting primate social behavior.
A disturbance in affective contact
Kanner and Asperger both used the word autistic to characterize the nature of the underlying disturbance in the children they observed. This adjective was introduced by Bleuler in 1910 (Kuhn & Cahn, Reference Kuhn and Cahn2004) to describe a basic disturbance in schizophrenia, namely, the narrowing of relationships with people and with the outside world, a narrowing so extreme that it seemed to exclude everything except the person's self. Hence, the words autistic and autism derive from the Greek word autos meaning “self.” Given the findings regarding the effects of social isolation on monkey social behavior, it is plausible that the social isolation characteristic of autism could serve as a mechanism underlying the ritualistic and repetitive behaviors. Developmental scientists have long emphasized the importance of thinking about the child as an active organism serving to shape his or her own developmental pathway (e.g., Gottlieb, Reference Gottlieb1991). For the monkeys in Harlow's studies, the experimenter imposed the social isolation. In the case of the child with autism, there is no doubt that parents, grandparents, siblings, and educators provide an abundance of love, warmth, and care, but the child has not developed the brain mechanisms that allow him or her to reach out and take hold of this social fabric. The child's isolation is not by choice, but he or she remains isolated until scientists can develop the knowledge of the neuroanatomical structures and circuits that support social behavior and thereby inform the development of effective treatments. The goal of our research program is to use neuroimaging to chart the typical and atypical development of brain mechanisms for aspects of social cognition in children and adults with and without autism.
Neuroanatomical Substrates of Social Cognition
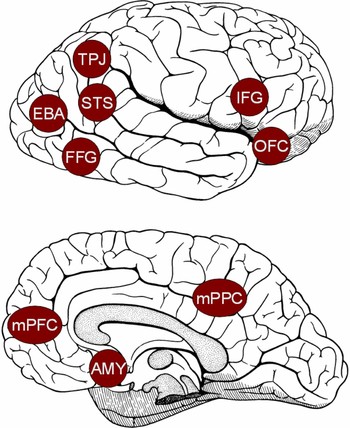
Social cognition refers to the fundamental abilities to perceive, categorize, remember, analyze, reason with, and behave toward other conspecifics (Adolphs, Reference Adolphs2001; Pelphrey, Adolphs, & Morris, Reference Pelphrey, Adolphs and Morris2004). Over the past decade, cognitive neuroscientists have begun to identify the cortical and subcortical regions implicated in these processes. Figure 1 shows some of these brain regions. The fusiform gyrus, located in the ventral occipitotemporal cortex, contains a region termed the fusiform face area (FFA), which has been implicated in face perception and recognition (e.g., Kanwisher, McDermott, & Chun, Reference Kanwisher, McDermott and Chun1997; Puce, Allison, Asgari, Gere, & McCarthy, Reference Puce, Allison, Asgari, Gore and McCarthy1996). Visual perception of human bodies takes place in the extrastriate body area (EBA; e.g., Downing, Jiang, Shuman, & Kanwisher, Reference Downing, Jiang, Shuman and Kanwisher2001). The superior temporal sulcus (STS) region, particularly the posterior STS in the right hemisphere, analyzes biological motion cues, including eye, hand, and other body movements, to interpret and predict the actions and social intentions of others (e.g., Bonda, Petrides, Ostryi, & Evans, 1996; Pelphrey, Morris, Michelich, Allison, & McCarthy, Reference Pelphrey, Morris and McCarthy2005). Related to the perception of biological motion, the “mirror neuron system” in humans is involved in both the execution of a motor action and the observation of a motor action performed by another person (e.g., Buccino et al., Reference Buccino, Binkofski, Fink, Fadiga, Fogassi and Gallese2001; Rizzolatti, Fadiga, Gallese, & Fogassi, Reference Rizzolatti, Fadiga, Gallese and Fogassi1996). Finally, the amygdala (AMY) is highly interconnected with other cortical and subcortical brain structures. It has been implicated in helping to recognize the emotional states of others through analysis of facial expressions (e.g., Morris et al., Reference Morris, Frith, Perrett, Rowland, Young and Calder1996) as well as in multiple aspects of the experience and regulation emotion (e.g., Davis & Whalen, Reference Davis and Whalen2001; Kluver & Bucy, Reference Kluver and Bucy1997; LeDoux, Reference LeDoux2000).
Brain regions that have been implicated in various aspects of social cognition. AMY, amygdala; EBA, extrastriate body area; STS, superior temporal sulcus region; TPJ, temporal parietal junction; FFG, fusiform gyrus; OFC, orbital frontal cortex; mPFC, medial prefrontal cortex; IFG, inferior frontal gyrus. [A color version of this figure can be viewed online at journals.cambridge.org/dpp]

Four additional cortical regions have been reliably shown to be involved in certain more advanced aspects of social cognition, including theory of mind and self cognition. The adult temporoparietal junction (TPJ) appears to be particularly selective for attributing beliefs to others and reasoning about those beliefs (e.g., Saxe & Kanwisher, Reference Saxe and Kanwisher2003). Further, the medial prefrontal cortex (mPFC) is involved in reasoning about others' beliefs, self-reflection (e.g., Kelley et al., Reference Kelley, MaCrae, Wyland and Heatherton2002; Northoff et al., Reference Northoff, Heinzel, de Greck, Dobrowolny and Panksepp2006; Saxe & Powell, Reference Saxe and Powell2006), and autobiographical memory (Shannon & Buckner, Reference Shannon and Buckner2004). The mPFC has been shown to be activated by a wide range of tasks involving making inferences concerning intentions and mental states (e.g., Castelli, Frith, Happe, & Frith, Reference Castelli, Frith, Happe and Frith2002; Frith & Frith, Reference Frith and Frith1999), the attribution of emotions to self and others (e.g., Ochsner et al., Reference Ochsner, Knierim, Ludlow, Hanelin, Ramachandran and Glover2004), self-reflection generally (e.g., Kelley et al., Reference Kelley, MaCrae, Wyland and Heatherton2002), and representing semantic knowledge about the psychological aspects of others (e.g., Mitchell, Banaji, & Macrae, Reference Mitchell, Banaji and Macrae2005). In addition, the precuneus or posterior cingulate in the medial parietal cortex is more active during self-knowledge retrieval than during other types of social or semantic tasks (e.g., D'Argembeau et al., Reference D'Argembeau, Collette, Van der Linden, Laureys, Del Fiore and Degueldre2005).
The STS Region and Social Perception
We have established a program of research that has as its major goals the identification and delineation of the neural systems involved in social perception and charting the development of those systems in children, adolescents, and adults with and without autism. We began our research on the neurobiology of social perception in humans with the intention of further specifying the role of the STS region in the network of brain regions comprising the social brain. To this end, we have conducted a series of functional magnetic resonance imaging (fMRI) experiments aimed at evaluating a set of hypotheses concerning the role of the STS region in social perception. Initially, this work focused on evaluating STS function when typically developing participants were engaged in the visual analysis of other people's actions and intentions. These studies tested the hypothesis that the STS region plays an important role in social perception via its involvement in interpreting the actions and social intentions of other people from an analysis of biological–motion cues (Allison, Puce, & McCarthy, Reference Allison, Puce and McCarthy2000). This hypothesis was based on the available human neuroimaging evidence as well as elegant research in nonhuman primates demonstrating the sensitivity of neurons in the STS to various socially relevant visual cues, including head and gaze direction (e.g., Perrett et al., Reference Perrett, Smith, Potter, Mistlin, Head and Milner1985). From the results of these studies, it soon became clear that knowledge of the role of the STS region in social perception could be highly relevant for understanding the nature of social perception dysfunction in autism. We therefore conducted a set of fMRI studies to examine the STS region in adults with autism. More recently, we have begun to expand this line of research to take a developmental perspective in charting the typical and atypical development of the STS region in children with and without autism. Here we review progress to date in this program of research.
Detecting life: Perceiving biological motion
As we navigate the social world, a critical component of social cognition is the perception of other dynamic agents in the environment. Social animals must distinguish between living, dynamic, animate beings, with which there is a potential for social interaction, and static, lifeless objects that require a different mode of reasoning and interaction (Johnson, Reference Johnson2006). As Baron-Cohen (Reference Baron-Cohen1995) has proposed, the detection of other animate beings, particularly other humans, may be essential in the development of abilities for processing the social world differently from that of inanimate objects. Dynamic agents are often revealed via the perception of biological motion. Biological motion refers to the visual perception of a living entity engaged in a recognizable activity. This definition includes the observation of humans walking and making eye and mouth movements, but the term can also refer to the visual system's ability to recover information about a person's motion from sparse input. The latter is well illustrated by the discovery that point-light displays (moving images created by placing lights on the major joints of a walking person and filming them in the dark), whereas being relatively impoverished stimuli, contain the information necessary to identify the agent of motion and the kind of motion produced by the agent (Johansson, Reference Johansson1973). In the context of novel behavioral findings concerning the perception of the direction of locomotion from point-light displays, Troje and Westhoff (Reference Troje and Westhoff2006) recently put forward the hypothesis that humans (and other vertebrates) have an early developing visual–perceptual mechanism that that is tuned to detect the motion of the limbs of an animal in locomotion. They further speculate that this mechanism serves as a general detection system for articulated terrestrial animals: a perceptual “life detector.”
Given the existence of a cognitive mechanism for the detection of life, what might be its neural basis? Recent neuroimaging work has provided increasing evidence that humans develop specialized pathways for the perception of biological motion (e.g., Bonda et al., Reference Bonda, Petrides, Ostry and Evans1996; Carter & Pelphrey, Reference Carter and Pelphrey2006; Peelen, Wigget, & Downing, Reference Peelen, Wiggett and Downing2006; Pelphrey, Mitchell, et al., Reference Pelphrey, Mitchell, McKeown, Goldstein, Allison and McCarthy2003; Puce, Allison, Bentin, Gore, & McCarthy, Reference Puce, Allison, Bentin, Gore and McCarthy1998). In particular, many studies have implicated the posterior STS region in the visual perception of biological motion (for reviews, see Allison et al., Reference Allison, Puce and McCarthy2000; Pelphrey & Morris, Reference Pelphrey and Morris2006). For example, Bonda and colleagues (1996) reported that the perception of point-light displays, representing goal-directed hand actions and body movements, selectively activates the STS region relative to random motion. Later, Puce and colleagues (1998) demonstrated that the STS region responds more strongly to observed mouth and eye movements than it does to various nonbiological motion controls.
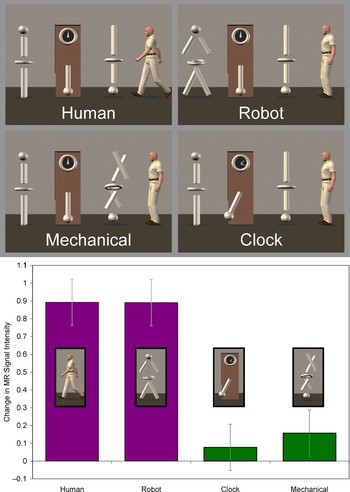
Many of the early neuroimaging studies of biological motion perception used point-light displays as stimuli, leaving open the possibility the response from the STS region was being driven by the fact that biological motion was more familiar, recognizable, and nameable than the random motion used as a control condition. It was possible that coordinated and meaningful nonbiological motion might also activate the STS region. This called into question the specificity of this region for processing biological motion. To address this issue, we conducted an event-related fMRI study to compare the response from the STS region to four different types of motion conveyed via animated virtual-reality characters (Pelphrey, Mitchell, et al., 2003). As illustrated in the top panel of Figure 2, participants viewed walking, a biological motion conveyed by a robot (robot) or a human (human). They also viewed a nonmeaningful but complex nonbiological motion in the form of a disjointed mechanical figure (mechanical) and a complex, meaningful, and nameable nonbiological motion involving the movements of a grandfather clock (clock). Our design addressed the critical question of whether the STS region is specialized for the perception of biological motion. As shown in the bottom panel of Figure 2, we observed strong and equivalent activity in the right hemisphere posterior STS region to the human and robot conditions. This result ruled out the possibility that the STS region was merely responding to the presence of a human form. Overall, the response to biological motion was far greater than that to the moving clock and the mechanical figure. Critically, not every brain region showed this pattern of effects. For instance, MT or V5 (MT/V5), which is known to respond to various kinds of motion (Watson et al., Reference Watson, Myers, Frackowiak, Hajnal, Woods and Mazziotta1993; Zeki et al., Reference Zeki, Watson, Lueck, Friston, Kennard and Frackowiak1991), responded strongly to all four types of motion. From these results, we concluded that biological motion selectively activates the STS region. Thus, we began to view the STS region as a node of the neural system supporting social perception via its role in the “detection of life” and more broadly in the representation of observed human actions.
(Top panel) Experiment to determine brain responses to biological versus nonbiological motion. There were four experimental conditions: a human, a robot, a mechanical assembly, and a grandfather clock. The four figures were always present, and on each trial one of the four figures moved for 2 s. Trials were separated by a 16-s intertrial interval, during which all four figures were present on the screen and none were moving. (Bottom panel) Peak amplitudes from all voxels in the right hemisphere STS by condition. Adapted from “Brain Activity Evoked by the Perception of Human Walking: Controlling for Meaningful Coherent Motion,” by K. A. Pelphrey, T. V. Mitchell, M. J. McKeown, J. Goldstein, T. Allison, and G. McCarthy, 2003, Journal of Neuroscience, 23, 6819–6825. Copyright 2003 by Society for Neuroscience. Adapted with permission. [A color version of this figure can be viewed online at journals.cambridge.org/dpp]

Perceiving social signals of affiliation and avoidance
Gaze direction can serve as a powerful social cue, with mutual gaze often signaling threat or approach and averted gaze conveying submission or avoidance (Argyle & Cook, Reference Argyle and Cook1976). Of all the primate species, humans have the most prominent eyes (largest and brightest sclera), which facilitates the determination of gaze direction (Kobayashi & Kohshima, Reference Kobayashi and Kohshima1997). This and other findings support the “cooperative eye” hypothesis put forward by Tomasello Hare, Lehmann, and Call (Reference Tomasello, Hare, Lehmann and Call2007). They suggest that particularly visible eyes have made it increasingly easy throughout evolution to coordinate close-range collaborative activities by understanding the attentional foci and plans of others. One prediction of this hypothesis is that the primate social brain should include mechanisms for the detection of socially relevant gaze shifts.
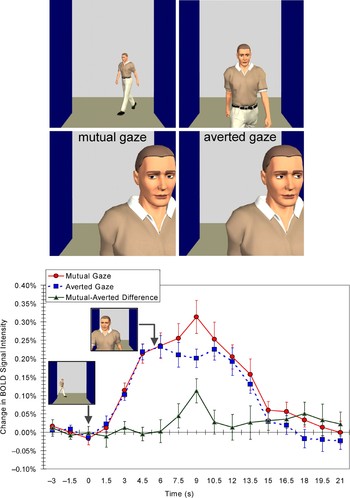
We conducted an fMRI study to evaluate whether the posterior STS region is engaged in the detection of mutual and averted gaze that convey social approach and avoidance (Pelphrey, Viola, & McCarthy, Reference Pelphrey, Viola and McCarthy2004). We created a virtual-reality scenario where characters would approach the participant and either meet or avoid his or her eyes (top panel of Figure 3). Participants viewed these stimuli through liquid crystal display goggles in an MRI scanner. We predicted greater activity for mutual compared to averted gaze, reflecting the demand for greater social processing in the case of mutual gaze. As illustrated in the bottom panel of Figure 3, we saw this pattern of response for the approach and associated gaze shift in the STS region. However, there was a functional dissociation between the STS and the FFA, wherein the FFA did not differentiate between mutual and averted gaze. This suggests a role for the FFA in face detection and a different function for the STS region in gaze comprehension.
Experiment measuring brain activation in response to a stranger initiating or avoiding social interaction. Participants viewed an animated character approaching down a virtual hallway, who shifted his gaze either toward or away from the subject. In both situations, the animated sequence evoked activation in the right STS region and the right FFG. The graph at bottom shows the time courses of activation (indicated as the average BOLD signal changes) from the right STS region in response to the passerby's mutual and averted gaze movements. The mutual- and averted-gaze conditions are plotted along with a plot of their difference (mutual minus averted gaze). Note that the change in activity begins with the appearance of the character in the hallway and increases again at the moment the gaze shift occurs. Adapted from “When Strangers Pass: Processing of Mutual and Averted Social Gaze in the Superior Temporal Sulcus,” by K. A. Pelphrey, R. J. Viola, and G. McCarthy, 2004, Psychological Science, 15, 598–603. Copyright 2004 by Blackwell. Adapted with permission. [A color version of this figure can be viewed online at journals.cambridge.org/dpp]

Grasping the intentions of others
Our prior studies demonstrated that the posterior STS region is involved selectively in the perception of biological motion, and that it plays a role in analyzing social intentions as conveyed by mutual gaze. We next sought to determine whether the STS region is involved in representing the intentions of other individuals with respect to objects in the visual field. In this case, we examined brain responses to the movements of a character's eyes that were either consistent or inconsistent with the participant's expectation about what the virtual character “ought” to do in a particular context (Pelphrey, Singerman, Allison, & McCarthy, Reference Pelphrey, Singerman, Allison and McCarthy2003).
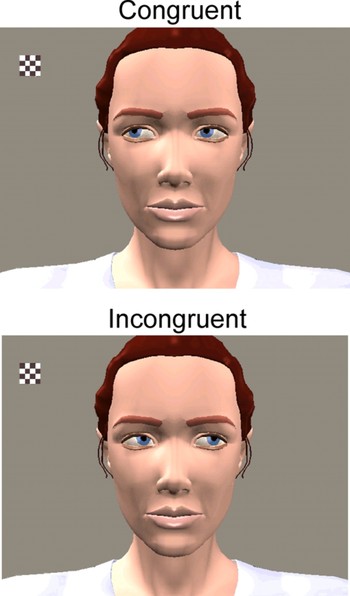
Inside the MRI scanner, our participants watched an animated character as a small checkerboard appeared and flickered in her visual field (see Figure 4). On congruent trials, the character looked toward the checkerboard (Figure 4, top), acting in accordance with the subject's presumed expectation. On incongruent trials, the character looked away from the checkerboard at a different part of her visual field (Figure 4, bottom), violating expectations. We had suspected that the STS region would be sensitive to these differences in intentionality, and that this region would therefore differentiate between the congruent and incongruent conditions. This would suggest that this area is involved in monitoring expectations about the goals of others. Activity in the STS region was greater for incongruent than for congruent gaze shifts, demonstrating a need for different levels of processing for observed goal-directed and nongoal-directed observed actions. We note that the pattern of effects (incongruent > congruent) is not specific to eye movements because it is also observed when participants view congruent and incongruent reaching to grasp movements of the hand and arm (Pelphrey, Adolphs, et al., 2004). Thus, we concluded that the STS region participates in social perception beyond its role in the simple detection of biological motion: it is also involved in the visual analysis of other people's actions and intentions.
Experiment to determine brain activation in response to expected and unexpected gaze shifts on the part of another person. Incongruent trials evoked greater right hemisphere STS activity than did congruent trials, demonstrating the sensitivity of the STS region to the intentions conveyed by eye gaze shifts. Adapted from “Neural Basis of Eye Gaze Processing Deficits in Autism,” by K. A. Pelphrey, J. P. Morris, and G. McCarthy, 2005, Brain, 128(Pt. 5), 1038–1048. Copyright 2005 by Oxford University Press. Adapted with permission. [A color version of this figure can be viewed online at journals.cambridge.org/dpp]

The role of the STS region in social perception: Analyzing goals and intentions to predict actions
Our two studies of gaze processing advanced our understanding of the social brain by demonstrating that the activity in the posterior STS region is modulated by the perceived intentions of actions: in one case, social intentions (mutual versus averted gaze), and in the other case, goal-directed intentions (object vs. nonobject directed gaze). Initially, the results of these studies seemed somewhat inconsistent. That is, in the study involving mutual and averted gaze, it might seem reasonable for the subject to expect that the approaching, unfamiliar character would look at him or her rather than away. Thus, the gaze shift away from the subject could be relatively unexpected, leading to a prediction of increased activity for averted compared to mutual gaze. Yet, there was more activity in the case of mutual compared to averted gaze. In the study involving a flashing checkerboard, the unexpected action was for the character to look away from the object, and observation of the unexpected gaze shift elicited greater posterior STS activity.
One potentially unifying explanation is that in both cases, mutual and incongruent gaze, there is an increased demand on the subject to process the character's intentions. That is, given North American social norms concerning the use of direct eye contact when strangers meet (e.g., Irujo, Reference Irujo and Wurzel1988), the mutual gaze condition might have been more unexpected. Moreover, mutual gaze is a bid for social interaction and thus demands added processing of the character and his or her intentions. For example, the subject must evaluate the nature of the impending interaction and rapidly address questions such as “Will this interaction be positive or negative (e.g., do they have an angry or happy facial expression?” Carter & Pelphrey, Reference Carter and Pelphrey2008). Likewise, observation of the incongruent eye gaze requires the revision of the subject's expectation regarding the character's likely action and her intention. In both cases, the common denominator is the demand for additional information regarding the actor's intentions with a focus on what the agent might do next.
Our fMRI studies illustrate a role for the STS region in the detection and processing of actions to interpret the attentional foci and goals of others during social interactions. They also support the hypothesis that a social brain component can be influenced by the context of an action, even during passive observation of others. Moreover, this research suggests that such processing occurs prior to such higher level functions as decision making and response selection. More broadly, our findings regarding contextual influences on brain activity fit well with social psychology findings regarding the behavioral effects that result from situational and contextual factors. Thus, the principles of situational and contextual influence operate at multiple levels of the organism, including the individual's behavior in social situations and localized brain activity.
The STS Region and Social Perception Dysfunction in Autism
The findings from our basic neuroimaging work examining the role of the STS in social perception, coupled with our observations of the nature of social perception deficits in autism, led us to the hypothesis that STS dysfunction might play a role in the social deficits that are central to autism.
The neural basis of eye-gaze processing deficits in autism
Individuals with autism exhibit characteristic and early appearing deficits in using gaze information to understand the intentions and mental states of others as well as to coordinate joint attention (Baron-Cohen, Reference Baron-Cohen1995; Baron-Cohen et al., Reference Baron-Cohen, Ring, Wheelwright, Bullmore, Brammer and Simmons1999; Dawson, Meltzoff, Osterling, Rinaldi, & Brown, Reference Dawson, Meltzoff, Osterling, Rinaldi and Brown1998; Frith & Frith, Reference Frith and Frith1999; Leekam, Hunnisett, & Moore, Reference Leekam, Hunnisett and Moore1998; Leekam, Lopez, & Moore, Reference Leekam, Lopez and Moore2000; Loveland & Landry, Reference Loveland and Landry1986; Mundy, Sigman, Ungerer, & Sherman, Reference Mundy, Sigman, Ungerer and Sherman1986). Joint attention can be taught in some cases, but using gaze information to infer mental states and intentions is consistently impaired even in high-functioning adults with autism (Baron-Cohen, Wheelwright, Hill, Raste, & Plumb, Reference Baron-Cohen, Wheelwright, Hill, Raste and Plumb2001). Note that it is not that these individuals cannot detect gaze direction but rather that they cannot use such information to infer others' mental states and behaviors. For example, Baron-Cohen (Reference Baron-Cohen1995) found that children with autism do not use the direction of an individual's gaze to determine what that individual wants or knows, even though they succeed in following gaze and can accurately determine where an individual is looking.
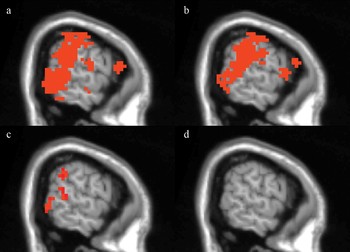
Based on our prior findings and knowledge of these deficits, we decided to explore the role of the STS in gaze processing dysfunction in autism (Pelphrey, Morris, & McCarthy, Reference Pelphrey, Morris and McCarthy2005). To do so, we utilized our checkerboard paradigm (Pelphrey, Mitchell, et al., 2003). We knew that typically developing individuals should show an increased response for incongruent versus congruent gaze shifts in the STS region, demonstrating effects of intentionality (Mosconi et al., Reference Mosconi, Mack, McCarthy and Pelphrey2005; Pelphrey, Mitchell, et al., 2003; Pelphrey, Morris, & McCarthy, Reference Pelphrey, Morris and McCarthy2004). However, although we found activity in the same brain regions in individuals with autism (Figure 5, top two panels), we saw no such differentiation in brain activity based on condition (Figure 5, bottom two panels). This suggests an absence of contextual influence on the STS region and a lack of sensitivity to the intentional and goal-directed structure of actions, which is a possible brain mechanism underlying the gaze processing deficits reported behaviorally in autism. Consistent with our findings, hypoactivation of the STS and reduced functional connectivity between the STS and portions of the inferior occipital gyrus (visual area V3) have also been reported in individuals with autism during tasks involving attribution of intentions to moving geometric figures (Castelli, Frith, Happe, & Frith, Reference Castelli, Frith, Happe and Frith2002).
Results from random effects analyses to compare people with and without autism. (a, b) Activation maps indicating regions with significant eye gaze-evoked activity (collapsing across congruent and incongruent gaze shifts) in the group of (a) neurologically normal participants and (b) participants with autism. (c, d) Activation maps indicating regions where the average response at expected peak amplitude to incongruent gaze shifts was greater than the average response to congruent gaze shifts (c) in neurologically normal participants and the lack of these activations (d) in participants with autism. The right hemisphere is shown. Adapted from “Neural Basis of Eye Gaze Processing Deficits in Autism,” by K. A. Pelphrey, J. P. Morris, and G. McCarthy, 2005, Brain, 128(Pt. 5), 1038–1048. Copyright 2005 by Oxford University Press. Adapted with permission.

One of the most interesting aspects of our findings was the observation that dysfunction in the STS region was strongly and specifically correlated with the level of social impairment exhibited by individual participants. Recall that, as a group, activity in the STS region in the participants with autism did not differ significantly for incongruent and congruent gaze shifts. However, just as autism is heterogeneous in severity, there were clear individual differences in the degree of STS dysfunction. To explore whether these individual differences were related to the severity of autism, we computed correlations between the scores on several algorithmic domains of the Autism Diagnostic Interview—Revised (ADI-R; Lord, Rutter, & Le Couteur, Reference Lord, Rutter and Le Couteur1994), which is used to support the diagnosis of autism, and the magnitude of the incongruent versus congruent differentiation in the right STS region. We assumed that lower levels of incongruent versus congruent differentiation (i.e., incongruent minus congruent difference scores) in the STS region would indicate greater cortical dysfunction. Higher scores on aspects of the ADI-R can indicate greater severity of autism. It is striking that the magnitude of the incongruent versus congruent difference score was strongly negatively correlated with scores in the Reciprocal Social Interaction Domain (r = −.78, p = .004), but was not significantly correlated with impairments in the communication domain or the restricted, repetitive and stereotyped patterns of behavior domain. Nor was the measure of STS dysfunction correlated with levels of general intellectual function (as measured by an IQ test). These findings suggest that the degree of neurofunctional impairment in the right STS region is related to the severity of specific core features of the autism phenotype.
Our findings suggest a brain mechanism that can explain why individuals with autism fail to link the perceptual representation of eyes moving and the concurrent representation regarding a character's goals, motives, and desires (i.e., the contents of the actor's mind) to determine the intentions of another person. This study raised an important question to be addressed in future work. We know that additional processing did not occur in the STS region in our participants with autism. We do not yet know whether this is so because an initial expectation or prediction regarding what the observed character should do is never formed (or the opposite expectation that they character should look away from the checkerboard was formed) or because information concerning the violation of a formed expectation never reaches the STS region, and thus no demand is made for additional processing (i.e., the STS is not reengaged when the expectation is violated). Both interpretations of the present findings point to a disconnection between the perceptual processing of eye movements in the STS region and the mentalistic significance of these motions. The present findings unfortunately cannot address the important question of whether the neurobiological basis of the lack of differential STS activity resides in the cortex of the STS region itself or if the dysfunction is the result of failures of communication between the STS region and other brain structures involved in social processing. Consistent with the possibility of a primary pathology in the STS region, other neuroimaging studies have revealed hypoactivation of the STS in autism during tasks involving the attribution of intentions to moving geometric figures (Castelli et al., Reference Castelli, Frith, Happe and Frith2002) and human speech perception (Boddaert et al., Reference Boddaert, Belin, Chabane, Poline, Barthelemy and Mouren-Simeoni2003; Gervais et al., Reference Gervais, Belin, Boddaert, Leboyer, Coez and Sfaello2004). Bilateral hypoperfusion of temporal lobe areas at rest has been observed in children with autism (Ohnishi et al., Reference Ohnishi, Matsuda, Hashimoto, Kunihiro, Nishikawa and Uema2000; Zilbovicius et al., Reference Zilbovicius, Boddaert, Belin, Poline, Remy and Mangin2000). A positron emission tomography (PET) study of speech perception reported abnormal laterality of responses and hypoactivation of the left superior temporal gyrus (Boddaert et al., Reference Boddaert, Belin, Chabane, Poline, Barthelemy and Mouren-Simeoni2003), and an fMRI study observed abnormal responses in the STS region to human voices (Gervais et al., Reference Gervais, Belin, Boddaert, Leboyer, Coez and Sfaello2004). A study comparing cortical sulcal maps in individuals with and without autism found anterior and superior displacements of the STS (Levitt et al., Reference Levitt, Blanton, Smalley, Thompson, Guthrie and McCracken2003), and Boddaert and colleagues (Reference Boddaert, Chabane, Gervais, Good, Bourgeois and Plumet2004) reported abnormal STS volumes in autism. These findings are consonant with a potential disruption in the STS region itself, but they cannot rule out the alternative interpretation.
Alternatively, there may be abnormal functional connectivity between the STS region and other regions critical to social understanding (e.g., the mPFC). In this model, the STS region is initially activated in an obligatory manner when the subject perceives an eye gaze shift, and a representation of this information is fed forward to other regions that analyze the goal-directed and intentional components of this motion. Prior work has suggested that the mPFC (Castelli et al., Reference Castelli, Frith, Happe and Frith2002; Saxe & Powell, Reference Saxe and Powell2006) and TPJ (Saxe & Kanwisher, Reference Saxe and Kanwisher2003) are likely candidates for performing this type of analysis. In typically developing individuals, these systems may engage and maintain activation in the STS region, and thus this higher level processing is reflected in the activation patterns of STS region. In individuals with autism, the connections between higher level systems and the STS region may be broken; thus, the higher level systems do not engage and maintain activation in the STS region. Consistent with this way of thinking, a study by Just, Cherkassky, Keller, and Minshew (Reference Just, Cherkassky, Keller and Minshew2004) demonstrated lower functional connectivity between Wernicke's and Broca's areas during language processing in participants with autism.
Combining motion and emotion: Reconnecting the components of the social brain
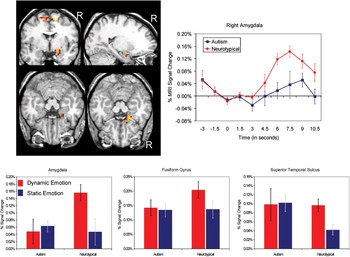
Our initial study of individuals with autism raised the intriguing possibility that a lack of connectivity among two or more of the neuroanatomical structures supporting social cognition could drive the emergence of key social perception deficits in autism. In our next fMRI study of individuals with autism, we employed a paradigm that would allow us to directly examine the modulation of the A's response to emotional facial expressions as a function of the presence or absence of biological motion (Pelphrey, Morris, McCarthy, & LaBar, 2007). Building upon a prior study in neurologically normal adults (LaBar, Crupain, Voyvodic, & McCarthy, Reference LaBar, Crupain, Voyvodic and McCarthy2003), we compared brain activity to dynamic and static facial expressions in adolescents and adults with and without high-functioning autism using an event-related fMRI design and three classes of face stimuli: emotion morphs, identity morphs, and static images. Static images depicted prototypical fearful, angry, and neutral expressions. Identity morphs depicted transitions from one person's face to another, always with neutral expressions. Emotion morphs depicted expression changes from neutral to fear or anger, creating the illusion that the actor was “getting scared” or “getting angry” in real time. Based on our previous fMRI studies of face processing and biological motion (Pelphrey et al., 2005), and the existing fMRI literature in autism (Ashwin, Chapman, Colle, & Baron-Cohen, Reference Ashwin, Chapman, Colle and Baron-Cohen2006; Baron-Cohen et al., Reference Baron-Cohen, Ring, Wheelwright, Bullmore, Brammer and Simmons1999; Critchley et al., Reference Critchley, Daly, Bullmore, Williams, Van Amelsvoort and Robertson2000; Dalton et al., Reference Dalton, Nacewicz, Johnstone, Schaefer, Gernsbacher and Goldsmith2005; Ogai et al., Reference Ogai, Matsumoto, Katsuaki, Ozawa, Fukuda and Uchiyama2003; Wang, Dapretto, Hairi, Singman, & Bookheimer, Reference Wang, Dapretto, Hariri, Sigman and Bookheimer2004), we hypothesized that the A would show hypoactivation to the emotion morphs in participants with autism relative to our neurotypical participants. As illustrated in the top two panels of Figure 6, this was exactly what we observed. We further predicted that the A, STS, and fufiform gyrus (FFG) would not show differential activation to the emotion morphs compared to the static emotions, reflecting a lack of modulation of the A and FFG by the STS region during processing of emotional expressions in autism. As illustrated in the bottom panel of Figure 6, in the A, STS, and FFG, participants without autism exhibited modulation of responses to emotional facial expressions by motion with more activity for dynamic compared to static facial expressions. In contrast, responses in these same regions were not modulated by motion in participants with autism. However, it is noteworthy that significant hemodynamic responses were observed in both groups of participants across the three brain regions, indicating that both groups of participants were attending to the stimuli. These results suggest that in neurotypical individuals, the STS region communicates with the FFG and A during the perception of dynamic facial expressions of emotion. In autism, these pathways are silent. This conclusion is consistent with research demonstrating that the A, via its numerous reciprocal connections, can affect and is affected by changes in activity in other brain regions (Anderson & Phelps, 2001; Freese & Amaral, Reference Freese and Amaral2005; Iidaka et al., Reference Iidaka, Omori, Murata, Kosaka, Yonekura and Okada2001; Morris, Ohman, & Dolan, Reference Morris, Ohman and Dolan1998; Vuilleumier, Richardson, Amony, Driver, & Dolan, Reference Vuilleumier, Richardson, Armony, Driver and Dolan2004). Similarly, Adolphs (Reference Adolphs2003) has proposed that in neurotypical individuals, higher order cortices in the temporal lobe (e.g., the STS and FFG) first encode the visual properties of socially relevant stimuli, and this information is then subsequently passed to neurons within the A that associate the visual percept with its emotional meaning.
(Top left panel) Results from a random-effects analysis comparing participants with autism to participants without autism. The red to yellow color map indicates regions of significant neurotypical > autism activity evoked during observation of emotional morphs. (Top right panel) Time courses of the average BOLD signal change from the right hemisphere amygdala region of neurotypical > autism activation. Bars indicate standard error of the mean. (Bottom panel) Bar graphs reflect average percent signal change and standard error by condition and group at expected peak (6- to 9-s poststimulus onset) for the right hemisphere amygdala, FFG, and STS. The error bars indicate standard errors of means. Adapted from “Perception of Dynamic Changes in Facial Affect and Identity in Autism,” by K. A. Pelphrey, J. P. Morris, G. McCarthy, and K. S. LaBar, 2007. Social Cognitive and Affective Neuroscience, 2, 140–149. Copyright 2007 by Oxford University Press. Adapted with permission.

Incorporating a developmental perspective on the development of the social brain in autism
Prior functional neuroimaging studies of autism have focused on the adolescent and adult age ranges, with the average age of samples in fMRI studies of adults with autism at 21 years and the youngest age group at 12 years. There are several reasons why it is critical to adopt a developmental perspective for studies of the social brain mechanisms underlying autism. First, such a perspective is consistent with what is known regarding the pathophysiological sequence of neurodevelopmental disorders broadly. Most frequently this sequence is seen as originating with abnormalities in the genetic code for brain development. These abnormalities, in turn, give rise to abnormal mechanisms of brain development. The abnormal mechanisms of brain development then give rise to structural and functional abnormalities of brain. Alterations in brain structure and function lead to information processing abnormalities. These abnormalities in cognitive processing are expressed in the behavioral syndrome recognized as autism. It is classic that such a sequence has been viewed as unidirectional (e.g., progressing from genes to brain to behavior). From the perspective of developmental science, we now recognize that the pathways in this pathophysiological cascade are more accurately characterized as bidirectional in nature (e.g., Gottlieb, Reference Gottlieb1991). Second, and related to the concept of bidirectional influences between an individual's activity in the environment and their brain structure and function, many of the neuroimaging findings from adults with autism could represent either actual causes of autism and/or compensatory changes in the brains. Group differences in imaging data from adults might represent a causal factor of or an effect of having autism on the brain. Recognizing the manifestations of compensatory effects in people with autism will be critical to understanding neuroimaging findings and may lead to novel treatments. Third, autism has its onset in the earliest years (or months) of childhood and its symptoms change over ontogeny. Neuroimaging studies of autism that take into account these psychological and behavioral continuities and discontinuities would better inform us of the neurobiological mechanisms in autism than would studies that provide only a static picture in adults. Ultimately, only prospective, longitudinal studies of children at risk for developing autism will be able to clarify the relationship between brain abnormalities and the course of the disorder. Fourth, by defining brain phenotypes based on neurofunctional activation patterns, fMRI studies of children hold potential for dissecting the heterogeneity present in autism spectrum disorders. Early and longitudinal study will be critical in defining social brain phenotypes because the developmental trajectories of brain functioning are expected to be more informative than the analysis of brain phenotypes in adults. As a case in point, imaging studies have provided noteworthy findings regarding correlations between structural developmental trajectories and the level of general intelligence in older children and adolescents. Shaw and colleagues (Reference Shaw, Greenstein, Lerch, Clasen, Lenroot and Gogtay2006) reported that the pattern of age-related change in cortical thickness (rather than that any one time point) was closely related to level of intelligence. Knowledge of the development of typical and atypical development of the social brain may aid researchers in their search for possible genetic and environmental factors related to autism.
Failing to represent the actions of others: The STS region in children with autism
In keeping with our strong beliefs concerning the value of a developmental perspective on the social brain in autism, we recently initiated a study to examine the degree to which the STS region is selective for biological as compared to nonbiological motion in 7- to 10-year-old children with and without autism (Pelphrey & Carter, in press). In an elegant behavioral study, Blake, Turner, Smoski, Pozdol, and Stone (Reference Blake, Turner, Smoski, Pozdol and Stone2003) demonstrated that children 8 to 10 years old with autism are significantly impaired at recognizing biological motion from point-light displays relative to IQ-matched neurologically normal children. We sought to identify the brain correlates of these biological motion perception deficits in children with autism. We employed our prior design with four different motion conditions: a walking man, a walking robot, a disjointed mechanical figure with the same components as the robot, and a grandfather clock (Pelphrey, Mitchell, et al., 2003). In this way, we were able to control for whether the figure was biological, whether the motion was biological, and whether the motion was organized. As reviewed above, we had previously shown that the STS region in neurologically normal adults was activated more by the biological motion conditions (human and robot) than by the nonbiological motion conditions (clock and mechanical figure). We identified a network of brain regions in our sample of 7- to 10-year-old typically developing children that had greater responses evoked by biological than by nonbiological motion, including the STS region and portions of the purported human mirror neuron system, such as the inferior frontal gyri, the precentral gyri, and middle and superior frontal gyri (Carter & Pelphrey, Reference Carter and Pelphrey2006). In addition, we found a developmental change that suggested increasing specificity for biological motion with age in the STS region. Specifically, the magnitude of the biological greater than nonbiological difference score was positively correlated with age in the right STS region (r = .64, p < .03).
When we used this same paradigm with 7- to 10-year-old high-functioning children with autism, we found that they did not have different STS activity for biological and nonbiological motion, nor did the specificity of the response to biological versus nonbiological motion vary as a function of age. Critically, not every brain region showed these patterns of effects: the motion-sensitive visual area MT/V5 was equally activated by both motion types in children with and without autism. This functional dissociation suggests that the STS and other social brain regions are specific for biological motion in typically developing children but not in children with autism. We did not observe reduced activity in all brain areas investigated, indicating that the effect we observed was not being driven by a general reduction in blood oxygen level dependent (BOLD) signal.
These findings might be particularly important in light of theoretical perspectives that emphasize the importance of biological motion in the development of theory of mind abilities. For example, Frith and Frith (Reference Frith and Frith1999) suggested that the ability to distinguish between biological and nonbiological figures, and their actions is one of the likely evolutionary and developmental precursors to theory of mind. Thus, early biological motion detection abilities could allow children to develop the ability to use knowledge about the actions and intentions of others to infer mental states and thus to develop full-fledged theory of mind abilities. The findings from our fMRI study of biological motion perception in children with and without autism suggest that children with autism do not possess one of the basic building blocks believed to underlie theory of mind. These individuals also show pronounced deficits on theory of mind tasks (Baron-Cohen, Leslie, & Frith, Reference Baron-Cohen, Leslie and Frith1985; Perner, Frith, Leslie, & Leekam, Reference Perner, Frith, Leslie and Leekam1989).
Our prior work, involving a comparison of adults with autism who were high functioning with typically developing, IQ-matched adult participants, demonstrated normal levels of activity in the STS region when participants viewed eyes moving (Pelphrey et al., 2005). The key finding in that study was a lack of modulation of the STS region in participants with autism when the observed eye movement was consistent or inconsistent with expectations. In our study of children with and without autism during the perception of walking versus nonbiological motions, the key findings were hypoactivation of the STS region in response to biological motion and a lack of differentiation between biological and nonbiological motion in this region. Indeed, the STS appeared to respond more strongly to nonbiological compared to biological motion in the high-functioning children with autism. In both studies, the autism cases were high functioning and identical diagnostic criteria were employed, making it unlikely that differences in levels of adaptive function could explain this difference in the findings from the two studies. We therefore suggest that the difference in findings might reflect an important difference in the developmental trajectories of social perception in children with and without autism. The ability to discriminate between biological and nonbiological motion as well as a preference for biological over nonbiological motion normally develops quite early in infancy (e.g., Fox & McDaniel, Reference Fox and McDaniel1982; Simion, Lucia, & Bulf, 2008). The evidence from behavioral studies of newborn infants viewing biological and nonbiological motion has been taken as evidence for an inborn predisposition to preferentially attend to biological motion (Simion et al., Reference Simion, Regolin and Bulf2008). It is striking that Ami Klin and Warren Jones (Reference Klin and Jones2008) reported data from a unique case report of a 15-month-old infant in whom the recognition of biological motion was impaired. Other behavioral studies have identified deficits in the processing biological motion in school-age children with autism (Blake et al., Reference Blake, Turner, Smoski, Pozdol and Stone2003; Klin, Jones, Schultz, Volkmar, & Cohen, Reference Klin, Jones, Schultz, Volkmar and Cohen2002; Moore, Hobson, & Lee, 1997). We suggest that these findings of biological–motion processing deficits as well as our neuroimaging data from children and adults point toward delayed development in the selectivity of the STS region for biological motion, such that brains of school-age children with autism have not yet developed selectivity for biological compared to nonbiological motion. It follows that because selectivity to biological motion is delayed, the STS region does not develop the typical ability to analyze the intentions of observed actions because the developing social perception system lacked a key input (the distinction between biological versus nonbiological motion) during the period in which this ability would normally develop. This hypothesis raises the important point that well-documented cognitive deficits in autism, such as difficulties in theory of mind (Baron-Cohen et al., Reference Baron-Cohen, Leslie and Frith1985), might actually result from disruption in more basic abilities and processes such as altered responses to biological and nonbiological motion, and failures to analyze the intentions of observed actions. Indeed, with such a basic difference in social perception early in development, the later failures to develop intention understand, and higher level aspects of theory of mind could reflect an altered course of experience, from which intact perceptual and cognitive abilities become directed toward other, nonsocial, nontheory of mind relevant ends. This might explain why we observe a trend in our fMRI data for the STS region in children with autism to respond more strongly to nonbiological compared to biological motion. Thus, through the lens of a developmental perspective, with an understanding of the development progression, those aspects of autism often noted as potential cognitive mechanisms may be culminations of altered developmental pathways as opposed to key mechanisms or aspects of the pathogenesis.
An Interacting, Developing Brain Systems Model of Social Brain Development
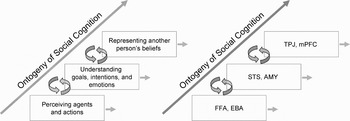
We have recently begun to link our conceptual view of development to a more concrete proposal of how underlying, interacting developing brain systems might support the emergence of more complex forms of social cognition and their disruption in autism (Pelphrey & Perlman, in press). Figure 7 illustrates this preliminary model for thinking about the development of social cognition and its neural basis from an “interacting, developing brain systems” prospective. We built into this model several aspects of social perception and social cognition that have been most frequently studied in children and/or adults using fMRI. As illustrated by the left to right stairstep-like organization, we think of each component as an increasingly sophisticated aspect of social cognition. The horizontal arrows originating from each construct represent the continued development of each along its own trajectory from infancy through adolescence that serves as a building block for and is influenced by more sophisticated aspects of social cognition. The model predicts that increasingly sophisticated forms of social cognition arise as a result of the enhanced efficiency of connectivity within brain networks involved in various components of social cognition. Contributing neurobiological mechanisms may include myelination and synaptic pruning. The model is reminiscent of classic developmental principles such as Werner's (Reference Werner1957) orthogenetic principle that “whenever there is development it proceeds from an initial state of relative globality and lack of differentiation to a state of increasing differentiation, articulation, and hierarchic integration” (1957, p. 126).
Model of the development of social cognition as driven by increases in functional connectivity. The rectangles on the left represent aspects of social cognition most frequently studied to date using fMRI. The rectangles on the right indicate the brain regions onto which the constructs on the left loosely map. The stairstep organization reflects an increasing developmental sophistication with the lower boxes providing the supporting building blocks for those above. The horizontal and circular arrows originating from each box indicate continued development from infancy through adolescence, whereby the processes and their neural substrates both support the development of higher level processes (bottom up) while being influenced by them (top down). Reprinted from “Charting Brain Mechanisms for the Development of Social Cognition,” by K. A. Pelphrey and S. B. Perlman. In Neuroimaging in Developmental Clinical Neuroscience, by J. Rumsey and M. Ernst (Eds.), in press, Cambridge: Cambridge University Press. Copyright 2008 by Cambridge University Press. Reprinted with permission.

Models of the social brain have most frequently emphasized the unique contributions of specific neuroanatomical regions (e.g., Adolphs, Reference Adolphs2001; Pelphrey, Adolphs, et al., 2004). In the still rare cases when these models have been applied to analysis of development of social cognition, the work has generally been guided by a maturational model in which the development of a specific brain region has made the emergence of specific abilities possible. Our perspective departs from the one-brain region, one-process maturational perspective, in that it features a major role for changes in connectivity between brain regions that perform specific kinds of computations and processes and that are engaged by specific tasks as a mechanism underlying ontogenetic changes in social cognition. Moreover, our view emphasis the activity and output of one brain region in shaping the development of another brain region to which it is connected. Such a possibility has only begun to be examined empirically (Guyer et al., in press), but this is an exciting direction because recent developments in techniques for studying functional connectivity (e.g., Just et al., Reference Just, Cherkassky, Keller and Minshew2004; Meyer-Lindenberg et al., Reference Meyer-Lindenberg, Kohn, Kolachana, Kippenhan, McInery-Leo and Nussbaum2005) now allow developmental cognitive neuroscientists to move toward brain-based, mechanistic theories of social cognitive development.
Conclusions and Future Directions
To discover the normal and abnormal development of the social brain, it would be ideal to scan infants at high risk of developing autism periodically starting from birth. However, this approach would still only yield a small percentage of children who would actually develop an autism spectrum disorder (e.g., Zwaigenbaum et al., Reference Zwaigenbaum, Bryson, Rogers, Roberts, Brian and Szatmari2005). It could also be useful to identify high-risk infants who go on to be identified as broader autism phenotype (BAP), rather than a full-fledged autism spectrum disorder (Dawson, Webb, et al., Reference Dawson, Webb, Schellenberg, Dager, Friedman and Aylward2002). Using anatomical and functional MRI data from these three groups along with genetic information, we could potentially identify combinations of target genes for these variants in social brain development. This could, in turn, determine what differentiates the high-risk children who do not develop any autistic tendencies, those who show the BAP, and those who develop autism. This could be a combination of genetic differences, compensatory changes in brain mechanisms, and pre- and postnatal environmental factors. For example, neuroimaging research could find that the BAP is correlated with intermediate levels of connectivity between those observed in neurotypical participants and those with full-fledged autism. This could then be related to different genetic and environmental factors. Insomuch as a failure to develop connectivity relates to the lack of development of social cognitive abilities, changes in connectivity across development are likely to be related to the emergence of social cognitive skills in typical development (Pelphrey & Perlman, in press). Finally, if factors affecting connectivity can be identified, it is possible that autism spectrum disorders could be prevented or treated.