


1. Introduction
Sea-ice extent (SIE) is an important climate variable. It influences Earth’s surface energy balance, and plays a major feedback role in climate changes at local to hemispheric scales. Large-scale measurements of Antarctic sea-ice extent are only available for the satellite era, since the 1970s. This hinders our understanding of the role of sea ice in climate forcing and of the mechanisms of long-term changes in SIE. For instance, in recent decades there has been a strong trend of declining Arctic sea-ice minimum extent, but a slightly increasing trend in Antarctic sea-ice maximum extent (Reference StroeveStroeve and others, 2012; Reference Gagne, Gillett and FyfeGagne and others, 2015). Whether these opposing responses to warming global average temperature are a long-term phenomenon, or have only appeared in recent decades, is unknown, largely because of the limited availability of reliable sea-ice records.
Although attempts have been made to reconstruct sea-ice extent in Antarctica from voyage and whaling records (e.g. Reference Cotté and GuinetCotté and Guinet, 2007; Reference Mare and WilliamDe la Mare and William, 2009), the early data are sporadic, discontinuous and limited in time series. In the 1990s, methanesulfonate (CH3SO– or MS–) was found to be a sensitive proxy of SIE in some sectors of Antarctica (e.g. Reference Welch, Mayewski and WhitlowWelch and others, 1993). This is because MS– (an oxidation product of dimethylsulphide, DMS, which is produced by sea-ice algae) is released when sea ice decays, and there is hence a strong link between the extent of the ice and the amount of MS– produced.
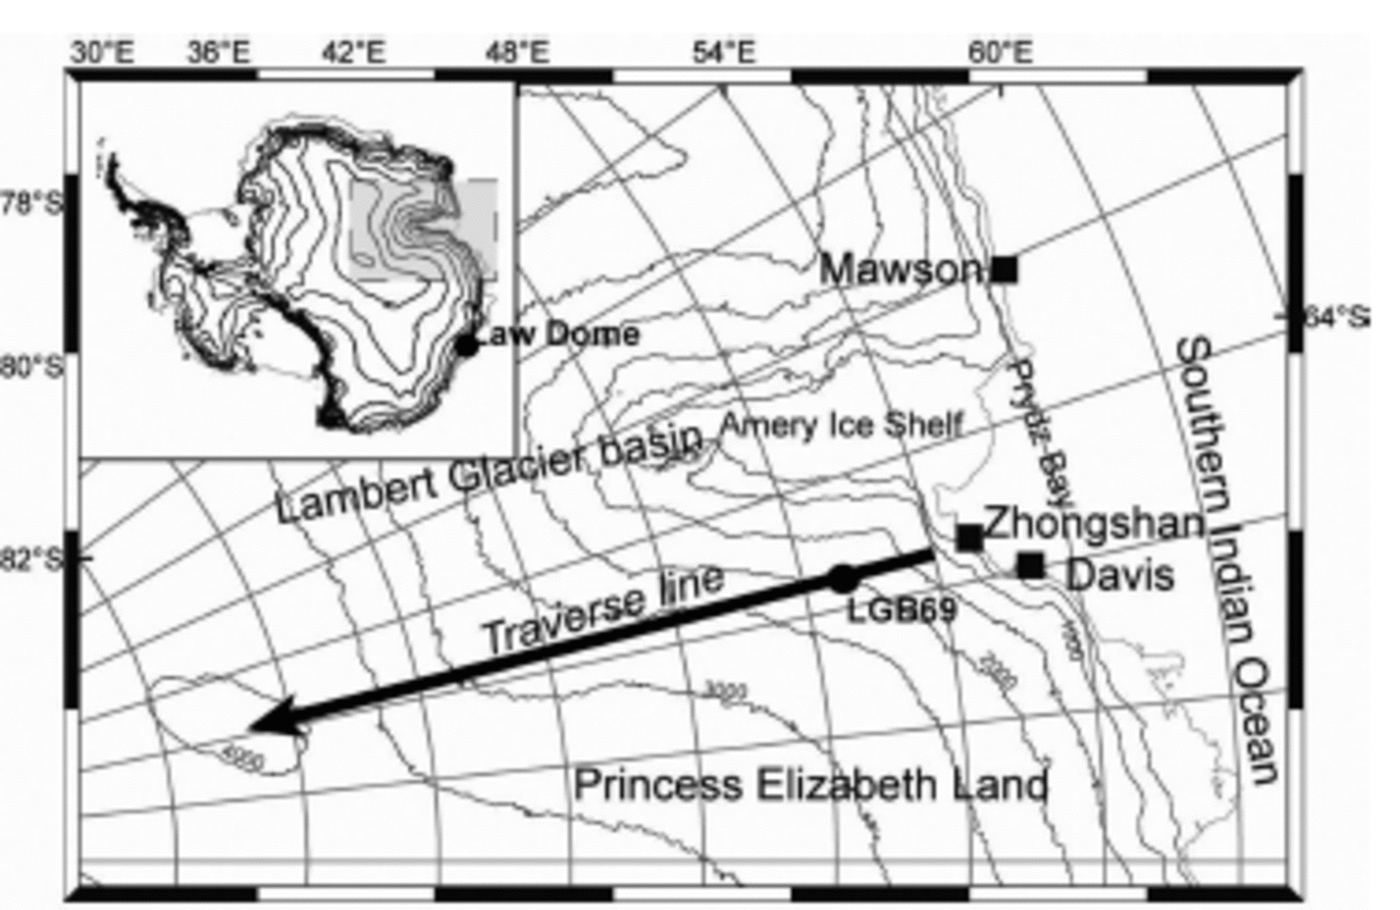
Both positive (Reference Welch, Mayewski and WhitlowWelch and others, 1993; Reference Myerson, Mayewski, Kreutz and MeekerMyerson and others, 2002; Reference Curran, Van Ommen, Morgan, Phillips and PalmerCurran and others, 2003; Reference Foster, Curran, Smith, Van Ommen and MorganFoster and others, 2006) and negative (Reference Pasteur, Mulvaney, Peel, Saltzman and WhungPasteur and others, 1995; Reference Ren and QinSun and others, 2002; Reference Abram, Mulvaney, Wolff and MudelseeAbram and others, 2007) correlations have been observed between MS– and SIE for different sectors of Antarctica. Reference Sneed, Mayewski and DixonSneed and others (2011) found correlations with opposing sign for different sampling sites across the Antarctic interior, and Reference Abram, Wolff and CurranAbram and others (2013) discussed site assessment and strategies for the further development of sea-ice histories from ice core MS–. But in the Indian Ocean sector, studies from Law Dome (110°E; Reference Curran, Van Ommen, Morgan, Phillips and PalmerCurran and others, 2003) and Wilhelm II Land (86° E; Reference Foster, Curran, Smith, Van Ommen and MorganFoster and others, 2006) have shown positive correlation between MS– and SIE, suggesting that the relatively uniform coastline east of the Lambert Glacier basin (LGB) may be a good region to recover a long SIE record for the southern Indian Ocean (SIO). However, there are still large geographical gaps in such reconstruction, with one of the largest being in the western part of this sector. Here we analyze MS– records in an ice core extracted in January 2002 from site LGB69 (70.83°S, 77.07° E; 1850 ma.s.l.). This site is located on the coastal escarpment of the ice sheet, ∼160 km from the coast (Fig. 1).
Location of LGB69, Princess Elizabeth Land, East Antarctica.
2. Ice-Core and Sea-Ice Datasets and their Relationship
The LGB69 ice core was drilled in January 2002 in Princess Elizabeth Land, East Antarctica, during the 18th Chinese National Antarctic Research Expedition (CHINARE-18). The core was 102 m long and was dated by counting 293 annual cycles of multiple chemical species as well as known volcanic events (Reference Sneed and YanLi and others, 2012), with high dating accuracy (±1 year at the bottom). There is a high snow accumulation rate (∼300kgm–2 a–1) at LGB69, recorded both by an automatic weather station and with a stake array (Reference QinQin and others, 2004; Reference DingDing and others, 2011), and hence the ice-core records from this region allow resolution of annual climatic signals from the adjacent high latitudes of the SIO. Over this near-coastal area of Princess Elizabeth Land, the integrated tropospheric moisture flux is southwards (Reference Abram, Wolff and CurranXiao and others, 2004a).
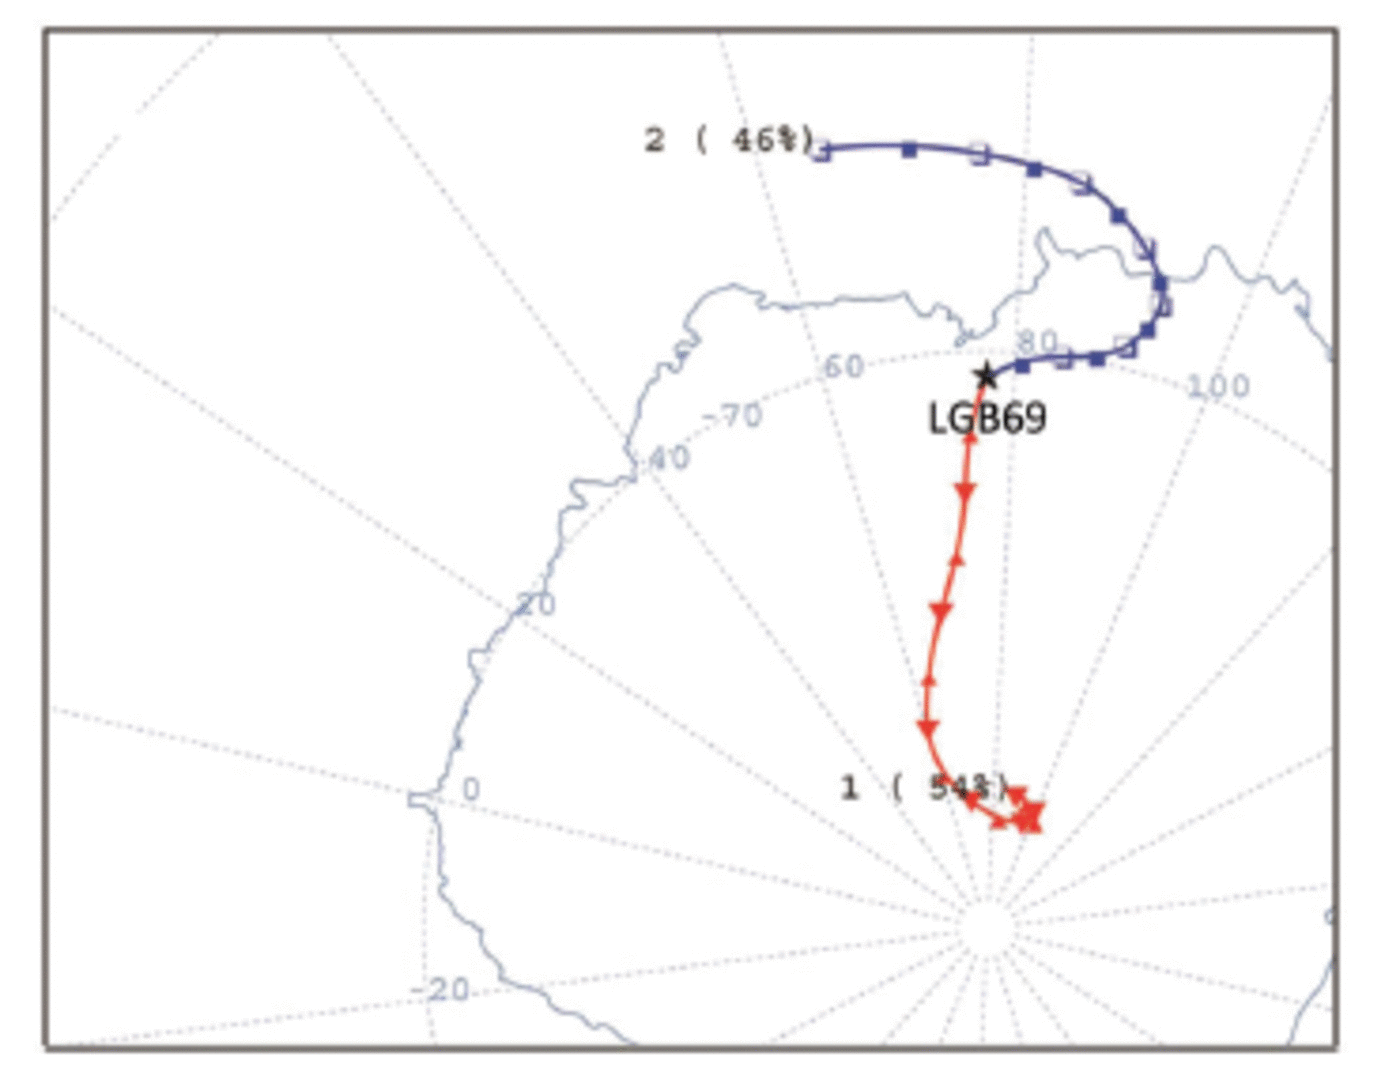
The trace chemical records preserved in the Antarctic surface snow and ice showed that with increasing distance inland and elevation, there is a decreased dominance of marine air masses and an increase in stratospheric source (Reference BromwichBromwich, 1988; Reference MulvaneyMulvaney and Wolff, 1994; Reference Legrand and MayewskiLegrand and Mayewski, 1997; Kreutz and Mayewski, 1999). Taking the 10 year sample 1991–99 as an example, we investigate the source of air masses reaching LGB69 by calculating backward trajectories, using the US National Oceanic and Atmospheric Administration (NOAA) HYSPLIT4 model (Reference Draxler and HessDraxler and Hess, 1997). European Centre for Medium-Range Weather Forecasts ERA-40 re-analysis atmospheric circulation data were applied as atmospheric forcing field. We calculate the clustered mean backward trajectories for December (the time of strongest melting of sea ice and release of DMS) averaged for 1991–99. This indicates 46% of air parcels reaching LGB69 come from the 30–120° E sector of the SIO, while 54% come from inland, probably via katabatic winds (Fig. 2). This is consistent with a result of an earlier study on LGB65 ice core (140 km further south of LGB69) which showed that a quasi-stationary low-pressure system in the SIO provides precipitation to Princess Elizabeth Land (Reference Xiao, Mayewski, Qin, Li, Zhang and YanXiao and others, 2004b).
Earlier studies suggested that MS– exhibits post-depositional movement, which may result in its loss from the snowpack (Reference MulvaneyPasteur and Mulvaney, 2000). This is more common for ice cores in regions where low accumulation rates were observed. For MS– in the LGB69 record, there was no evidence of post-depositional movement (Reference MayewskiMayewski and others, 2009). In the current study, annual records of MS– were compared to sea-ice extent records. The SIE dataset employed is based on US National Snow and Ice Data Center (NSIDC) sea-ice concentrations derived from passive microwave measurements from the Scanning Multichannel Microwave Radiometer (SMMR) on the Nimbus-7 satellite and from the Special Sensor Microwave/Imager (SSM/I) sensors on the US Defense Meteorological Satellite Program’s (DMSP) F8, F11 and F13 satellites (Reference StroeveStroeve, 2003; Reference ComisoComiso, 2010). In this study, we use monthly sea-ice concentration data, with a spatial resolution of 25 km x 25 km, for January 1979 to December 2000, and the ice edge is defined at 15% concentration.
Cluster means of backward air parcel trajectories arriving at LGB69 in December, 1991–99. The vertical level of the starting point is set at 1000 m a.g.l. (meters above ground level). A total of 1116 backward trajectories were integrated.
The mean monthly position of the SIE around Antarctica for 1979-2000 is shown in Figure 3a. The northernmost extent reaches ∼55°S over the sector 20-30° E at the seasonal maximum in September, and retreats as far south as ∼75° S over the sector 180-190° E at the seasonal minimum in February. These extremes are due to ice drift resulting from complex oceanic and atmospheric circulation, particularly in the deep embayments of the Ross and Weddell Seas, which also produce the well-known sea-ice dipole between the two sectors (Reference Yuan and MartinsonYuan and others, 2001). Over the more uniform coastline of East Antarctica between 70° E and 150° E, SIE changes have a relatively small seasonal amplitude, and are generally similar across the region. For the subsector 62-92° E, the clockwise gyre circulation in Prydz Bay, north of the Amery Ice Shelf (Reference Nunes Vaz and LennonNunes Vaz and Lennon, 1996), results in a larger SIE than elsewhere in the SIO (Fig. 3a). In addition, from backward trajectory analysis, we can see this sector was the main source of MS– in the LGB69 ice core. Therefore, we focus on the relationship between MS– in LGB69 and sea ice over the SIO.
(a) Average Antarctic SIE (area of ice within a 1° longitude band) as a function of longitude in different months for 1979-2000. The vertical lines indicate the sector with the highest correlation between LGB69 MS– and seasonal maximum SIE. (b) Correlation of LGB69 MS– with the seasonal maximum SIE over the circum-Antarctic (blue). The autocorrelation of SIE in the highest correlation sector with that at each longitude over the circum-Antarctic is also shown (red). Dashed circles are significance level of 0.05 and 0.01 respectively.

We correlate the annual average MS– (from June to the following July) in the LGB69 core with maximum SIE (average of August-October extent in the first winter of each record) over the circumpolar Antarctic for 1979-2000 (22 years inclusive). While this analysis is limited by the short satellite SIE record, it does show significant correlation. The highest correlation occurs over the sector 62-92° E (r2=0.25, P<0.02) (Fig. 3b). Although there are also correlations between LGB69 MS– and SIE over other more distant sectors of the Southern Ocean, they are largely due to the autocorrelation of the maximum SIE there with SIE averaged for 62-92° E (red lines in Fig. 3b). Combined with the result of backward trajectory analysis, it can be concluded that MS– in LGB69 most strongly reflects the sea-ice changes over the 62-92° E sector of the SIO.
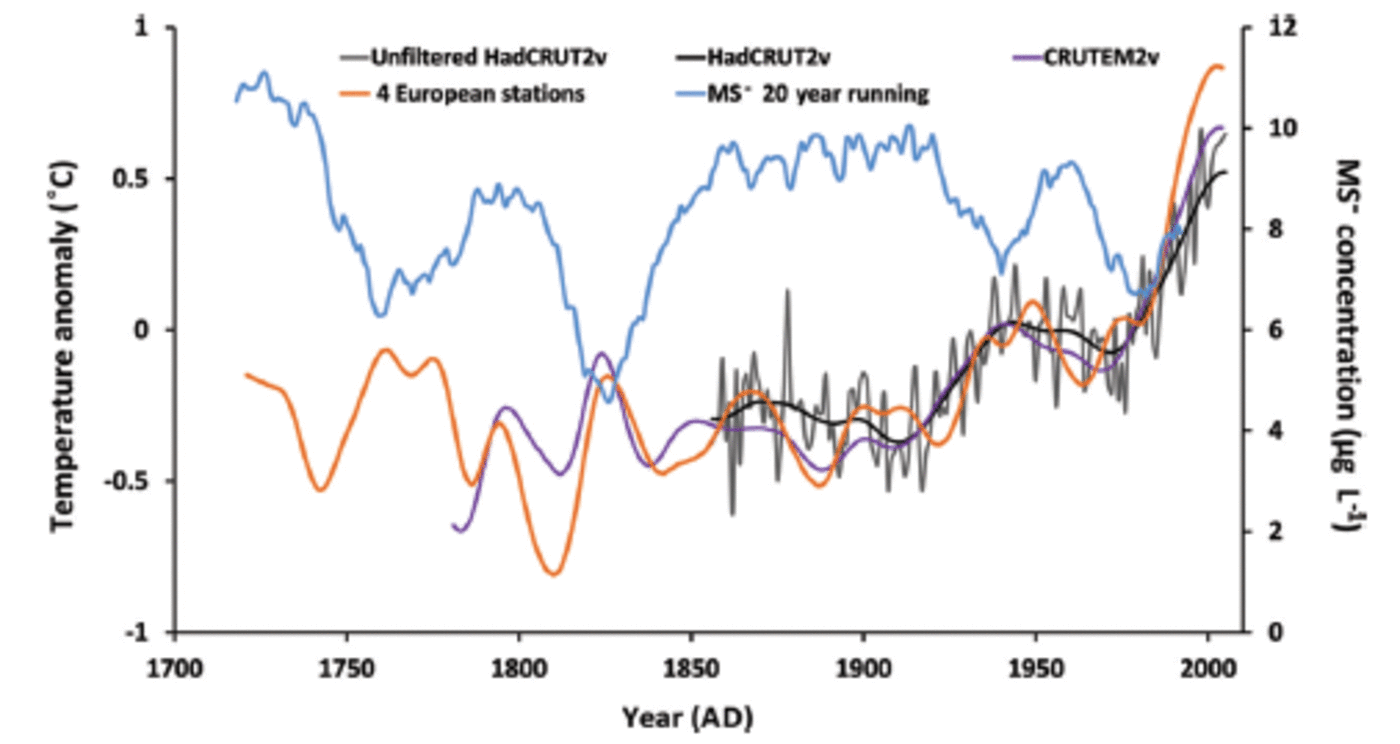
The 293 year MS– record from LGB69 in Figure 4 shows that there have been multi-decadal fluctuations of MS– (and thus of SIE in the 62–92°E sector) since AD 1708. Large retreat of SIE occurred in the 1750s, 1830s, 1940s and 1980s. We compare this SIE proxy with the Northern Hemisphere temperature records from the Intergovernmental Panel on Climate Change (IPCC) Fourth Assessment Report (AR4), which are the HadCRUT2v temperature data since AD1856; the CRUTEM2V data since AD 1781; and data from four European stations (central England, De Bilt, Berlin and Uppsala) since AD 1721 (Reference Jansen and SolomonJansen and others, 2007). We found a general correspondence between the major cooling/warming cycles and SIE over approximately the last 300 years (Fig. 5) and with the variability at decadal and centennial scales
Variations in LGB69 MS– since AD 1708 (blue, left axis) and in SIE since AD 1973 (black, right axis). The 3 year smoothed (thick blue) and 20 year smoothed (purple) MS– records are also shown. The series of MS– and SIE for the last 22 years and their linear correlation are shown separately.

This consistency is not coincidental. Although circumpolar Antarctic SIE variations are not regionally coherent, SIE variations over the SIO are much more uniform than those of the Ross and Amundsen–Bellingshausen Seas (the Antarctic sea-ice dipole; Reference Yuan and MartinsonYuan and Martinson, 2001). The Indian Ocean sector (62–92° E) explains 30% of the total variance of circumpolar SIE, suggesting that SIE variability in this sector, for which the LGB69 MS– provides a proxy, may reflect circumpolar SIE variability.
The MS– proxy SIE record (Fig. 5) shows SIE retreat during two relatively warm periods during the late Little Ice Age, in AD1740–70 and 1820–40. Smaller SIE retreat can also be seen around a period of warming in the 1940s. In between these warm periods there is a relative expansion in SIE. We thus hypothesize that in the past the long-term circumpolar variation of Antarctic SIE was mainly controlled by the global temperature. However, more recently, warming in the late 1970s to early 1980s is associated with an expansion in SIE.
Temperature changes in the Northern Hemisphere from IPCC AR4 (see legend) and the 20 year smoothed LGB69 MS– changes (blue).
3. Sea-Ice Changes Over the Wider Southern Indian Ocean
In Figure 6, we compare the 20 year smoothed SIE anomalies from our proxy for 62-92° E with those derived by Reference Curran, Van Ommen, Morgan, Phillips and PalmerCurran and others (2003) for the sector 80-140° E. The anomalies in both cases are calculated as the difference from the average proxy SIE for the 100 year period 1887 1986 (inclusive). The average proxy SIE for the 62-92° E sector over this time is 58.7° S, and for the 80-140° E sector, where the ice extent is narrower (Fig. 3a), it is 59.9° S.
Antarctic sea-ice extent anomalies for the 62–92° E sector (LGB69 proxy) and the 80–140°E sector (DSS proxy; from Reference Curran, Van Ommen, Morgan, Phillips and PalmerCurran and others, 2003).
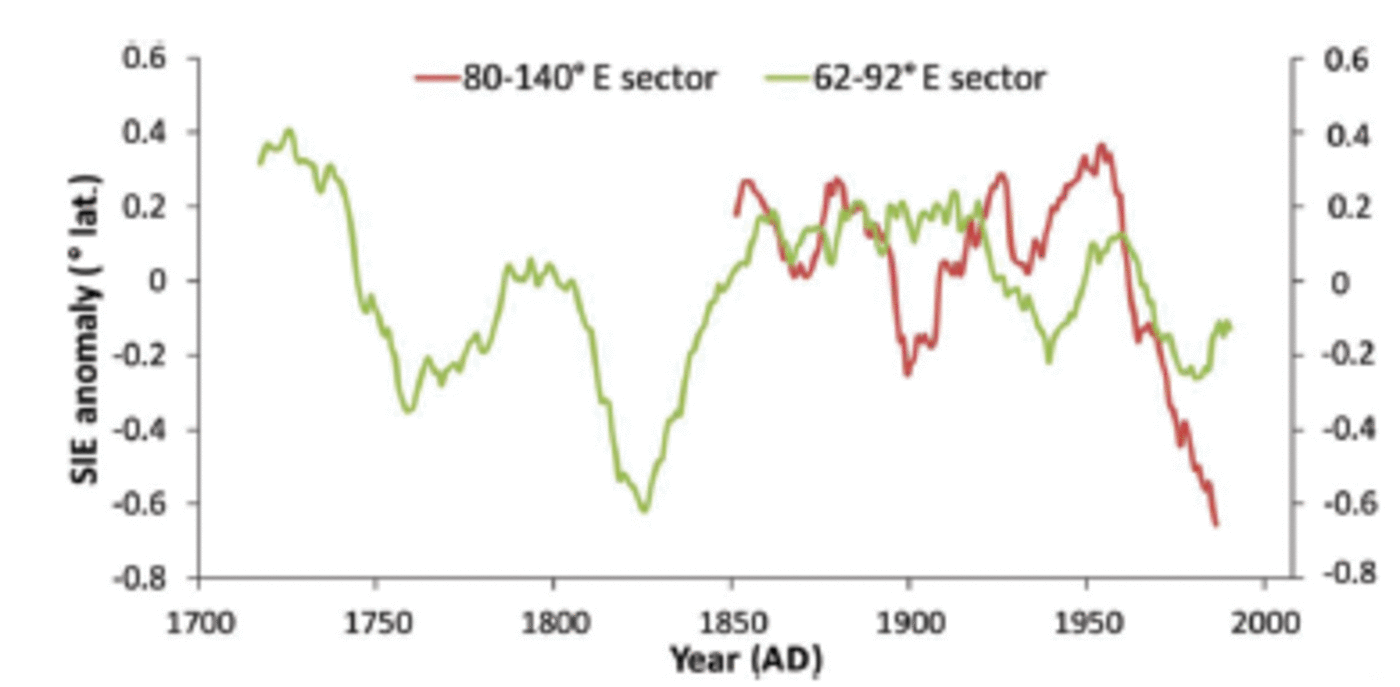
The two anomalies show general similarities in the timing of SIE changes, although there are differences in the magnitude of the change and in the finer detail. In particular, an increase in SIE from about the 1930s to the 1960s followed by a rapid decrease is indicated in both records, although the decrease for the 80-140° E sector is ∼1° of latitude, whereas for 62-92° E it is <1/2° of latitude. Satellite observations show that trends in sea-ice extent are not uniform around Antarctica (e.g. Reference Comiso and NishioComiso and Nishio, 2008), and may even be of opposite sign in different regions. Sea-ice concentration trends may also be regionally out of phase (Reference ComisoComiso, 2010) and these differences have been linked to large-scale atmospheric circulation patterns and, in the case of the 62-92° E sector, to ocean circulation in the Prydz Bay Gyre. For example, Raphael (2007) shows a relationship between atmospheric zonal wave and variability of Antarctic sea-ice concentration, with a strong positive correlation between the two occurring in our study area off the Amery Ice Shelf (62-92° E). The proxy record for the 62-92° E sector shows a subsequent increase in SIE since ∼1985, but this time segment is not covered in the record of Reference Curran, Van Ommen, Morgan, Phillips and PalmerCurran and others (2003).
4. Conclusions
Methanesulfonate from an ice core from LGB69 in Princess Elizabeth Land provides a proxy record of variations in Antarctic sea-ice extent between 62° E and 92° E over about the past 300 years. This provides a historical record additional to the result of Reference Curran, Van Ommen, Morgan, Phillips and PalmerCurran and others (2003). It is demonstrated from the LGB69 MS– records that SIE in the sector 62-92° E retreated during two relatively warm periods during the late Little Ice Age, in AD 1740-70 and 1820-40. Smaller SIE retreat can also be seen occurring in the 20th century, around the 1940s and in the late 1970s to early 1980s. The covariation between SIE of sector 62-92° E and global temperature supports the hypothesis that the Antarctic sea-ice variation at long-term scales is controlled by the global temperature change. However, further investigation is needed of the apparent change in phase between temperature and SIE in recent decades, and thus on whether the dominance of global temperature on the Antarctic sea-ice variation has decreased in the past decades.
This study has expanded the long-term variation of sea ice in the SIO. The proxy record of SIE for the 62-92° E sector shows similar broad trends to an earlier MS– proxy record (from a Law Dome ice core) for the adjoining 80-140° E sector. In particular there was a major decrease in SIE over the broader region from ∼1950 until the early 1980s. However, there are differences in the timing and magnitude of SIE trends in the two sectors. This highlights the fact that MS– records from ice cores generally provide proxy sea-ice information over only a limited longitude band, and that no single ice core record is likely to provide a good record of overall Antarctic sea-ice changes.
Acknowledgements
The study is supported by the Ministry of Science and Technology of China (MoST, 2013CBA01804), the National Nature Science Foundation of China (NSFC, 41425003, 41421061, 41476164), the State Key Laboratory of Cryo-spheric Sciences (SKLCS-ZZ-2012-05), the Chinese Academy of Sciences and the Chinese Arctic and Antarctic Administration (CHINARE2013-01-02, 03). The contribution of I.A. was supported by a grant from the Chinese Academy of Sciences Visiting Professorship for Senior International Scientists (No. Y129N31001). We thank Mark Curran for providing proxy sea-ice data from the Law Dome DSS ice core. We also thank E. Thomas, I. Eisenman and two anonymous reviewers for valuable comments which helped substantially to improve this paper.



