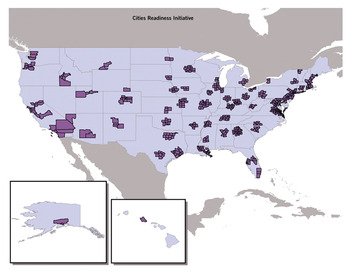
The Cities Readiness Initiative (CRI) is a federally funded program designed to assist with maximizing response capabilities of local health authorities during a large-scale public health emergency. The initiative was established using a defined scenario to facilitate planning for a coordinated response in the event of a wide-spread release of aerosolized anthrax in a community. The objective of CRI is to ensure that major metropolitan statistical areas (MSAs) have the necessary capacity to dispense life-saving antibiotics to the entire population within a 48-hour time frame. The US Office of Management and Budget (OMB) defines the boundaries of MSAs based on criteria that are applied to US Census Bureau data.1 The general concept of an MSA is that the core area is substantially populated with 50 000 or more people and the surrounding communities are highly integrated into the socioeconomic foundation of the core area. The 72 MSAs that are included in the CRI program encompass more than 500 counties and cities representing more than 50% of the US population.2 Each state has at least 1 MSA participating in the CRI program (Figure 1).
Cities Readiness Initiative, 2008-2009.

The Centers for Disease Control and Prevention (CDC) Public Health Emergency Preparedness cooperative agreement is the mechanism that is used to award funds to the state health departments for the execution of the CRI program.3 The state health departments receive guidance, with the allocated amount provided to the predetermined CRI MSAs within their state boundaries.4 Since 2008, public health preparedness stakeholders have been developing and refining performance requirements to account for the application of the funds in the area of medical countermeasure distribution and dispensing.Reference Nelson, Chan and Chandra5Reference Nelson, Beckjord, Dausey, Chan, Lotstein and Lurie6 One performance requirement for the CRI program awardees is to conduct 3 or more standardized drills annually to test various components of the mass dispensing plan for medical countermeasures in the event of a public health emergency. This report describes the results of the first year of pilot data for medical countermeasure drills conducted by the CRI MSAs to test plans for meeting the objective of dispensing medical countermeasures to the entire MSA population within a 48-hour time frame during business hours compared to non-business hours.
METHODS
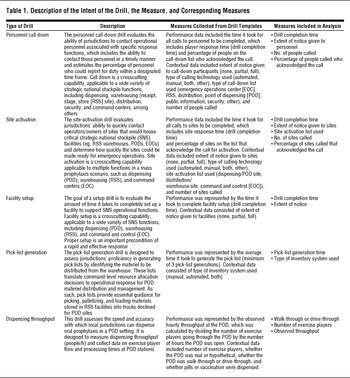
Data collection templates for each of the drills were developed in Microsoft Excel by CDC and RAND Health. These drills were designed to account for the geographic, demographic, and economic diversity among the 72 MSAs and to improve the standardization of results.Reference Nelson, Chan and Fan7 The drill templates were focused on tasks that (1) represent critical failure points in a medical countermeasure distribution and dispensing process, (2) address aspects of preparedness that are relevant across a wide range of threat scenarios and community contexts, (3) address aspects of preparedness that are readily observable, and (4) target aspects of preparedness largely under public health control. The drill templates consisted of 5 modular standardized exercise data-collection worksheets. The templates may be used as stand-alone assessments or in combination in a large exercise. The drills were small in scale, testing fairly narrow and specific processes (Table 1). The specific measures were designed to be specific, measurable, achievable, realistic, and timed.
Description of the Intent of the Drill, the Measure, and Corresponding Measures

Sample
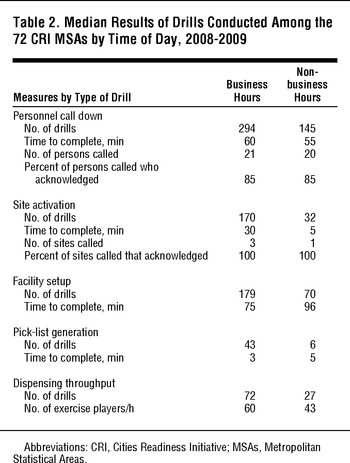
Results from 1545 drills were received from the 72 CRI MSAs, which also included submissions (n = 212) from non-CRI jurisdictions. Results not included in the analytic sample were from drill templates with incomplete data, duplicate templates, and data from non-comparable drills; from non-CRI jurisdictions; or with extreme outliers (eg, unrealistically short or long times). The analytic sample was composed of 1063 drills, including 445 personnel call downs, 203 site activations, 254 facility setups, 49 pick-list generations, and 112 dispensing drills (Table 2).
Median Results of Drills Conducted Among the 72 CRI MSAs by Time of Day, 2008-2009

Data Set Construction
Protocols were developed for each drill type, translating the raw data into working data sets. For the personnel call down, site activation, and facility setup results, the data were electronically merged using Visual Basic within Microsoft Excel, as each of these drill types was relatively standardized. For electronic merging, Visual Basic scripts identified cases where the templates had been altered (eg, by checking whether labels had been moved), which were reformatted by hand. For dispensing throughput and pick-list generation, however, electronic merging was not possible. For example, the dispensing drill was tailored for each of the sites to use point-of-dispensing (POD) designs contained in their plans to distribute and dispense medical countermeasures from the Strategic National Stockpile. These plans varied in the number of steps for each stage of dispensing. The less-standardized data were more easily and reliably compiled through traditional hand coding, with coders transferring data from the templates to a Microsoft Access database using a forms interface. Hand-coded variables were then cross-validated by a pair of coders. In all cases, computation of performance measures was cross-validated by reviewing the working data sets manually and electronically to identify outliers or unusual observations. Finally, in many cases useful qualitative (ie, free text) data were extracted and had to be coded to provide additional contextual information (eg, whether a POD was conducted as a drive-through or walk-through design).
Data Analysis
Data analyses were conducted by using SAS, version 9.2 (SAS Institute). Analyses were conducted to determine whether the measures were comparable across business and non-business hours. A drill was considered to have been conducted during business hours if it started between 8:00 AM and 5:00 PM on a weekday (Monday-Friday), regardless of when it ended. Drills started between 5:01 PM and 7:59 AM and all day Saturday and Sunday were considered to have been conducted during non-business hours. Means and medians were calculated for each of the continuous variables. Frequencies were calculated for categorical variables. The skewed nature of some of the data indicates that the median is the most appropriate measure for reporting results.
RESULTS
A majority of all drills were conducted during business hours (73%, n = 758) on a Wednesday (23.8%, n = 251) or Thursday (24.1%, n = 255). Personnel call down was the most common drill conducted. The median completion time for the personnel call-down drill was 1 hour during business hours (n = 287) and 55 minutes during non-business hours (n = 136). Most of the call-down drills were conducted giving no notice to personnel (business: 59%, n = 172; non-business: 68%, n = 98). Partial notice to personnel (participants knew a drill was to occur within a certain time period but not told the exact date and time) (business: 34%, n = 99; non-business: 23%, n = 33) occurred less often than no notice but more frequently than full notice to personnel (business: 7%, n = 21; non-business: 10%, n = 14). The median number of persons called was 21 persons for business and 20 persons for non-business hours. The median percentage of persons who responded to the call-down message was comparable during business hours and non-business hours (85%).
The site-activation drills were completed in a median of 30 minutes during business hours and 5 minutes during non-business hours. The majority of site-activation drills conducted during business hours gave no notice to sites (59.2%, n = 97). Jurisdictions indicated that they most commonly called down PODs (business: 62%, n = 106; non-business: 44%, n = 14). At least 20% of drills conducted during business or non-business hours reported using another kind of list. The median number of sites called during business hours (n = 3) was higher than during non-business hours (n = 1). The median percentage of sites that responded to the call-down message was the same during business hours compared to non-business hours (100%).
Facility setup drills were completed more rapidly during business hours (75 minutes) compared to non-business hours (96 minutes). The majority of facility setup drills conducted gave full notice to personnel (business: 75%, n = 123; non-business: 83%, n = 52) followed by partial notice (business: 16%, n = 26; non-business: 13%, n = 8), and no notice to personnel (business: 10%, n = 16; non-business: 5%, n = 3).
During business hours, pick lists were generated in a median of 3 minutes compared to 5 minutes during non-business hours. The inventory system used to create pick lists was overwhelmingly automated (business: 71%, n = 44; non-business: 75%, n = 6). During business hours, manual systems (24%, n = 15) were used more frequently than hybrid systems (5%, n = 3). However, during non-business hours, manual and hybrid systems were used equally (12.5% each).
Among all dispensing drills, a majority of PODs were walk-through (business: 82%, n = 64; non-business: 79%, n = 23) as opposed to drive-through (business: 14%, n = 11; non-business: 14%, n = 4). In a small number of drills, the POD type could not be determined (n = 5).
The median number of exercise players going through the POD was higher during non-business hours (137) compared to business hours (114). The median observed throughput during business hours (60 people/h) was higher than that during non-business hours (43 people/h).
COMMENT
Dispensing of medical countermeasures to the public during a public health emergency is of national importance, in that it is potentially life-saving for people who may require postexposure prophylaxis for anthrax or other public health emergencies. The drills are intended to test specific operational capabilities of each local jurisdiction's plan. The question arises as to how much time it will take a project area to be prepared to dispense medical countermeasures.
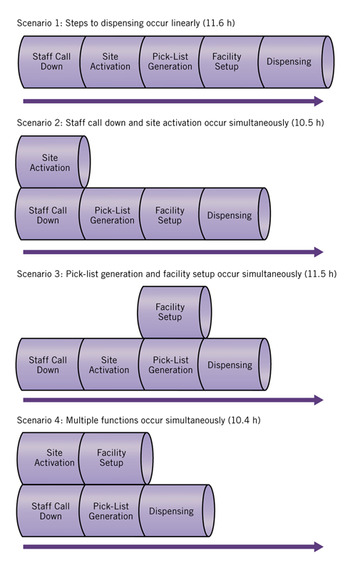
There are several ways to determine the amount of time local jurisdictions need to be prepared to dispense medical countermeasures. The results of the current analyses demonstrate that the average amount of time needed to prepare for dispensing medical countermeasures is at least 11.6 hours for CRI MSAs, which includes call down, site activation, facility setup, and pick-list generation. These data are based on complete information for personnel call-down, site activation, facility setup, and pick-list generation drills within 14 CRI MSAs.
The 11.6-hour time frame is grounded in the assumption that the end-to-end process to be prepared to dispense medical countermeasures is linear, although it is possible that many processes could occur simultaneously. Figure 2 represents 4 possible scenarios for completing the steps necessary to dispense, including linearly (scenario 1), call down, and site activation occurring simultaneously (scenario 2), facility setup and pick-list generation occurring simultaneously (scenario 3), and the combination of both sets of drills occurring simultaneously (scenario 4). Comparison of the most conservative estimate (scenario 1) to the most streamlined (scenario 4) indicates a difference of slightly more than an hour between these estimates.
Four Possible Scenarios to Prepare to Dispense Life-Saving Medical Countermeasures.

The data presented here, although limited in the ability to predict the performance during a real world event, provide a platform for planning jurisdictions to gauge individual performance against the results of national averages. Although the data collected and presented in this report are assumed to be representative data from reporting jurisdictions, continued evaluation of average response times by local planning jurisdictions will be necessary to extrapolate to performance during a real-world event.
Future analyses will compare the results of drills that have been conducted between 2008 and 2010. Data that are being collected during the current CDC Public Health Emergency Preparedness cooperative agreement performance period will also be included to combine 3 years of results that will help determine and refine the estimated continuum of time that most local jurisdictions spend to notify, set up, distribute, and dispense medical countermeasures.
CONCLUSIONS
The results of the analyses from this pilot sample of drill submissions provide a baseline for the determination of a national standard in operational capabilities for local jurisdictions to achieve in the planning efforts for a mass dispensing campaign during an emergency. The evaluation and documentation of the operational processes leading to medical countermeasure dispensing are important components in preparedness planning at the local level. Although the operational drills identified in this report can be considered a foundation for which local jurisdictions may gauge operational capabilities, the fidelity of individual response times and the subsequent translation into performance during real world events will depend on the accuracy of representative data to translate across multiple sites. It also will depend on the specifics of the emergency event and the context in which they are applied.
Acknowledgments: Many thanks to our state and local partners for their extraordinary work in strengthening the public health preparedness infrastructure by exercising and planning to dispense life-saving medical countermeasures to their populations. The innovative drill data collected and submitted to the Centers for Disease Control and Prevention by the participating jurisdictions demonstrate the committed efforts of all state and local Strategic National Stockpile program staff. Edward Chan, PhD, Christopher Nelson, PhD, and Shoshana Shelton, MPH, RAND Health, participated in the design and collaboration of the drill data collection templates.