Background
The objective of external radiotherapy is to deliver the most ablative dose to the target volume while sparing the surrounding healthy tissues. For this purpose, irradiation techniques developed to be delivered by linear accelerators are the 3D conformal radiotherapy (3DCRT) and the intensity modulated radiotherapy (IMRT).
Compared with 3DCRT, the expected benefits of intensity modulation are a better conformation to planning target volume (PTV), especially for complex forms, and a better savings of organs at risk (OAR). 1
Today, validated indications in France for IMRT are the head and neck cancers, prostate, spine, base of the skull and recently the anal canal and cervical cancer with lymph node invasion. 2 This is not yet the case for non-small cell lung cancer (NSCLC).
However, lung cancer is one of the most important cancer sites in the world with a largely unfavourable prognosis. Five-year survival rates for stage IIIA and IIIB diseases do not exceed 6–8%. Reference Auperin, Le Péchoux and Pignon3 Recent studies show that the prognosis of patients can be improved by immunotherapy which makes it important to manage the toxicities induced by treatments (heart and lung). Reference Antonia, Villegas and Daniel4 The impact of the dose remains adverse to OAR; however, the majority of the studies are in favour of an increase in the dose. Reference Vera, Mihailescu and Lequesne5,Reference Yuan, Sun and Li6 The study RTOG0617 is negative for the arm with high-dose of 74 Gy compared to the arm with standard-dose of 60 Gy both with conventional fractionation schemes (2 Gy fractions). The higher dose might increase toxicity in critical organs. Reference Bradley, Paulus and Komaki7
Several studies Reference Bree, Van Hinsberg and van Veelan8,Reference Ong, Verbakel, Cuijpers, Slotman, Lagerwaard and Senan9 have compared the 3DCRT and volumetric modulated arc therapy (VMAT), which confirm a dosimetric improvement of the latter in terms of conformation to the target volume and reduction in the dose delivered to the OAR. This problem is all the more true since the dose of radiotherapy to OAR can limit therapeutic indications or lead to significant radiotoxicities, which can be increased by the addition of immunotherapy in maintenance. These modern techniques could allow higher and heterogeneous doses to be delivered (dose painting).
Some questions are however raised by some publications concerning low doses to the healthy tissues (V5Gy and V10Gy) due to the multiplication of the number of beam entries during irradiation. Solutions are proposed such as partial arcs or hybrid techniques associating VMAT and 3DCRT. Reference Mayo, Urie and Fitzgerald10,Reference Chan, Lee, Hung, Chang, Yeung and Lee11 Considering that the results are closely related to the way of calculating the treatment plan, we decided in addition to the bibliographical study to undertake a dosimetric comparison of the two irradiation techniques, 3DCRT and VMAT. We will also study the possibility to optimise treatment plans to achieve the best planning option.
Finally, our aim is to evaluate precisely for lung cancer the dosimetric impact that would result from the switching between planning techniques.
Patients and Methods
Patients
This was a retrospective study that included 36 patients treated in our centre with 3DCRT for NSCLC between 2015 and 2017. All these patients had their plans delineated and validated by the same experienced physician. This study did not need ethical approval.
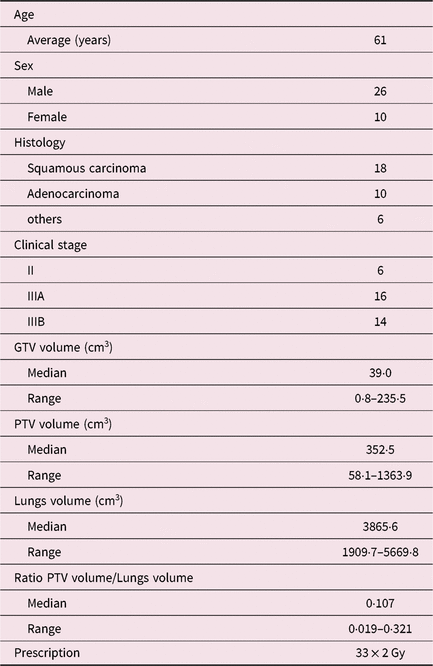
The group consisted in 26 men and 10 women mainly clinical stage IIIA and IIIB. The more detailed characteristics of pathologies and irradiated target volumes are summarised in Table 1. For each patient treated with 3DCRT, a second VMAT treatment plan was calculated using either two complete arcs (VMAT-CA, 5 patients) or two partial arcs (VMAT-PA, 31 patients), depending on the location of the volume to be irradiated. Moreover, to investigate whole-body irradiation at low doses, 14 additional treatment plans initially in VMAT-PA have been re-optimised in VMAT-CA and were used to compare the V5Gy, the V10Gy and the V15Gy to the 3DCRT. All the patients in this study received a total dose of 66 Gy in 33 fractions to PTV.
Patient characteristics (n = 36)

During the scanner acquisition (GE Optima580RT, Milwaukee, WI, USA) with a 2·5 mm slice thickness, the patient was positioned on a Posirest™ supine head position, with both arms above the head and knees resting on a Kneefix™ wedge (CIVCO Radiotherapy, Orange City, IA, USA). The acquisition area extended from the base of the neck to the lower abdomen.
From the GTVn (gross tumour volume—nodal) and/or GTVt (gross tumour volume—tumour) and then CTVn (clinical target volume—nodal) and/or CTVt (clinical target volume—tumour) volumes delineated by the physician, a margin of 1 cm is added to create the PTV. The objectives of the 3DCRT treatment plans were, in accordance with ICRU (International Commission on Radiation Units and Measurements) recommendations, 12,13 that at least 95% of the dose covers 95% of the volume with a maximum dose of 107%.
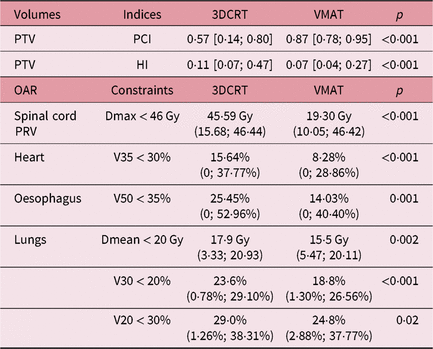
The OAR that have been taken into account are the spinal cord planning organ at risk volume (SC PRV), created by adding a symmetrical margin of 5 mm around the spinal cord, lungs, oesophagus and heart. The dose constraints used in clinical routine are those described in Table 2.
Dosimetric comparison of both techniques. Median accompanied by the minimum–maximum extreme values for HI and PCI for PTV of 3DCRT and VMAT (up). Constraint and median [min-max] values for the OARs of the two techniques (down)

Planning treatment techniques
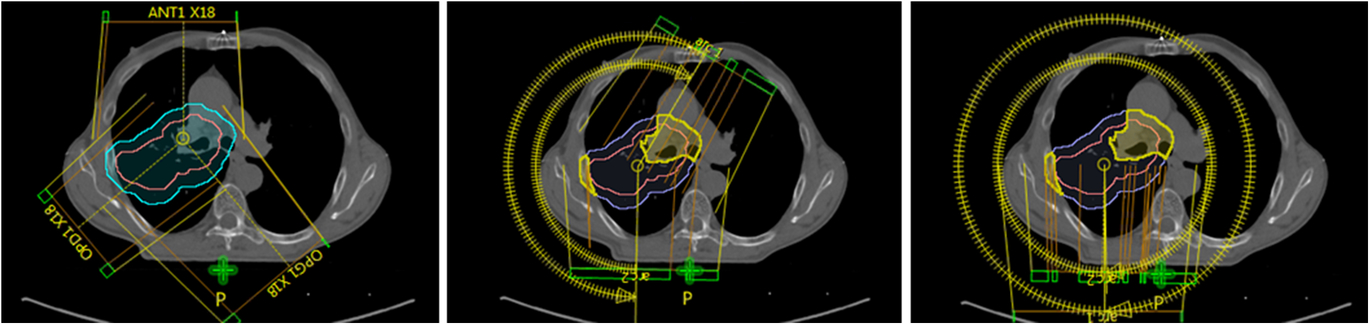
Patients were treated on Varian Linear Accelerators Clinac iX with MLC120 or Truebeam STX MLC120HD (Varian Medical Systems, Palo Alto, CA, USA) with daily kV-CBCT imaging (Figure 1). The dosimetric calculation was performed using the Eclipse treatment planning system (AAA 13.6.23, 0·25 cm grid; Varian Medical Systems).
From the left to the right the three treatment plans compared in this study, 3DCRT, VMAT-PA and VMAT-CA. CTV (pink), PTV (blue), PTVair (purple), PTVdense (yellow) volumes are also represented.

3DCRT
All of the 36 patients were treated using 3DCRT technique. The treatment plan was based on three beams, ‘Y-technique or inverted Y-technique’, with at least one beam that avoided the spinal cord. If necessary a weakly weighted fourth beam was added. The beam energy used was preferentially 6 MV with the possibility of using an 18 MV beam in the case of over-dose in the muscles. 14,Reference Aarup, Nahum and Zacharatou15 Normalisation was done at the main reference point centred in the target volume.
Volumetric modulated arc therapy
Treatment plan was performed either with 2 complete arcs (5 plans) or with 2 partial arcs (31 plans), according to the localisation of the volume to be irradiated. The PRO v13.6.23© (Varian Medical Systems) is used for optimisation.
To compare VMAT-PA and VMAT-CA techniques, 14 VMAT-PA plans were re-optimised using complete arcs, in order to obtain 19 VMAT-PA plans. We then compared the low doses of these 19 VMAT-CA plans and the 31 VMAT-PA plans with the 3DCRT technique taken as reference.
The normalisation, 100% of the prescription dose covers 50% of PTV, was following the recommendations of ICRU. 13
To improve dose gradients, several optimisation rings around the PTV were used. PTVair and PTVdense volumes, respectively, corresponding to the portion of PTV in the parenchyma and in the dense part of the tissue, facilitate the target volume coverage. The volumes OAR—(PTV + 2 mm) also helped to better optimise on the OAR especially for lung—PTV, SC PRV—PTV and heart—PTV.
In all cases, the treatment plan is based on a pair of arcs, one clockwise and the other counterclockwise with collimators set at 30 and 330° to encompass the entire target volume and minimise the tongue and groove effect specific to Varian MLC. Reference Kim, Park and Park16 The maximum dose rate is set at 600 MU/minutes.
Criteria for comparing 3DCRT and VMAT
Planning target volume
The doses delivered to PTV were obtained with the dose–volume histograms (DVHs). From these DVHs, we compared the Paddick conformity index (PCI) Reference Paddick and Lippitz17 defined by:
 $$PCI = {{{{(PTV\, \cap \,{V_{95\% }})}^2}} \over {({\rm{PTV}}\, \cup \,{{\rm{V}}_{95\% }})}}$$
The V 95% value corresponding to the volume received at least 95% of the prescribed dose. We also use the homogeneity index (HI) defined by ICRU report 83 13 :
 $$HI = {{({D_{2\% }} - {D_{98\% }})} \over {{D_{50\% }}}}$$
The D x% value is the minimum dose received by x% of PTV. The best plan will be characterised by a PCI closest to 1 and an HI closest to 0.
Organs at risk
Doses to OAR were evaluated using their DVHs and the constraints used in our centre (Table 2).
Statistical study of the data
The comparison of the different techniques is based on non-Gaussian data distributions. It was therefore performed using the non-parametric Wilcoxon test and using the statistical study software R (version 3.4.4). Median, minimum and maximum values were calculated, associated with a p-value with a threshold of 0·05 below which the difference is considered significant.
Results
PTV results
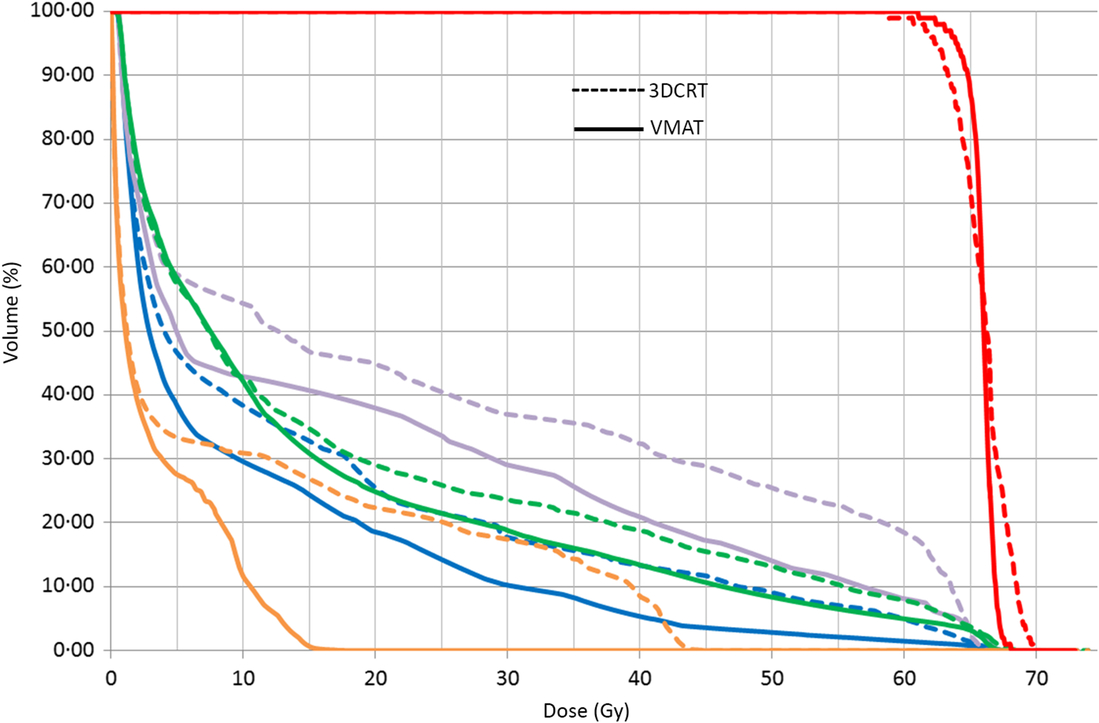
The median DVH of the PTV for both VMAT and 3DCRT techniques shows qualitatively a clear improvement in dose coverage for the intensity modulation (Figure 2).
The median DVH for PTV (red) and OARs (oesophagus: purple, lungs: green, heart: blue, SC PRV: orange) of the 3DCRT (dashed curves) and VMAT (solid curves) treatment plans.

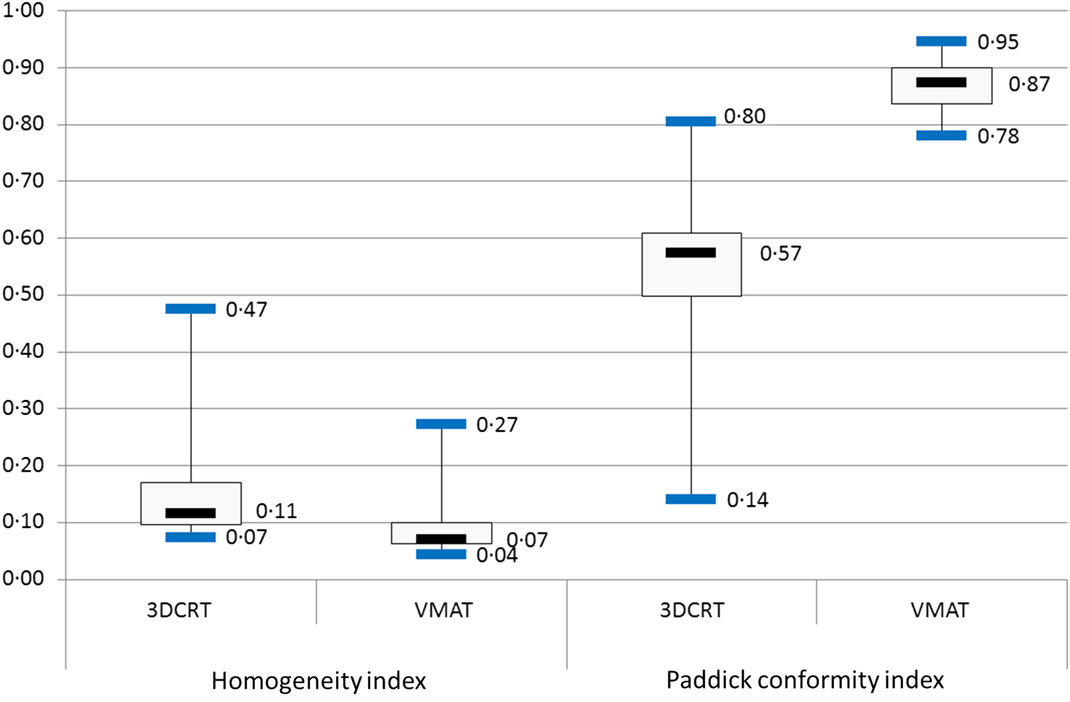
The PCI as defined in the previous paragraph (1) is greater in VMAT (0·87) compared to the 3DCRT (0·57) (p < 0·001). The HI (2) is better in VMAT than in 3DCRT, the HI being, respectively, 0·07 and 0·11 (p < 0·001), see Table 2.
Moreover, for these conformity and homogeneity indices, the interquartile gap is 44 and 50% lower, respectively, in VMAT compared to the 3DCRT, which clearly indicates a lower dispersion in favour of the VMAT and therefore a better reproducibility in treatments (Figure 3).
Boxplots for homogeneity index (left) and Paddick conformity index (right) for the two treatment plans.

OAR study
The results of doses to the OAR are summarised in Table 2.
Spinal cord PRV
For the SC PRV, the difference between the median DVHs of VMAT and 3DCRT is clearly visible (Figure 2).
The median maximum dose (Dmax) decreases by 58% in VMAT compared to 3DCRT (19·30 and 45·59 Gy, respectively, p < 0·001), which represents a difference of more than 25 Gy.
Heart
Like the spinal cord, a decrease in the doses received by the heart in VMAT compared to the 3DCRT is visible on the median DVH (Figure 2).
The median heart volume receiving at least 35 Gy (V35) decreased by 47%, from 15·64% in 3DCRT to 8·28% in VMAT (p < 0·001). The maximum value for the latter technique (28·86%) is lower than the dose constraint set at 30%, unlike the 3DCRT for which the maximum value is 37·77% (Table 2).
Oesophagus
DVH also shows a decrease in doses received by this organ. The V50 is significantly higher in 3DCRT than in VMAT (25·45 and 14·03%, with p < 0·001, Table 2).
Lungs
The median DVH for the lungs follows the same tendency observed for the other OAR (Figure 2).
The mean lungs dose is 17·9 Gy in 3DCRT against 15·5 Gy in VMAT (p = 0·002), a decrease of 13%.
The minimum value is higher in VMAT (5·47 Gy) than in 3DCRT (3·33 Gy, Table 2) and the maximum values for the two techniques remain close to the constraint of 20 Gy.
The lungs volume receiving more than 30 Gy (V30) is 23·6% in 3DCRT against 18·8% in VMAT (p < 0·001), a decrease of 20%. This latter value meets the 20% constraint used in clinical routine, unlike 3DCRT (Table 2).
For lungs volume receiving more than 20 Gy (V20), the decrease from 29·0% in 3DCRT to 24·8% in VMAT is statistically significant (p = 0·02). However, the maximum values for both techniques are very close, respectively, 38·31 and 37·77% (Table 2).
Low doses to the healthy tissue
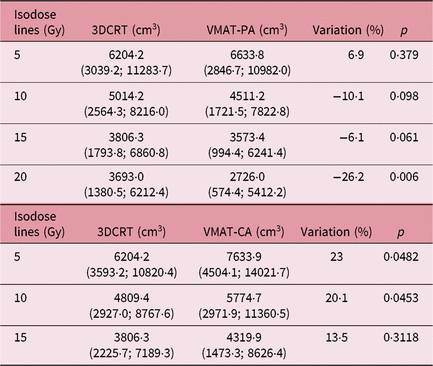
The isodose lines volumes 5, 10, 15 and 20 Gy (V5Gy, V10Gy, V15Gy, V20Gy) for 31 VMAT-PA plans and the corresponding 31 3DCRT plans are summarised in Table 3. This table also gives the results for 19 VMAT-CA plans and the 19 corresponding 3DCRT plans.
Volumes of the low doses to the healthy tissues. Median accompanied by the minimum–maximum extreme volumes for the isodose lines of the 3DCRT versus VMAT-PA techniques (up). The same for the 3DCRT versus VMAT-CA techniques (down)

VMAT-PA versus 3DCRT
The median V5Gy of the VMAT-PA plans is 6633·8 cm3 against 6204·2 cm3 for the 3DCRT (p = 0·379), a decrease of 7% which is not significant.
The median V10Gy of the VMAT-PA plans is 4511·2 cm3 against 5014·2 cm3 for the 3DCRT (p = 0·098). This decrease of 10% is also not significant.
For the median V15Gy, we find the same tendency with a non-significant 6% decrease in VMAT-PA compared to the 3DCRT (3573·4 and 3806·3 cm3, respectively, p = 0·061).
The difference becomes significant for the V20Gy with a 26% decrease in favour of the VMAT-PA compared to the 3DCRT (2726·0 and 3693·0 cm3, respectively, p = 0·006).
VMAT-CA versus 3DCRT
The median V5Gy of the VMAT-CA plans is 7633·9 cm3 against 6204·2 cm3 for the 3DCRT (p = 0·048), a decrease of 23% which is this time significant.
We find a similar result for the V10Gy where the VMAT-CA has a median volume significantly higher than 20% of the 3DCRT (5774·7 and 4809·4 cm3, respectively, p = 0·045).
On the other hand, the 13% increase in the median V15Gy volume in VMAT-CA compared to the 3DCRT is no longer significant (4319·9 and 3806·3 cm3, p = 0·312).
Discussion
This study, using a cohort of patients covering a broad spectrum of possible cases, allows us to show a superiority of the dosimetric results obtained by VMAT to the detriment of the 3DCRT.
The homogeneity and conformity indices at the PTV are in favour of the VMAT with a significant improvement.
The gain is also clear for all OAR, for instance, the median maximum dose decrease for the SC PRV from 45·6 Gy for the 3DCRT to 19·3 Gy for the VMAT. This difference of more than 25 Gy could be beneficial in anticipation of a patient re-irradiation. VMAT also spares the heart, oesophagus and lungs better than the 3DCRT.
The V20 dose for the lungs in particular is of great importance to our radiation oncologists to prevent the risk of radiation pneumonitis.
The VMAT could finally allow a wider recruitment of patients whose tumour volumes are much larger and could not have been supported by a technique in 3DCRT.
The low doses are the reproach that is commonly addressed to VMAT compared to the 3DCRT. This study confirms quantitatively that it is possible to not increase the low doses compared to 3DCRT if the treatment plan is done with two partial arcs. This strategy is simpler to perform than other proposals such as the hybrid-arc mixing VMAT and 3DCRT. Reference Chan, Lee, Hung, Chang, Yeung and Lee11 VMAT-PA is therefore the recommended technique in our centre when planning treatment plans for NSCLCs.
Nevertheless, the dosimetric study and the results obtained were a first step in the VMAT set-up for pulmonary tumours, it is not the only point to validate in the patient’s care process.
The implementation of this technique requires the validation of other points in the patient’s care process. Problems of mobile tumours, Reference Plathow, Ley and Fink18 doses received by a four-dimensional CT, Reference Matsuzaki, Fujii, Kumagai, Tsuruoka and Mori19 the use of image-guided radiation therapy Reference Yegya-Raman, Kim and Deek20 and interplay effects are the main ones. Reference Bortfeld, Jiang and Rietzel21
This study is limited to 36 patients and is based on our own treatment planning system and our own consideration of tumour mobility. The IMRT problem is largely related to tumour movements, which must be analysed by each team before the technique is implemented. The risk would be an increase in local recurrences due to isodoses closer to the target volume. Moreover, a study which evaluates the clinical benefits would strengthen the contribution of VMAT for patients treated for NSCLC.
Conclusion
The dosimetric comparison achieved in this study allows us to conclude that VMAT is clearly superior to 3DCRT. The use of partial arcs also keeps the order of magnitude of the low doses at the same level as the 3DCRT.
The management of NSCLC by VMAT in our centre has evolved from 2% in the first trimester of 2017 to 92% in the last trimester. To date, all of our patients treated for NSCLC benefit from this technique.
Acknowledgements
None.
Financial support
The authors have no funding to report.
Authorship
The authors have no support to report.
Conflicts of interest
None.