1. Introduction
Policies towards the labeling of genetically modified (GM) foods have varied between countries. The great divide has been between the policies in the European Union (EU) which has favored mandatory labeling and those of the United States (US) which has chosen not to impose such requirements. Developing countries have also been confronted with this issue. Whereas Brazil and China have adopted mandatory labeling laws, the Philippines and South Africa have pursued approaches based on voluntary labeling. In India, a proposal for the mandatory labeling of all GM foods is being actively considered by the government.Footnote 1
The EU has favored mandatory labeling of GM foods as a policy that responds to the consumer's right to know. The label simply identifies the food and does not carry any safety warnings.Footnote 2 It is believed that consumers have preferences over the process by which food is produced and that such informed choice is promoted by mandatory labeling. The US position, on the other hand, is based on the principle of ‘substantial equivalence’. If a GM food demonstrates the same nutritional characteristics and composition as its conventional counterpart, then it is deemed to be just as safe and therefore not subject to mandatory labeling. Only those novel foods that are significantly different from their conventional counterparts are seen to be deserving of mandatory labeling. Such a product-based regulation assumes that consumers have preferences only over products and not processes.
From this perspective, a mandatory label for a substantially equivalent GM food may mislead a consumer into believing that the food is unsafe (Runge and Jackson, Reference Runge and Jackson2000), even when the label is simply a summary of whether or not the food was produced using GM technology. The US Health Secretary is quoted as saying, ‘Mandatory labeling will only frighten consumers. Labeling implies that biotechnology products are unsafe’ (Associated Press, 2002). Such an argument implies that labels, even when neutrally worded, are signals and therefore change consumer behavior. Lusk and Rozan (Reference Lusk and Rozan2008) find some support for such effects. From a survey of US households, they conclude that individuals who believe the government enforces a mandatory labeling policy are less likely to be willing to purchase and consume GM food than individuals who believe that no such policy is in place. Thus, EU and US positions differ on the mechanisms through which mandatory labeling is likely to affect the demand for GM foods. The EU posits an informational role for labels. Previously uninformed consumers see the label and adjust demands according to their preferences about GM foods. The argument made by US officials opposing mandatory labeling posits a signaling role for labels. Consumers read the label as a signal that the product may have unspecified health consequences and accordingly place demands. In this paper, we provide an experimental framework for examining these roles of information and signaling. In particular, the experiment design allows the researcher to estimate a lower bound of the informational impact of labels on GM food aversion. To the best of our knowledge, such an analysis has not been done earlier.
This paper is a contribution to the literature on consumer preferences and perceptions regarding GM foods. Like much of the literature, we too conduct experiments where subjects bid for foods with money. In a typical experimental study, valuations are elicited for a GM and a non-GM food. As it is not possible by visual inspection to ascertain whether a product is GM, the foods used in the study are appropriately labeled. Huffman et al. (Reference Huffman, Shogren, Rousu and Tegene2003, Reference Huffman, Shogren, Rousu and Tegene2004), Lusk et al. (Reference Lusk, Traill, House, Valli, Jaeger, Moore and Morrow2006), Noussair et al. (Reference Noussair, Robin and Ruffieux2002, Reference Noussair, Robin and Ruffieux2004), and Dannenberg et al. (Reference Dannenberg, Scatasta and Sturm2011) are some of the studies that have utilized such experimental data to analyze consumer demand for GM food. European and US consumers are the subject of these studies.
Our paper is, however, a departure from the literature in an important way. It sets up a framework for consumer valuation that allows play to the contrasting views of labels implicit in the European and US positions. This leads to an experiment design that allows the researcher to estimate a lower bound to the informational impact of labels. While prior studies have investigated the effect of different kinds of labels and information on consumer valuation of GM foods, these findings have not been related to the dual pathways of information and signaling by which labels matter. The focus of the literature has been on whether labels (and associated information) matter. To this end, papers typically report findings about the extent of aversion to GM foods, i.e., the discount on GM foods relative to valuations on equivalent non-GM foods. This paper also reports the aversion to GM foods; in addition, however, it also shows the minimum (or maximum) proportion of this aversion that can be ascribed to the informational impact (or the signaling impact). In this sense, the paper advances the literature by widening the question of research from whether labels matter to how they matter.
In addition, we use subjects from New Delhi, India, outside the usual developed country context. Consumers in developed countries are widely exposed to the debates on GM foods but media attention on GM foods has been limited in India. The market dynamics in a developing country could be very different from that of a developed country and therefore may require a different set of policies. We are not aware of prior published studies that investigate consumer preferences towards GM foods in a developing country context using experimental methods.
The next section sets out a theoretical framework. The application of this framework to devise an experiment is described in section 3. This is followed by a review of the literature. The experiment and the subject pool are described in section 5. Findings are reported in sections 6 and 7.
2. The informational and signaling impact of labels
Consider a framework where GM and non-GM products are vertically differentiated (based on the unit demand model of Mussa and Rosen (Reference Mussa and Rosen1978)) and where consumers have a higher willingness to pay (WTP) for the non-GM attribute.Footnote 3 An individual consumer buys at most one unit of the good, which could be GM with probability π, where π∈[0, 1].
For the purpose of exposition, consider first a model where a label serves to provide only information. We posit that either quality (GM or non-GM) provides the same basic utility, v, but consuming the GM variant also leads to a disutility that differs across consumers. The disutility is non-decreasing in the probability of the product being GM.Footnote 4 Specifically, utility is given by
 $$U = v - g\lpar \pi\semicolon \; \theta\rpar \comma$$
where g is a reduced-form representation of the cognitive processes by which consumers map probabilistic information to utility outcomes. It is a function of π, i.e., the consumer's perception of the probability that a product is GM, and θ. Parameter θ in the disutility function varies across consumers. It allows consumers to differ in their aversion towards the GM attribute even for products with the same probability of being GM.
The function g is non-decreasing in π for GM-averse consumers.Footnote 5 Further assume that at the supports,
 $$g\lpar 0\semicolon \; \theta\rpar = 0\comma \; \quad g\lpar 1\semicolon \; \theta\rpar = \theta \overline{G}\comma \; \quad \hbox{where}\ \overline{G} \gt 0.$$
In other words, the maximum disutility (for a fixed θ) occurs at π=1 and the least disutility occurs at π=0. Thus effectively ν is the utility derived from one unit of the non-GM variant, i.e.,  $\nu = U\lpar non\, GM\rpar$, and
 $\theta \overline{G} = U\lpar non\, GM\rpar - U\lpar GM\rpar$.
The utility function in (1) can be related to both the expected utility and the Prospect Theory formulations (Kahneman and Tversky, Reference Kahneman and Tversky1979). Prospect theory modifies standard expected utility theory by replacing objective probability weights with so-called ‘decision weights’. Thus, a Prospect theory utility would be given by
 $$\eqalign{U^{P} & = U\lpar non\, GM\rpar - w\lpar \pi\rpar \lpar U\lpar non\, GM\rpar - U\lpar GM\rpar \rpar \cr & = \nu - w\lpar \pi\rpar \theta \overline{G}}$$
where w(π) is the subjective weight assigned to the probability π. Notice that for w(π)=π, the above formulation collapses to the expected utility theory. Hence, expected utility theory and prospect theory imply particular forms of the disutility component of (1).
If consumers behave according to expected utility, their disutility from GM foods is linearly decreasing in π. In Prospect theory, the shape of the weight function w(π) determines how disutility varies with π. Kahneman and Tversky point to a ‘certainty effect’ that they deduce from their experiments. ‘Certainty effect is a phenomenon where people underweight outcomes that are merely probable in comparison with outcomes that are obtained with certainty.’ This would imply that w(π) is larger at values of π close to 1 compared to low values of π. However, there are no predictions about this function for all values of π.
Suppose R 0 is the reservation level of utility that a consumer gets when the good is not purchased. Then the maximum that a consumer is willing to pay for a product that is genetically modified with probability π is W π that satisfies
 $$W_\pi = v-g\lpar \pi\semicolon \; \theta\rpar - R_0.$$
At the supports of π, the maximum WTP becomes  $W_{0} = \nu - g\lpar 0\comma \; \theta\rpar - R_{0}$ and
 $W_{1} = \nu - g\lpar 1\comma \; \theta\rpar - R_{0}$. The difference is the measure of aversion to GM foods, namely
 $$W_{0} - W_{1} = g\lpar 1\comma \; \theta\rpar - g\lpar 0\comma \; \theta\rpar = \theta \bar{G}.$$
Equation (4) is the aversion to GM foods that arises from the informational impact of labeling. To incorporate the signaling impacts, we assume that the intrinsic utility v is sensitive to signals or cues. In particular, at the supports of π, assume the utilities are
 $$U_{0} = v_{0} - g\lpar 0\semicolon \; \theta\rpar$$
and
 $$U_1 = v_1 - g\lpar 1\semicolon \; \theta\rpar$$
where v 0 > v 1. This captures the idea that labels are signals to consumers to shift down their valuation of GM foods. Equations (5) and (6) imply that the aversion to GM foods can be written as
 $$W_{0} - W_{1} = \lpar v_{0} - v_{1}\rpar + \lpar g\lpar 1\comma \; \theta\rpar - g\lpar 0\comma \; \theta\rpar \rpar .$$
Equation (7) says that the aversion to GM foods now comprises two terms: a signaling impact of a label (the first term) and an informational impact of a label (the second term).
3. Estimating the informational impact: the idea of the experiment
Measuring aversion to GM foods requires two data points: consumer valuations for a non-GM food and consumer valuations for a GM food that is otherwise identical. The idea of our experiment is to insert an intermediate stage and obtain three data points. The intermediate stage consists of valuations for a food that is perceived as genetically modified with some probability (in the interior of the unit interval).
The experiment in this paper (described in detail in a later section) consists of three rounds of bidding for two products (cookies). In the first round, price bids are elicited on the basis of blind tasting. In the second round, subjects are invited to read a one page note describing GM foods and their status in regulation. Subjects are also asked to speculate on the probability that the products are genetically modified. Thus, after planting some doubt that either one or both products might be transgenic, subjects are asked to make price bids. The third round price bids happen when one of the products is labeled as, and thus revealed to be, genetically modified.
The first round serves to normalize the subjective quality difference between the two products. The difference in third round price bids between the unlabeled non-GM product and the labeled GM product (normalized by the first round quality difference) is the expressed aversion to GM foods. The difference between the price bids of the two products in the second round (normalized once again) is the aversion to GM foods that comes from the diffuse and generalized information distributed in the second round. This information is crystallized in terms of subjective probabilities that one or both products are genetically modified. The extent of aversion in the second round relative to the third round is the lower bound to the informational impact of labels on GM aversion.
To see this clearly, let w ij denote the WTP for product j (j = A, B) in round i (i = 1, 2, 3). Following (3), the valuations for the products A and B in round 1 are given by
 $$w_{1A} = v_{NA} - g\lpar \pi_{1A}\semicolon \; \theta\rpar - R_{0}$$
 $$w_{1B} = v_{NB} - g\lpar \pi_{1B}\semicolon \; \theta\rpar - R_{0}$$
where v Nj is the intrinsic valuation of the product j (j = A, B) in the absence of labeling. The difference in the first round valuations between the two products is therefore
 $$w_{1A} - w_{1B} = v_{NA} - v_{NB}$$
where we have assumed that in the blind tasting round, the probability perceptions are equal across the two products. The difference in valuations stems entirely from difference in intrinsic utility which presumably depends on taste, shape, appearance and other characteristics relevant to consumers.
Similarly, the WTP in round 2 is given by
 $$w_{2A} = v_{NA} - g\lpar \pi_{2A}\semicolon \; \theta\rpar - R_{0}$$
 $$w_{2B} = v_{NB} - g\lpar \pi_{2B}\semicolon \; \theta\rpar - R_{0}\comma$$
where π2j is the probability perception that product j (j = A, B) is genetically modified. Recall that in round 2, subjects read an information sheet about GM foods and were asked to report their probability perceptions. The material basis for these perceptions is irrelevant to the experiment; as long as consumers form these probabilities, it will matter to their product valuations.
The difference in the WTP between these two products in the second round becomes
 $$w_{2A} - w_{2B} = \lpar v_{NA} - v_{NB}\rpar + g\lpar \pi_{2B}\comma \; \theta\rpar - g\lpar \pi_{2A}\comma \; \theta\rpar$$
In the third round, product B is revealed to be genetically modified. Hence the probabilities of the two products would change accordingly. The label also modifies the intrinsic utility of the two products because of the signaling effect. Taking both these effects into account, the product valuations become
 $$w_{3A} = v_{LA} - g\lpar 0\semicolon \; \theta\rpar - R_{0}$$
 $$w_{3B} = v_{LB} - g\lpar 1\semicolon \; \theta\rpar - R_{0}\comma$$
where v Lj is the intrinsic valuation of the product j (j = A, B) in the presence of labeling. Hence the difference between the valuations of the two products becomes
 $$w_{3A} - w_{3B} = \lpar v_{LA}-v_{LB}\rpar + g\lpar 1\comma \; \theta\rpar - g\lpar 0\comma \; \theta\rpar .$$
Equation (16) is the premium of the non-GM food over the GM-labeled food. To compute the aversion to GM foods, (16) needs to be adjusted for the intrinsic difference in qualities (such as taste, color and appearance) between the two products as revealed in the first round. Subtracting (10) from (16) gives us the magnitude of aversion to GM foods, denoted as M, i.e.,
 $$M = [ \lpar v_{LA}-v_{NA}\rpar - \lpar v_{LB}-v_{NB}\rpar \rsqb + [ g\lpar 1\comma \; \theta\rpar - g\lpar 0\comma \; \theta\rpar \rsqb .$$
The effect of labeling on valuations can thus be computed by a routine difference-in-difference analysis between round three price bids and blind tasting price bids in round one – i.e.,  $M \equiv \lpar w_{3A} - w_{3B}\rpar - \lpar w_{1A} -w_{1B}\rpar $. M is the quantitative measure of aversion to GM foods and it represents the premium of non-GM food over the GM product, controlling for all differences in intrinsic quality (in the unlabeled state). A subject is defined to be GM averse if M > 0. A subject is GM indifferent if M = 0 and is GM loving if M < 0.
In (17), the first term on the right-hand side is the aversion to GM foods due to the signaling effect. The label alters the intrinsic utility and this is captured by the first term in (17). The label also certifies to the consumer which of the products is genetically modified and this information alters valuations as well. This is captured by the second term in (17).
For the sample of GM-averse consumers (N), the average aversion to GM foods can be computed as
 $${\sum_\theta M \over N}.$$
Similarly, the sample average of the informational component of (17) is
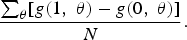 $${\sum_\theta [ g\lpar 1\comma \; \theta\rpar - g\lpar 0\comma \; \theta\rpar \rsqb \over N}.$$
From (10) and (13), it can be seen that what can at best be estimated is
 $$V\equiv \lpar w_{2A}-w_{2B}\rpar - \lpar w_{1A}-w_{1B}\rpar = g\lpar \pi_{2B}\comma \; \theta\rpar - g\lpar \pi_{2A}\comma \; \theta\rpar .$$
Equation (18) can be positive or negative depending on the relative values of π2A and π2B. However, as the disutility g(.) is increasing in π,  $\vert g\lpar \pi_{2B}\comma \; \theta\rpar - g\lpar \pi_{2A}\comma \; \theta\rpar \vert \le g\lpar 1\comma \; \theta\rpar - g\lpar 0\comma \; \theta\rpar $. Hence
 $${\sum_\theta \vert g\lpar \pi_{2B}\comma \; \theta\rpar - g\lpar \pi_{2A}\comma \; \theta\rpar \vert \over N} = {\sum_\theta \vert V\vert \over N} \le {\sum_\theta [ g\lpar 1\comma \; \theta\rpar - g\lpar 0\comma \; \theta\rpar \rsqb \over N}.$$
Thus a lower bound to the sample average of the informational component of the aversion to GM foods is
 $${\sum_\theta \vert V\vert \over N} = \sum \vert [ \lpar w_{2A}-w_{2B}\rpar -\lpar w_{1A}-w_{1B}\rpar \rsqb \vert/N.$$
Finally, the ratio
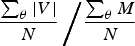 $${\sum_\theta \vert V \vert \over N}\left/{\sum_\theta M \over N}\right.$$
is the minimum proportion of aversion to GM foods that is due to information.
4. Survey of literature
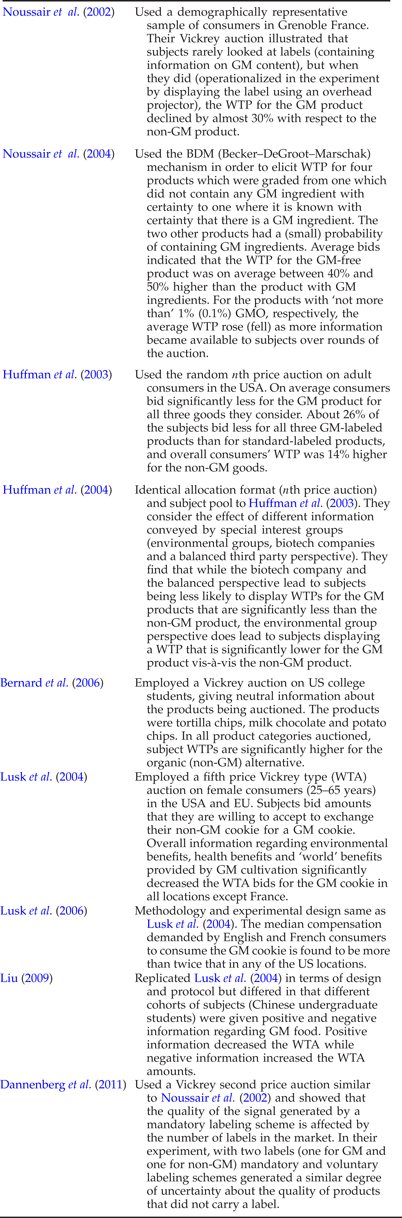
There is now a growing literature that uses experimental methods to assess the demand for GM foods. Some of the principal studies and their results are summarized in table 1. The principal issue has been to measure the extent of aversion to GM foods as revealed by the auctions of GM and non-GM foods. In addition, a range of subsidiary questions have been explored such as the effect of different kinds of information about GM foods in general and about the GM product that is auctioned (e.g., the percentage of GM ingredients).
Other studies that experimentally study the valuation of GM foods

The cognitive process that is triggered by labels has not, however, received attention in experimental studies of consumer valuation of GM foods. Some of the studies, however, reveal some anomalies that point to the necessity of a deeper investigation of the cognitive processes.
Huffman et al. (Reference Huffman, Shogren, Rousu and Tegene2003, Reference Huffman, Shogren, Rousu and Tegene2004) analyze the effects of labels when combined with different kinds of information (pro-biotech, pro-environment, and so on). Subjects bid for the GM-labeled product in one round and a ‘plain’ labeled product in another round. The plain label identified only the contents of the food package while the GM label also stated that the product was made using genetic modification. One set of participants were randomly assigned to first bid for the foods with plain labels and then for the foods with GM labels in the subsequent round. For other participants, the sequence was reversed. The significant finding is that the discount on GM-labeled foods is less when consumers first bid on GM-labeled foods compared to the reverse sequence. Clearly, this result may have something to do with how consumers process information from labels. Using experimental auctions in Germany, Dannenberg et al. (Reference Dannenberg, Scatasta and Sturm2011) investigate the impact of different labeling schemes on the ability of consumers to express their preferences. The authors show that consumer preferences are context dependent and find that the quality of the signal generated by a mandatory labeling scheme is affected by the number of labels in the market. Consumers value the un-labeled product differently when a GM-free labeled product enters the market under a mandatory labeling scheme.
Noussair et al. (Reference Noussair, Robin and Ruffieux2004) conduct an experiment where they auction four types of biscuits referred to as S, L, C and N during the sessions. The first round consists of blind tasting followed by auctions. In the second round, the experimenters reveal the product type for S (‘S contains GMOs’) and N (‘N is GMO free’). This is followed by an auction as well. No announcement is made for L and C. Yet they report (table 2 in the paper) a small decrease in average bids for these two products from round one to round two. In round three, labels for L (‘No ingredient in L contains more than 1 per cent GMOs’) and C (‘No ingredient in C contains more than 0.1 per cent GMOs’) are revealed. The auctions in this round lead to a sharp fall in the average bid for L and a modest rise in the average bid for C. The decline in average bids in round two could have happened because it is probable that the labels for S and N change the subject's perceptions of L and C as well. Therefore, this experiment also suggests that consumers may process probabilistic information in different ways.
Sequence of events in the experiment session
Cognitive processes have been acknowledged in the literature on consumer research and marketing. Referring to this literature, Cryer and Ross (Reference Cryer and Ross1997) state that
… recent research suggests that many consumers do not have well-articulated preferences; consequently their choices and preferences are often influenced by the information available in the environment … Different information formats seem to facilitate the use of different strategies and heuristics, which in turn may lead to differences in expressed preference and choice … That preferences are often constructed during the choice process, rather than simply retrieved from memory, suggests that the information available at the time of choice has a significant impact on the decision outcome. (Cryer and Ross, Reference Cryer and Ross1997)
It is well known to survey researchers that consumer response is affected materially by how questions are posed and how information is presented. There is little reason to believe that labels are exempt from such framing effects. For instance, Grankvist et al. (Reference Grankvist, Dahlstrand and Biel2004) compare ‘positive’ and ‘negative’ eco-labels. Positive labels advertise the environmental benefit of the product while negative labels indicate the adverse outcomes to the environment. Their experiment shows that the label type did not matter either to consumers with no interest in environmental affairs or to those with strong interest in environmental protection. However, preferences of individuals with an intermediate interest in environment were more affected by a negative than a positive label. In another application of eco-labeling, Teisl et al. (Reference Teisl, Rubin and Noblet2008) model the process by which preferences are formed. They show that the impact of labels depends on a number of other factors including prior perceptions, cognitive abilities, the credibility of information and personal characteristics.
The economics literature is now beginning to acknowledge the cognitive process by which consumers absorb information. For instance, it has been suggested that people have a limited capacity to process signals and only signals that are sufficiently intense are perceived. Consumers dedicate their attention capacity to the ‘strongest’ signals, i.e., the signal must be strong enough to have an impact (Falkinger, Reference Falkinger2008). Kooreman (Reference Kooreman2000) analyzed the effects of the Dutch child benefit system on household expenditures and found that child benefit increases expenditure on child goods more than other income sources. He proposes that parents regard the child benefits as a normative benchmark and therefore government policy changes parents’ preferences towards children's goods. He reports this as the labeling effect of a child benefit system.
We would interpret Kooreman's explanation as a signaling effect of a label. As mentioned in the introduction, US government officials have opposed mandatory labeling of GM foods because they fear a signaling impact of the label as a result of which consumer preferences turn away from GM foods.
5. Subject pool and experiment design
The experiment is designed to measure changes in WTP in response to new information about GMO content. The protocol we use is similar in spirit to several other experimental protocols in the literature that use Vickrey (Reference Vickrey1961) auction-type techniques like Noussair et al. (Reference Noussair, Robin and Ruffieux2002, Reference Noussair, Robin and Ruffieux2004) and Lusk et al. (Reference Lusk, House, Valli, Jaeger, Moore, Morrow and Trail2004, Reference Lusk, Traill, House, Valli, Jaeger, Moore and Morrow2006). In fact our experiment is modeled on the Noussair et al. (Reference Noussair, Robin and Ruffieux2004) design to elicit WTP using the Becker–DeGroot–Marschak (BDM) mechanism (Becker et al., Reference Becker, DeGroot and Marschak1964).
We ran three separate experimental sessions. Two of the sessions used bachelor's degree students in Engineering (from the Indian Institute of Technology [IIT] in New Delhi). The other session consisted of university teachers from all parts of India (participants at a training course at the Jawaharlal Nehru University [JNU], also in New Delhi). These sessions were preceded by a pilot with another group of students where the experiment protocol was tested. Data from this pilot is not used in the study.
Of the total pool of 114 subjects, 64 are students and 50 are older university teachers. As a result, about 58 per cent of the subject pool is below the age of 25. Most of the college teachers are in the early stages of their career – only about 9 per cent of the subject pool is 36 or older. About 39 per cent of the subject pool is female. In terms of parental background, most of the subjects come from families with high levels of educational attainment. Nearly 76 per cent of the subjects have fathers who have studied beyond high school. The corresponding figure for mother's education is 52 per cent. About 69 per cent of the subjects report family incomes in the range of 100,000–500,000 Rupees, which spans the range of what is considered the middle class in India. These incomes are well above median incomes in India.
Our study sample represents urban consumers with higher than average family incomes and educational attainment. This group is worthy of study because (a) their attitudes and lifestyles are aspired to by other socio-economic groups and more importantly (b) they are the primary consumers of packaged foods that would be subject to mandatory labeling laws.
The experiments were conducted in large classrooms with the subjects seated away from each other.Footnote 6 They were trained in the bidding protocol using a quiz and were not allowed to communicate during the session. In our BDM auctions the subjects had an endowment of 200 units of lab currency (deemed Francs, which convert to Indian Rupees at the rate of 4 Francs to 1 Rupee). In each round of the four rounds of auctions, they gave in writing the price that they would be willing to pay for a unit of both the products (the GM and the non-GM). After all four rounds were complete, one round was randomly picked and a valuation for each of the two products was picked from the uniform distribution [1, 100]. If a participant's valuation was above this, he or she would purchase a unit at the drawn price; otherwise, he or she would keep her endowment to take home in Rupees.
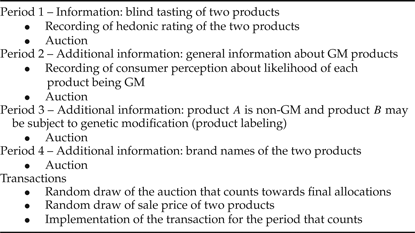
In the BDM auction, bidders have a dominant strategy in bidding an amount equal to their true valuations for the good. In principle this allows WTP be directly measured, rather than inferred. For a discussion regarding the use of the BDM mechanism, see Noussair et al. (Reference Noussair, Robin and Ruffieux2004). Further, although we deem it an ‘auction’, there is no strategic (in the standard game theoretic sense) incentive as in a usual sealed bid auction, as every participant whose valuation lies above the drawn price wins a unit. Also note that when bidding for the products we do not make the bids public information at any time, so that privacy of the valuations is safeguarded and subjects cannot use others’ bids to update their own valuations. The timeline for the procedures is given in table 2. Note that this sequence of auctions is modeled on Noussair et al. (Reference Noussair, Robin and Ruffieux2004) with one difference. In our protocol, probabilistic information is given (in the form of general ‘balanced’ information regarding GM products) before any product-specific information (in our case a GM label) is provided to the subjects.Footnote 7 Whereas Noussair et al. (Reference Noussair, Robin and Ruffieux2004) go on from their blind tasting auction directly to providing information regarding the products being auctioned, we give them a handout that provides information on GM products and conduct a BDM auction before we provide product label information. This allows us to tease out the informational impact of labels from its signaling effect.
We auctioned two products which we called A and B during the session. The products were chocolate chip cookies that are available in stores in Delhi. The products were close substitutes, very similar in taste and appearance. The experiment consisted of four rounds of bidding, as outlined in table 2. Once subjects arrived, they were asked to complete a survey that elicited basic demographic information and had questions about their attitudes towards (so-called) healthy habits. After completing the survey the experiment began. At the beginning of the experiment, subjects received a sample of both products without its packaging or labeling. Before bidding in the first period, subjects were required to taste each product. Then they marked down how much they liked the product on a scale where ‘I like it very much’ and ‘I don't like it at all’ were at the extremes of the rating scale. Then the first period auction took place. The two products were auctioned simultaneously. Each of the following periods consisted of the revelation of some information (general or product specific), followed by a simultaneous auction for both products. The sale price was not drawn for any period until the end of period four and no information was given to participants about other players’ bids.
At the beginning of the second period, we distributed a handout containing information about GMOs. The information was an unbiased characterization so as not to affect consumer preferences towards GMO. The information handout is shown in Appendix I, available in an online appendix at http://journals.cambridge.org/EDE.
At the beginning of the third period, we revealed the information regarding the GM status of the product. The products were still enclosed in our packaging (and not the manufacturer's packaging) and they had labels designed by us. On both products, the label read ‘Chocolate Chip Cookies’. However, the label of product B had an additional statement which read, ‘This product may have been subject to genetic modification’. The label matched the proposed stipulation regarding GM labeling in India. Thus we revealed to the participants that product A was GM free and product B could be subject to genetic modification. Finally, in the last period, we revealed the brands of two products in the original packaging. The price bids received in this round play no role in our analysis. We included this round in the experiment to assure the subjects that the products were genuine.
6. Taste rankings, information and subjective probabilities
In the blind tasting, subjects are asked to rank each of the products on a taste scale from one to seven (the higher the number, the greater the liking) with increments of 0.5. Therefore, a choice is made from 14 possible values. Figure 1 plots the empirical cumulative density function of rankings for both these products. If one ignores the crossing of the distributions at low taste levels, rankings for product A (which in later periods is revealed to be the non-GM product) dominate that of product B (revealed later to be the GM product) by first-order stochastic dominance. The sample mean of the taste rankings of product A is 4.96 and that of product B is 4.44. The Spearman's rank correlation between the two taste rankings is −0.1664 and the null that the rankings are independent is not rejected at the 8 per cent level of significance.
Cumulative density function of taste rankings tastea is the sample cumulative density function of the taste rankings of product A (the non-GM cookie), while tasteb is the sample cumulative density function of the taste rankings of product B.
In period two, subjects were asked to evaluate the likelihood of either product being GM on a scale from one to five. Figure 2 plots the empirical cumulative density of this evaluation. As can be seen, the proportion of consumers who regard product A (the non-GM product) as GM is higher than the similar proportion for product B at all likelihood levels from one to five. Thus, the sample mean of the likelihood that product B is GM is higher than that of product A (2.96 for B as against 2.63 for A). For ease of interpretation, these perceptions are transformed from the likelihood scale of one to five to probabilities in the unit interval [0, 1].
Cumulative density function of GM likelihood rankings gmproba is the sample cumulative density function of the respondent's assessment of the likelihood that product A is genetically modified. gmprobb is the sample density function of the respondent's assessment of the likelihood that product B is genetically modified.
For most of the subjects, the probabilities are strictly in the interior. Only a total of nine subjects report unit probabilities for either of the products.Footnote 8 In addition, only 20 subjects report prior probabilities of less than or equal to 0.25 on both products. Therefore, for the bulk of the subjects, the probabilistic perception about the products is in mid-range.
The sample means for both products indicate that the average probability that either product is GM is close to 0.5. Out of the 113 subjects who report both these subjective probabilities, 88 of them have a probability of at least 0.5 on either or both products. Thus, the background information on GM foods provided in period 2 leads subjects to form high subjective probabilities for at least one of the products. With such high subjective probabilities, it is expected that it will affect the price bids of those who are GM averse. In particular, if the sample is characterized by aversion to GM foods, then higher subjective probability should lead to lower price bids. Notice that the discount in food values has to be attributed entirely to information.
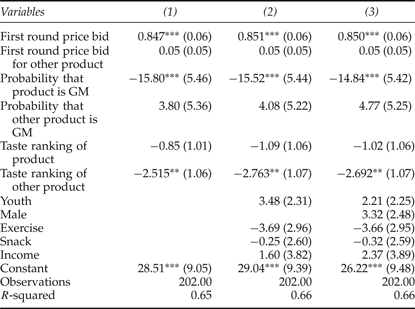
Table 3 reports the regression results. In column 1, the second period bid price of product i (i = A, B) is regressed against its first period bid price, the first period bid price of the other product, the subjective probability that product i is GM, the subjective probability that the other product is GM, product i’s taste ranking revealed from the blind tasting round and the taste ranking of the other product.
The determinants of second round bids
Notes: The figures below the coefficients denote robust standard errors.
***, **, * denote significance at the 1%, 5% and 10% levels, respectively.
The variables youth, male, exercise, snack, and income are binary variables that take value 1 when the subject is 25 years or less in age, is a male, exercises more than twice a week, snacks processed foods more than twice a week, and has annual family income in excess of Rs. 500,000, respectively.
As might be expected, the second period bids are highly (and positively) correlated with the first period bids of the same product. Furthermore, the GM probability perception of a product drives its valuation down. The first column results suggest that other things held constant, an individual with a probability perception of 0.5 has a valuation lower by eight lab currency units than an individual with a probability perception close to zero. Once again, it has to be stressed that the lower valuation of the GM food here is to be entirely attributed to information.
Columns 2 and 3 check the robustness of this result to the inclusion of variables relating to personal characteristics. In column 2, the second period bid price of product i (i = A, B) is regressed against the variables related to demographics (age, income) and attitudes towards healthy habits (frequency of exercising and snacking) in addition to the variables in column 1. Column 3 adds a gender dummy to the regression. Although many of these variables affect the dependent variable in the expected direction, none of them is significant. The second period valuations continue to be significantly and negatively impacted by the perception that the product is GM.
But do probability perceptions matter to everybody in the sample? Out of the 114 subjects, 101 report price bids in both periods. And out of these 101 subjects, 36 (i.e., more than one-third) did not alter their price bids (for both products) from period one to period two. We call these ‘information inert’ subjects because their price bids are invariant to the elicitation of subjective probabilities and to the background information on GM foods that was distributed in the second period. Therefore, the negative relation between second period bids and the subjective probability in the regression of table 3 comes from the rest of the sample.
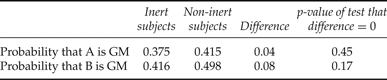
Individuals could be information inert for two reasons. The first possibility is that the information does not change bids because the subjective probabilities remain low. The second possibility is that the disutility component of the utility function in (1) is flat in the relevant range of probabilities. Table 4 reports the averages of the subjective probabilities of information inert and non-information inert subjects. These figures show that the subjective probabilities of the inert subjects are indeed lower than those of non-inert subjects. However, in no case is the difference statistically significant at the 5 per cent level. Therefore, the first reason is unlikely to be the reason for information inertness. Rather, it seems that the disutility component (the g function) is invariant to the subjective probability. Thus, while the aggregate probabilistic perceptions of foods being GM do negatively affect their valuation, this is not true for a fraction of the sample that is information inert.
Difference in average subjective probabilities between inert and non-inert subjects
7. The informational component of aversion to GM foods
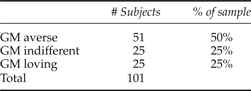
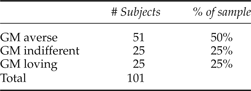
As explained in section 3, the difference in valuation because of the GM label is  $M\equiv \lpar w_{3A} - w_{3B}\rpar - \lpar w_{1A} - w_{1B}\rpar $. This is the quantitative measure of GM aversion and it represents the premium of non-GM food over the GM product. Recall that a subject is defined as GM averse if M > 0, GM indifferent if M = 0, and GM loving if M < 0. Table 5 classifies the sample according to these definitions.Footnote 9 About half of the sample is GM averse and the remainder are equally split between GM-loving and GM-indifferent subjects.
Classification of sample
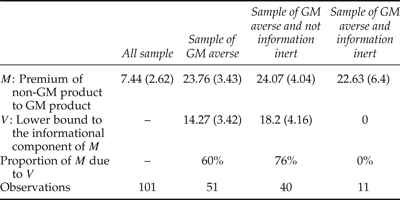
Sample averages of M and V (the lower bound to the informational component of M as defined in (19)) together with their standard errors are presented in table 6. The first column presents the results for the entire sample. Here the measure of GM aversion is 7.44 lab currency units, which is a premium of about 16 per cent on the average bid for the GM product in round three (48 lab currency units). This compares to the 25 per cent premium that Lusk (Reference Lusk, Carter, Moschini and Sheldon2011) found to be the average across 57 studies of consumers in the US, Europe, China, Japan and Taiwan. European consumers typically report even higher WTP premiums for non-GM food.
Aversion to GM product and its informational component: sample means
Note: All values are in lab currency units. The figures in parentheses denote standard errors.
However, the modest aversion on average, in this study, conceals the wide variation among consumers as GM aversion is confined to only about half of the sample. As a result, the average aversion among the GM averse (in column 2) is much higher at 24 lab currency units which represents a premium of 50 per cent over the average bid for the GM product in round three. As our sample was representative of urban, well-educated middle-class subjects, it is likely that aversion would be lower in a more representative sample of the economy.
Table 6 also shows that among the GM averse, 60 per cent of aversion is due to the probabilistic information in round two. As was argued earlier, this represents a lower bound to the informational component of GM food aversion. It can therefore be concluded that the informational role of labels dominates that of the signaling impact in these experiments.
There are important differences, however, within the group of GM averse as well. The earlier section noted the presence of ‘information-inert’ consumers whose valuations do not respond to probabilistic information. The last two sets of columns of table 6 present the magnitudes of GM aversion for (a) the subset of GM-averse consumers who are not information inert, and (b) the subset of GM-averse consumers who are information inert. As can be seen, the sub-samples reveal a similar aversion to GM foods. However, these two groups are very different with respect to the informational component V. For those who are GM averse and not information inert, the lower bound is as high as 76 per cent. Information is therefore the dominant driver of GM aversion for such subjects. On the other hand, for those who are information inert, the aversion to GM foods is revealed only in round three when the foods are labeled. As it is impossible to say how much of this is because of the signaling or the information content of the label, this experiment cannot usefully estimate the informational impact for this group of consumers.Footnote 10 It is probable that the signaling impact is strong for the information-inert consumers but this cannot be deduced from this experiment.
8. Conclusions
This paper aims at studying consumer attitudes towards GM foods in the context of a developing country, India. The data set is obtained by assigning labeling and information treatments to subjects who participated in laboratory auctions for food items that might be genetically modified. Previous studies of consumer preferences towards GM foods have focused on the impact of labels on consumer behavior. On that basis, they have drawn conclusions about the extent of aversion to GM foods. In this paper, our interest is also in what happens prior to the expression of aversion to GM-labeled foods. In particular, the paper investigated the effect of probabilistic information on GM food aversion using experimental methods. On the basis of existing research in consumer psychology and marketing, the paper postulated that different consumers may process probabilistic information differently. The experiment is designed to estimate a lower bound to the informational impact of labels on GM aversion.
We obtain a number of interesting results. First, we find that, on average, consumers are willing to pay a price premium of about 16 per cent for GM-free products. However, GM-averse consumers account only for about 50 per cent of the subjects. Our results are in sharp contrast to those obtained by Noussair et al. (Reference Noussair, Robin and Ruffieux2004), where participants in the experiment were French consumers. Whereas only 23 per cent of participants in their study showed no decrease in their WTP after learning that a product contained GMOs, the corresponding number is 50 per cent in our study. More strikingly, 35 per cent of French subjects were unwilling to purchase products made with GMOs, while in our sample there are only 8 per cent of such subjects. These results suggest that preferences in a developing country could be different from those in a developed country, leading to a different market dynamics.
Second, for the sample of GM-averse consumers, the informational impact of labels dominates the signaling impact. Third, a subset of GM-averse consumers did not react to the probabilistic information at all. It is the revelation of a label that leads them to place a premium on non-GM products. It is possible that the signaling impact is important for these consumers. To demonstrate this, it would be necessary to design an experiment where subjects are shown cues that have no information content but could be interpreted as signals from credible authorities.
Supplementary materials and methods
The supplementary material referred to in this paper can be found online at journals.cambridge.org/EDE/.