Introduction
Migrations have been part of human history from the earliest times. However, international migration has grown in volume and significance since 1945 and most particularly since the mid-1980s. Migration ranks as one of the most important factors in global change.1 (Castles and Miller Reference Castles and Miller2003: 4)
This quote from Castles and Miller's widely used handbook summarizes quite nicely the dominant perspective in migration studies among both social scientists and historians: The most significant expression of migration are people who cross national boundaries, and as such the twentieth century, and especially our own time, has witnessed the apogee of human migrations. This view, however, implicitly reproduces the entrenched conviction among many scholars in the social sciences and the humanities that human behavior, including migration and mobility, changed dramatically with the rise of “modern” society in the nineteenth century. This “mobility transition,” to use a phrase coined in the seminal 1971 paper of Wilbur Zelinsky, assumes that Europeans (and certainly people in other—less developed—continents) were overwhelmingly sedentary until the Industrial Revolution. This idea fits well with the “modernization paradigm,” as advocated by postwar functionalist social scientists and historians, mostly building on Marxian or Weberian concepts of linear human progress (Lucassen and Lucassen Reference Lucassen and Lucassen2009).
Although there are strong indications that the levels of international migration (defined in national statistics as settlement in other countries) at the end of the nineteenth century (1870–1914) measured up to those a century later (1965–2000) (Gozzini Reference Gozzini2006), in the longer run Castles and Miller may be right. We lack good statistics on international migration before the nineteenth century, but it seems reasonable to assume that moves across national borders increased substantially in the nineteenth and twentieth centuries due to the various transport revolutions (from sailing to steamships in the mid-nineteenth century, trains not much later, and—cheap—air traffic in the twentieth century, especially from the 1960s onward). Furthermore, the global rise of human rights regimes, anticolonialism, and antiracism movements, embodied in the ideals of the United Nations and UNESCO (Hazard Reference Hazard2012; Jensen Reference Jensen2016; Mazower Reference Mazower2009), opened the Atlantic to increasing numbers of Asian and African migrants, starting with flows from the colonies to the various metropoles after World War II (Bade et al. Reference Bade, Emmer, Lucassen and Oltmer2011; Hoerder Reference Hoerder2002; Hoerder and Kaur Reference Hoerder and Kaur2013; Lucassen Reference Lucassen, Antunes and Fatah-Black2016a; Ness Reference Ness2013). Until that moment, Africans and Asians were largely excluded, except for the millions of African slaves in the Americas.
With the notable exception of some geographers and demographers, most scholars interested in migration have followed this state definition, using statistics on international migrations that mirror the state's preoccupation with people who cross national borders with the intention to settle. Internal migrants, migrants who move abroad temporarily, such as Italians seasonal workers in Argentina after 1860 (golondrinas) or high- and low-skilled organizational migrants—those whose moves are primarily determined by the organization they join (missionaries, diplomats, corporate specialists, soldiers)—are thereby excluded from the analysis. This is closely linked to the simultaneous emergence of nationalism and its obsession with ethnic (or racial) homogeneity, which has led to a myopic view of migration by European states and their offshoots elsewhere. Nation-states increasingly became primarily interested in migrants from other states who are expected to settle for good and as such become the object of assimilation or integration policies. From a historical perspective, however, states, and more specifically the nation-state, are not the best unit of analysis when it comes to understanding the causes and effects of migrations. Not only does a state perspective easily lead to “methodological nationalism” (Wimmer and Glick Schiller Reference Wimmer and Glick Schiller2003), more importantly it privileges people who cross national boundaries (international migrants) over people whose geographical mobility may be at least as important, but who remain within the confines of the state. Furthermore, the ideology of the nation-state assumes stable and sedentary populations, expressing long-term cultural and ethnic rootedness. From this perspective, migration between nation-states is often perceived as disturbing the normal and the desired status quo, which can be redressed only by fast assimilation. That is why statistics concentrate on it. Concerns about ethnic homogeneity have often given rise to restrictive immigration policies because dominant groups in nation-states expect certain immigrants to be too different to become similar, even in the long run. The exclusion of Asians and other people of color in the North Atlantic (and Oceania) in the nineteenth and much of the twentieth century is a case in point (Gabaccia and Hoerder Reference Gabaccia and Hoerder2011; McKeown Reference McKeown2008).
To sum up, in the wake of the state, most mainstream migration scholars who work on the nineteenth and twentieth centuries have severely limited their definitions of what constitutes a migrant and limited themselves largely to one-way (A to B) settlers, thus ignoring return migrants, temporary migrants, and circular and internal migrants. There are, however, important exceptions to this general picture. First, early modernists, untouched by nation-state ideology and the focus on low-skilled labor migrants, have produced many studies on internal, temporary, and organizational migrants (Bade et al. Reference Bade, Emmer, Lucassen and Oltmer2011; Hoerder Reference Hoerder2002). Moreover, geographers, sociologists, and family historians who are interested in micromobility and who take the household as their point of departure have done groundbreaking work on other forms of migration and mobility.Footnote 1 Their perspective, however, has had a hard time being incorporated into mainstream migration studies.
For various reasons this self-imposed definitional limitation obstructs a better understanding of why people who cross cultural (but not necessarily national) boundaries migrate and what the consequences are for themselves, the people they temporarily join, and the people they might return to. Patrick Manning's work in particular is relevant in this respect because he argues that cross-community migrations are the root cause of social change (see also Castles et al. Reference Castles, Ozkul and Cuba2015; Manning Reference Manning2005, Reference Manning2006). The basic idea is that the prolonged interaction (peaceful, but also contentious, violent, and at times destructive) between people with different cultural backgrounds is bound to produce new ideas, insights, and practices, and thus often leads to social change, in the broadest sense. How this process evolves depends on power relations, status differentials, and the proneness of migrants to adapt versus the specific institutional membership regime of receiving societies.Footnote 2 Manning argues that social changes as a result of cross-cultural migrations (CCMs) between distinct cultural communities can best be measured over the longue durée, starting about 80,000 years ago. In his typology of cross-community migrants, notions of power and multidirectionality are systematically anchored, as he distinguishes not only settlers (the classic “A-to-B-and-then-stay migrant”), but also invaders, sojourners, and itinerants (Manning Reference Manning2005: 8–9).
An important additional advantage of this long-term approach is that it enables structured comparisons in time and space, which have so far been largely lacking due to the absence of an agreed definition of what “migration” entails. Take the example of young men and women from West African villages moving to Europe. They clearly fall within the mainstream migration definition of international (even intercontinental) migrants, but the structural causes of this migration are not so different from the causes of French internal migration in the nineteenth century, when country folk migrated to a nearby (or more distant) city within their state, such as Bretons moving to Paris (de Haan Reference de Haan, Arya and Roy2006; de Haas Reference de Haas2010; Massey Reference Massey1990; Moch Reference Moch2012). Technically the latter were internal migrants, and as such they do not appear on the radar of mainstream migration historians. If we trade the international perspective for that of the household perspective, however, it is clear that both groups cross salient cultural boundaries and that the motives of West African migrants and the functionality of their strategic migration decisions within the household context were, until very recently, similar to those of internal migrants in European countries. The big difference is the obstacles nation-states put in the way of free migration during the twentieth century; these have increased the risks and costs considerably (Cross Reference Cross2013; Triulzi and McKenzie Reference Triulzi and McKenzie2013).
In this article, we will apply the cross-cultural perspective to Eurasia in the past five centuries (1500–2000) and, additionally, we will make comparisons between large territorial units, such as Western Europe, Russia, China, and Japan. This broader and long-term perspective will offer us a very different view on migrations from that provided by the modernization perspective and the myopic state-centered and North Atlantic international migration definition. Second, and closely connected to the first point, we will show why short-term and organizational forms of migration, too, are of crucial importance in understanding social change. First, however, we need a clear and formalized definition, typology, and quantitative method that guarantees we are measuring the same thing.
The Cross-Cultural Migration Rate Method
The cross-cultural migration rate (CCMR) method calculates the likelihood of an individual experiencing at least one CCM during his or her life (with scale levels ranging from a city to an empire or continent), which we express as the proportion of the population in a certain territory. The original formulation concentrates largely on four basic categories that encompass the major cross-cultural movements within a given territory (T) (irrespective of scale), measured in 50-year periods (Lucassen and Lucassen Reference Lucassen and Lucassen2009, Reference Lucassen, Lucassen, Lucassen and Lucassen2014a):
-
(1) To cities (within T, generally from rural areas);
-
(2) Colonization (moving to rural areas within T);
-
(3) Seasonal (within T, generally between peasant and farmer regions); and
-
(4) Temporal Multi-Annual (TMA) (soldiers, sailors, and artisans within T).
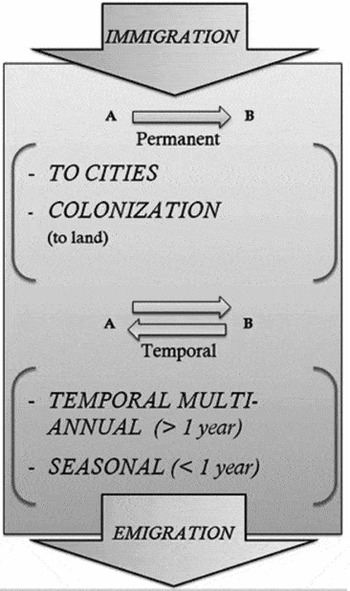
This migration typology differentiates between four forms of migration within a chosen geographical unit of analysis: to cities (1); to the land/rural centers (colonization) (2); seasonal (3); and TMA (soldiers, sailors, and tramping artisans) (4). To calculate total migration rates, we also measure and include people leaving (emigration) (5) or entering (immigration) (6) that same geographical unit and who can subsequently be subdivided into one of the four core types. For a full understanding of the causes and effects of CCM within a given area, immigration and emigration therefore must be “unpacked.” Only then can we know how many of the immigrants or emigrants went to (or came from) cities or rural areas, and moved as soldiers, sailors, or seasonal workers. The relationships between the six categories is visualized in figure 1.
CCMR method for a given territory and period.

In relation to the population size of a given territory in a given period, the total impact of geographical migration may be expressed in the formula (based on Lucassen and Lucassen Reference Lucassen and Lucassen2009).
Formula to calculate CCMRs. Pi (p) denotes the probability of a person living in period p and geographical unit i migrating during their lifetime. Mi perm, Mi mult, and Mi seas denote permanent (to cities and to rural areas), multiannual (labor migration), and seasonal cross-community, often long-distance, movements inside unit I, respectively. Mi imm is the number of immigrants to unit i from outside and Mi emi the number of emigrants from unit i to elsewhere. The notation Σp indicates that these migration numbers are summed over period p. Ni (p) is the average population in geographical unit i in period p. To compensate for overcounting in the migration numbers, the expression needs to be corrected by the second factor, in which Ei (p) denotes the average life expectancy in period p and Lp is the length of the period. Note that in this article we ignore the second term because we estimate Lp = 50 years ≈ Ei (p).

The CCMR method is a very crude one as it measures only the bare minimum level of CCM and therefore does not address explicitly the fact that many people experienced multiple different types of cross-cultural migrants in their lifetime. The advantage, however, is that one can apply it at different scales, from villages and regions to continents. For this article, which focuses on the comparison of Europe, Russia, and similar territorial units in Asia, we have opted for the aggregate macrolevel and applied the CCMR approach to periods of 50 years. Given its wide temporal and geographical scope and the availability of systematic sources, we believe the CCMR method is, for now, the best alternative to the mainstream international approach. In the meantime, it has been successfully applied to Russia (Kessler Reference Kessler, Lucassen and Lucassen2014; Sunderland Reference Sunderland, Lucassen and Lucassen2014), China (McKeown Reference Lucassen and Lucassen2014), and Japan (Lucassen et al. Reference Lucassen, Saito, Shimada, Lucassen and Lucassen2014). The Russian case is of particular interest, as it highlights—among other things—the role of temporary career migrants, the so-called twenty-five thousanders sent around 1930 by the Soviet state to the countryside with the aim of molding the ideal “Homo sovieticus,” bringing educated urbanites into contact with Russian peasants (Siegelbaum and Moch Reference Siegelbaum and Moch2014: 165–67; 2016).
Cross-Cultural Migrations in Europe 1500–2000
So far, we have applied the CCMR method to Europe, Russia, as well as to large parts of Asia, and the method and data (broken down at the level of states) have been published in detail in various research papers and books (Lucassen and Lucassen Reference Lucassen and Lucassen2010; Lucassen and Lucassen Reference Lucassen, Lucassen and Fauri2014b; Lucassen et al. Reference Lucassen, Saito, Shimada, Lucassen and Lucassen2014). This exercise has produced interesting results that contradict several commonsense assumptions about the level and types of migration in European and Asian societies.
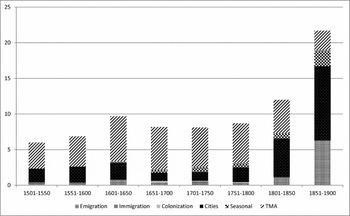
If we take Europe in the period 1500–1900, there is a broadly shared consensus that a mobility transition took place in the nineteenth century as part of the broader “modernization” process, which uprooted the assumed stationary nature and stability of European societies (Osterhammel Reference Osterhammel2014; Zelinsky Reference Zelinsky1971: 234). Since the 1980s, however, historians have questioned the supposedly sedentary and immobile character of Europe, showing that the joint processes of commercialization, state formation (war), and globalization since the late fifteenth century encouraged people to leave their places of birth, permanently or temporarily (Bade et al. Reference Bade, Emmer, Lucassen and Oltmer2011; Moch Reference Moch2003), moving to work as domestics, tramping artisans, and casual workers in cities, as mercenary soldiers in other parts of Europe, as sailors all over the world, but also moving as colonists to remote areas of expanding empires, such as Russia and the Ottoman and Habsburg empires. The CCMR method enables us to capture these migrations and the trends over time, as visualized in figure 3.
CCMRs for Europe (excluding European Russia), 1501–1900.

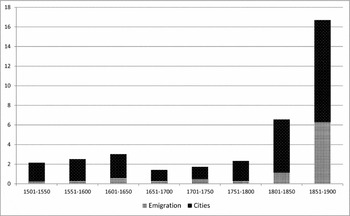
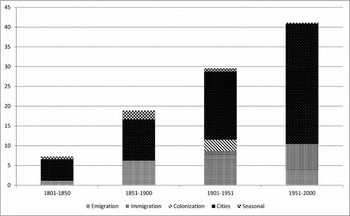
These ratios, which constitute the absolute minimum total mobility at the time, make clear that there was no mobility transition in the nineteenth century that justifies the idea of a dramatic change from an immobile to a mobile society. The level of migration in the first half of the nineteenth century, for example, was barely higher than that two centuries earlier. Nevertheless, there was a substantial increase in the second half of the nineteenth century linked to the transport revolution (cheap steamships and trains) (Feys Reference Feys2013; Keeling Reference Keeling2012), which enabled the migration of (predominantly) European peasants to cities, both in the Americas (emigration) and within Europe (to cities). That Wilbur Zelinsky and others were unaware of the high rate of pre-1840 mobility and interpreted the increase since then as a fundamental transition is explained by their myopic view of migration, which was restricted to people leaving Europe and to the spectacular rural to urban migration, leading indeed to an extraordinary degree of urbanization from the mid-nineteenth century onward. If we measure only the most conspicuous categories—namely “emigration” and “to cities”—we see that between 1800 and 1900 the CCMR increased eightfold (figure 4), instead of only doubling as in figure 3.
Migration rates, limited to urbanization and emigration in Europe (excluding European Russia), 1501–1900.

Zelinsky's focus on emigrants from Europe and on city dwellers was not a fundamental one, and in his social-geographical approach he understood that it was not primarily nationality or distance that matters. Given the dearth of techniques and data that are necessary to map cross-cultural movements within states, however, migration scholars were forced to rely “almost solely on territorial movements as a clumsy surrogate for total mobility” (Zelinsky Reference Zelinsky1971: 224). Zelinsky's definition of migration bears many similarities with ours, but he obviously did not realize how quantitatively substantial temporary and organizational migration was in early modern Europe, especially among soldiers and sailors. Nor did he realize how long this had been going on already. What he could not know at the time he wrote his seminal paper was the ubiquity of seasonal, military, and maritime migration, as well as the normality of temporary and permanent moves to cities, which marked and changed the lives of millions of ordinary Europeans.
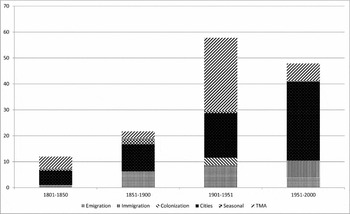
What then about the twentieth century, and more specifically our own time? Does the postwar period, with its second transportation revolution (cheap air travel), and the fading of exclusionary (anti-Asian) migration regimes (McKeown Reference McKeown2008), indeed constitute the apogee of human cross-cultural mobility, as most social scientists claim? When we apply the CCMR method, the twentieth century does indeed stand out, but in an unexpected way.
CCMRs for Europe (excluding European Russia), 1801–2000.

In as far as there was a mobility transition, it is the first half of the twentieth century that qualifies for this epithet and not the more recent period. The record migration seen between 1901 and 1950 marked the culmination and acceleration of three trends: emigration to the Americas (in the years running up to the end of the World War I), continuing urbanization (within and between European states), and, finally, the cross-cultural experience of tens of millions of soldiers, both Europeans fighting and stationed in other countries and non-Europeans (especially Americans) active in Europe (see figure 5).
At this point many students of migration, as well as a more broadly interested audience, might raise their eyebrows. Why would one include soldiers as cross-cultural migrants in the first place? In as far as there is interaction with others, one could argue that these contacts are impersonal, violent, and often lethal, and barely involve intimate relationships or the forging of new social ties à la Zelinsky (see also Tilly Reference Tilly, McNeill and Adams1978). Studies by military historians have shown, however, that soldiers who were sent to other countries, or to culturally different regions within empires, experienced probing and intensive encounters with other soldiers and civilians, and confronted them with different cultures and sociopolitical systems. These interactions often had a pervasive impact on the way they perceived other cultures, as well as their own, and as a result this military experience changed many of them, as well as the societies they returned to. Such changes might have been at the individual psychological level (including traumas), but their impact often transcended the individual and their intimate circle.
Colonial warfare by metropolitan soldiers, for example, often strengthened racist colonial relationships and stereotypes and thus influenced postcolonial rapports, as in the case of Algerian migrants in France (Lucassen Reference Lucassen2005). During the traumatic and savage Algerian War (1954–62) some two million French soldiers were sent to North Africa (among whom was Jean-Marie Le Pen; Aldrich Reference Aldrich1996: 297), and their experiences led to a very negative image of Algerians in general. By the time these soldiers, as well as colonial administrators and pieds noirs, returned in 1962 many of them had developed a strong anti-Algerian sentiment that was projected at the Algerian migrants who settled in large numbers in France in the postwar period. Clearly, this attitude clouded the mutual relationship between the French and Algerians and complicated the process of integrating Algerians into French society (Lustick Reference Lustick, Kacowicz and Lutomski2007: 51; Shepard Reference Shepard2006: 229; see also Comtat Reference Comtat2009; Fredette Reference Fredette2014; Scioldo-Zürcher Reference Scioldo-Zürcher2010).
Sending soldiers abroad could also have unexpected and transformative effects, by creating, for example, a much more critical awareness of the sociopolitical systems in which soldiers were socialized. Soldiers might, for example, become highly critical of the military project they are required to support (a phenomenon seen among US forces in Vietnam) and as a result become demotivated and undermine army moral or even defect (Appy Reference Appy1993: 318; Stevenson Reference Stevenson2002). Finally, soldiers can be exposed to a different societal system that makes them see their own culture in a whole new light. A most instructive example is the experience of black GIsFootnote 3 during, but especially after, World War II in Germany, where millions of Americans were stationed for at least two years as members of the occupation force and later at American bases in West Germany as part of NATO forces during the Cold War (Höhn Reference Höhn2002). For many of them, their tour of duty in Europe was their first experience outside the United States, or even outside their home state. For African American soldiers this meant being confronted with nonsegregated societies where, to their great surprise, they could date white women and eat in restaurants alongside whites, without the risk of being discriminated against or lynched. These European experiences had a huge impact and made them aware that what they had learnt to regard as a normal situation, was not normal at all. Although the US army upheld segregation within its ranks, the absence of a color line outside the barracks sparked a process of awareness and social action, not only among US soldiers in Germany, but also among the black population at home after the soldiers had returned and become active in the civil rights movement. Or in the prophetic words of the distinguished African American writer William Gardner Smith in 1947: after being treated as social equals black American GIs would “never go back to the old way again” (Höhn and Klimke Reference Höhn and Klimke2010: 1).
Another example are the German soldiers returning from the trenches in Flanders and northern France, whose experiences had made them susceptible to national socialist ideas. Many of them joined political right-wing associations (such as Stahlhelm), which would change German society dramatically (Schumann Reference Schumann2009: part III).
For most migrating soldiers, their encounters with others may have had less impact on their political persuasions. Still, the socialization of young men in the army does have many similarities with the migration experience. Especially in multiethnic empires, such as Russia, China, and the Habsburg and Ottoman empires, serving in the army meant temporary internal migration over large distances and the mingling with people who had very different cultural, religious, ethnic, and linguistic backgrounds. Moreover, it meant a new socialization process in an all-male authoritarian society in which radically different values and norms prevailed (Sanborn Reference Sanborn2005).
Those readers who are still not convinced that the migratory experience of millions of soldiers really counts when we want to understand the relationship between migration and social change can leave them out of the picture. The outcome of a more limited definition of CCM (leaving out soldiers) or of the conventional analysis is that the results appear similar, but the mechanism that produces the results is quite different (figure 6). Instead of being driven by immigration from other continents, the bulk of the (nonmilitary) CCMs was the result of ongoing urbanization.
CCMRs for Europe (excluding European Russia), without TMA, 1801–2000.

This brings us to the second major category in the CCMR approach, one that might raise eyebrows: internal migrants moving to cities. As we explained earlier, the CCMR method does not distinguish between city dwellers who left a village within a state and those rural folks who moved to cities in other European countries. Taking Europe as our unit of analysis means that someone who moved to London from Kensworth in Bedfordshire is put in the same category as a Romanian peasant who decides to settle in Paris (Diminescu Reference Diminescu2002). There are obvious differences in the nature and salience of the cultural boundaries these two groups cross. And therefore, the settlement process experienced by the foreign peasant due to a larger cultural distance, as well as to a less secure legal status, may be more difficult and prolonged. Nevertheless, they also share a common primary socialization in village societies and subsequently the cross-cultural experience of having to adjust to city life, with different norms, values, institutions, and networks (Lucassen Reference Lucassen and Clark2013). Moreover, until World War I, cultural differences within nation-states, let alone empires, were still considerable, which makes the rural-urban divide such a relevant boundary when it comes to the cross-cultural effects of migration.
During the twentieth century, in most nation-states the process of forging cultural homogeneity through education, the army, and the media (Weber Reference Weber1976) was so well advanced that, certainly in North America and Western Europe, the cultural differences between people in the countryside and in villages had become insignificant and internal rural to urban migrations should no longer be considered and counted as cross-cultural. We must realize, however, that in many countries this process of cultural homogenization was far from over by the twentieth century. Take, for example, the migration of southern Italian peasants from the Mezzogiorno to the industrial urban centers of northern Italy, such as Turin and Milan, in the 1950s and 1960s. At the time, they were considered illiterate, culturally backward, and even racially inferior people, whose “invasion” would cause major social and cultural problems (Gabaccia Reference Gabaccia2000: 162, 168; Mignone Reference Mignone2008: 216; for France see Moch Reference Moch2012).
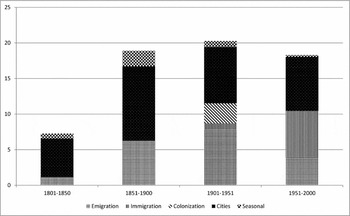
For those who, nevertheless, would like to exclude migrants who moved to cities within their own state, the CCMR method makes it possible to distinguish between these internal migrants and those coming from other countries. Excluding the internal migrants leads to the picture for Europe as visualized in figure 7.
Total net CCMRs per category for Europe without Russia, excluding migrations to cities within nation-states in the twentieth century and excluding soldiers and sailors, 1801–2000 (%).

After having omitted soldiers and internal migrants moving to cities, Europe's migration rates since 1850 prove remarkably stable, the only significant development being the well-known increase in the number of migrants from other continents settling in Europe. It is these “immigrants” who have attracted the most attention and explain why so many believe that migration is a recent phenomenon. Most of them, it should be noted, come from the fringes of Europe: North Africa (Morocco, Algeria) and Turkey. The often-cited “globalization” of past decades has therefore left fewer spectacular and exotic migration traces than is often assumed. Nowadays, people from all parts of the world live in Europe, and the large majority of the “immigrants” could be called “liminal Europeans,” either because they come from areas that are adjacent to Europe or because they come from ex-colonies (South Asia, the Caribbean) where many had already partially been socialized (largely by organizational migrants from Europe) in terms of language, institutions, and partly also religion (due to conversion).
The Added Value
What do we really gain by defining migration in a different, broader, less state-centered way, and how can it help to deepen our understanding of the effects of human mobility? And what do these new trends, and the new categories, explain what the conventional approach cannot? If we follow Manning, CCMs are key to explaining “social change,” which in Manning's definition encapsulates all aspects of human life, from economic to cultural changes, especially in the very long run. In other words, how people build societies, exploit natural resources, forge labor relations, classify and treat one another, anchor innovation, develop worldviews, and so forth.
If we want to develop and quantify Patrick Manning's loosely formulated conjecture that CCM leads to social change, a good place to start are cities, because they have long been “society's predominant engine of innovation and wealth creation” (Bettencourt et al. Reference Bettencourt, Lobo, Helbing, Kühnert and West2007: 7301; see also Glaeser Reference Glaeser2011 and Florida Reference Florida2002; Sassen Reference Sassen2005). In our CCMR model this interaction is captured in the “to cities” variant, one of the four key types of migration. The question then is, how does this interaction take place and with what outcomes? To understand the impact on social change of people moving to cities, we need to go beyond merely counting the number of migrants who settled in or frequented cities. Their numbers need to be contextualized in terms of membership regimes, and qualified in terms of skills and other forms of migrant capital.
In cities, people with widely different cultural backgrounds meet and influence each other in a high-intensity environment, due to a differentiated occupational structure, an extensive public sphere, and high population density. To understand the underlying mechanisms of CCM to cities, we suggest combining insights from several mainstream theories that aim to define the most ideal conditions for forging social change that leads to wealthier (and even more just) societies and, on average, produces greater well-being for the population. All these theories, implicitly or explicitly, focus on cities as cradles of innovation, economic growth, and social and cultural change. The concept of CCM (and especially the “to cities” variant) is, we believe, ideally suited to function as an interlinking principle for these different approaches and may contribute to uncovering the dynamics underlying such an “innovation engine” (Bettencourt et al. Reference Bettencourt, Lobo, Helbing, Kühnert and West2007: 7301). We selected the following six most mainstream theoretical angles from economics, political science, sociology and social psychology, demography, and history.
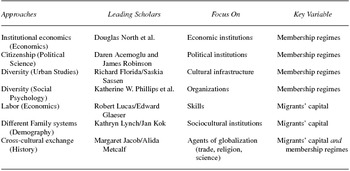
As table 1 shows, there are basically two variables that determine to what extent migrants to cities can stimulate social change. The first one is what we call “membership regimes” of receiving societies, which determine to what extent newcomers are able or likely to interact with natives and how that interaction is structured (Lucassen Reference Lucassen and Clark2013). In cases of highly asymmetrical relationships, for example slavery, but also where migrants are concentrated in ghettos or foreign miners in South Africa, interactions are few, unequal, and limited, and consequently social change is slow. At the other end of the continuum interactions are intensive, with ample opportunities for people with different cultural capital to develop new ideas on a level playing field. Such interactions occur in many contexts, not least on the shop floor. It is therefore important to look at the (gendered, ethnic, social, etc.) composition of organizations as well. The degree of “open access” not only varies in general, it can also differ from one dimension to the other: Newcomers may be treated equally in economic institutions, whereas political citizenship is denied. Finally, it is not only the degree of openness that matters, but also the mere availability of certain urban institutions, such as the cultural infrastructure, which is so central in the work of Margaret Jacob (Reference Jacob2006) on the early modern period and Richard Florida (Reference Florida2002) on the present.
Main stream theories aimed at explaining social change in cities

Other scholars, like Henry Lucas, focus on the human capital of migrants, arguing that cities are ideal environments for new immigrants to share or accumulate the skills required by modern production technologies (Lucas Reference Lucas2002). The higher the level of skills migrants bring, the better for economic growth for example, and from there the spin-offs for other developments in cities. Cultural capital also matters and may introduce new ways of thinking, norms, and values and foster social change in other realms. And, vice versa, cities may change the prevailing cultures of migrants, such as family systems, because they offer alternative institutions that reduce risks of unemployment or sickness, as argued by Lynch (Reference Lynch2003). Migrants, however, might also want to preserve their culture, or aspects (religion, caste, language, etc.) of it, and resist full assimilation or integration by marrying predominantly within their own network (Kraybill and Olshan Reference Kraybill and Olshan1994; Lucassen and Laarman Reference Lucassen and Laarman2009; Shibutani and Kwan Reference Shibutani and Kwan1965), or, as in the case of the Amish, isolate their entire lifestyle.
We believe that our CCM approach is well suited to link these various strands of literature and theory in one coherent conceptual model. Before presenting this in full, we first return to Manning's definition of “social change” and the somewhat similar neo-evolutionary approach of Ian Morris, whose most recent work sets out to explain differences in “social development” between different parts of the world in the somewhat shorter, but still considerable, time span of 15,000 years. Morris defines “social development” as the ability of social groups to master their physical and intellectual environment and “get things done in the world” (Morris Reference Morris2013: 3). Or, more precise, social development is “the bundle of technological, subsistence, organizational, and cultural accomplishments through which people feed, clothe, house, and reproduce themselves, explain the world around them, resolve disputes within their communities, extend their power at the expense of other communities, and defend themselves against others’ attempts to extend power” (ibid.: 5). To measure and quantify social development Morris distinguishes four characteristics: (1) energy capture (efficient); (2) social organization (complex, measured by city size); (3) war-making capacity; and (4) information technology (literacy, printing).
It should be stressed that social development can be evaluated very differently and is not intrinsically “good” or “bad.” Not only does such a value judgment depend on one's position and interests, it also hinges on how one appreciates the impact in the short or long run. The Creolization in Latin America following the very unequal encounters and interactions between Spanish and Portuguese invading migrants and the native populations is an example of social and cultural change. However, it came at a huge cost, and furthermore people may value its outcome very differently. The same is true for the impact of Austrian political entrepreneurs, like Adolf Hitler, who introduced a specific Austrian anti-Semitic mass-action populism in German politics that had been developed in fin de siècle Vienna by politicians such as the Christian Socialist Mayor Karl Lueger (Geehr Reference Geehr1990). No one can deny that the interaction of migrants such as Hitler with German politicians led to political innovation, but by far the most will wholeheartedly deplore the consequences of this particular example of CCM.
Although both Manning and Morris are primarily interested in evolutionary changes over a very long period, their approach is also useful if we want to understand developments in past centuries. Nevertheless, we propose to modify their typologies and categories to make them more suited to the measurement of social development in the past and at the same time make them more value neutral. A way out is offered by the “human capability” approach of Drèze and Sen (Reference Drèze and Sen2013: 292 ff.), which looks at per capita income, GDP, health (longevity, mortality, and fertility), literacy and education, gender patterns, and savings, investments, and trade. These indicators overlap with the UN Human Development Index, which was developed in 1990 by the Pakistani economist Mahbub ul Haq and the Indian economist Amartya Sen. It summarizes three dimensions (life expectancy at birth, knowledge and education, and standard of living) in a single index number, ranging in 2015 between 0.287 (Niger) and 0.94 (Norway) (Human Development Report Reference Jahan2015: table 4). Finally, economic historians have measured similar indicators to map global developments in “well-being” over the past two centuries.Footnote 4
If we then integrate the various (long- and short-term) indicators and ask the question to what extent migration and migrants have caused social change or development in the societies of departure and arrival and how it impacted migrants and nonmigrants, we should distinguish between individual indicators (wages, gender, and income inequalities, health and education) and collective indicators (with variables such as GDP, social organization, and political institutions). Such a scheme has the advantage that we can look separately at changes for migrants at destination—on whom most studies concentrate—but also look at the effects on the region that migrants left, and might return to, or remain in contact with (through sojourning, transnational ties). Moreover, we can also include the effects of migration and cross-cultural contacts on those who stay put, either at destination or origin. Finally, at a more collective, societal level this approach offers us the opportunity to detect more structural—and often more long-term—changes in the social, cultural, economic, and political characteristics of sending and receiving societies.
A combination of both perspectives (migration and social change or development) opens a new panorama enabling us to understand the role migration plays in the development of human societies in the long and short run. When we link this to our CCMR method, we could argue that migration is an important variable because it enables processes of circulation (of ideas, goods, and people) in two crucial ways. First, migrants are crucial as carriers of labor power (forced or free), either to work in cities, in agriculture, on plantations, or as soldiers and sailors. And second, migrants are carriers of ideas, goods, and various kinds of capital, which can vitalize (or slow down, depending on the content of their ideas and capital) societies. If we want to understand the process of social change (Manning) or social development (Morris), migration can be fruitfully studied as an explanans.
Building a Theoretical Model
Cross-Cultural Migrations
The CCMR method may be a good place to start for mapping the extent of circularity in general, but it also offers a starting point to study in more detail the circulation of people and ideas at lower levels of abstraction and for smaller units of analysis. To do this, and to understand the effect of different forms of “cross-cultural migration,” we need to go beyond merely quantifying the proportion of the population that experienced at least one cross-cultural move during their life. A first step in developing a middle-range theory in which CCM is studied as a root cause of social change/development is to attribute “weights” to the four basic types of CCMs (to cities, colonization, seasonal, and TMA).
In general, it seems reasonable to assume that migrations to cities have a greater impact and potential for change than colonization because cities offer much more opportunity for interaction and harbor a much greater variety of cultures. Second, we assume that seasonal migrations do change receiving societies, as they enable the rural population at destination to move to cities, but it seems that by far the biggest impact of seasonal migration was felt in the societies at origin, to which the migrants return each year. Due to the commodification of the labor power of peasants as seasonal migrants, their earnings are often invested at home and thus stimulate commercialization and monetization processes by linking these economically less developed regions to the market economy. TMA migrations, finally, may have considerable influence both at origin and destination (as we saw with the example of black American GIs), but this depends very much on the specific situation. Less fuzzy is the role of highly skilled organizational migrants, such as missionaries, scholars, and technical experts. Notwithstanding their limited numbers, especially in colonial settings their power and status were a crucial lever in forging change (in terms of language, religion, ideas, and human capital). These considerations, which must be checked against each specific situation, could lead to the application of “weights” for the impact of social change induced by migration. We propose the following scale: 0 is no effect on social change/development, 1 small, 2 medium, and 3 large, limited to positive effects and limited to the collective, societal, level.
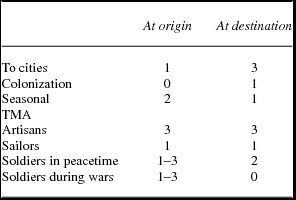
To illustrate how weights can be attributed in a specific case, let us look at the debate on the divergence in economic development that emerged between northwestern Europe and China from the eighteenth century (and possibly even earlier) and that was followed by a slow convergence some two centuries later (Bourguignon Reference Bourguignon2015). As we will argue later, “adding weights,” large-scale in-migration to cities—which had begun in northwestern Europe as early as the sixteenth century—had a much more transformative economic and cultural effect than Chinese colonists moving to the periphery of the empire. Moreover, the cross-cultural effects in Europe were further deepened by widespread seasonal and temporary (TMA) migration, not least in the regions of origin to which many of them returned. Having been exposed to different market economies, hierarchies, and material and spiritual values at their destination, these temporary migrants had a more significant impact in northwestern Europe during the early modern period—given constant international warfare and the demand for intercontinental sailors—than in China. Only after the 1970s, when China's policy of economic liberalization unchained the countryside and led to spectacular urbanization, was there a transformative impact of CCM on Chinese society. These considerations then might lead to the following weights (table 2).
Attributing “weights” for the positive effects to the four CCMs at the collective, societal, level

This would mean that with similar CCMRs in, for example, Europe and China until the mid-twentieth century, the transformative effects of CCMs at destination in Europe would still be larger because its CCMR consists to a much greater extent of migration to cities and TMA.
Migrants’ Capital
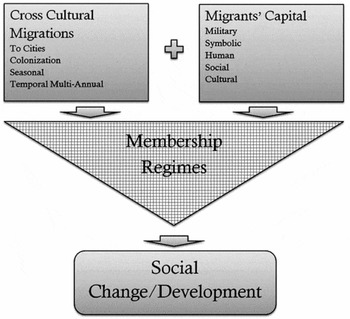
As the example of organizational migrants shows, to predict the impact of CCMs we should map the characteristics of the migrants in terms of symbolic capital (status), human capital (skills), social capital (networks), cultural capital (language, religion, worldviews), and military capital (power). Migrants to cities with high levels of human capital will cause changes different from those with low skills, and the same is true for migrants with deviant ideas. To hypothesize about the conditions under which change takes place, the CCMs therefore have to be “enriched” with migrants’ capital. As an example of human capital, one could take migrants to cities. It matters whether they have acquired useful skills at origin, such as commercial skills (as peddlers) (van den Heuvel and Ogilvie Reference van den Heuvel and Ogilvie2013) or technical skills (as artisans), or whether they were predominantly peasants. Moreover, we would also like to know to what extent people who moved to cities already had past urban experiences and specific technical skills, as was the case with many English workers who moved (temporarily or permanently) to North American industrial urban centers (Baines Reference Baines1985; Berthoff Reference Berthoff1953). However, as we indicated earlier, the nature and level of interaction between migrants and settled populations can also be limited due to the social and cultural capital of migrants, who for various reasons might want to foster their own networks and culture.
Membership Regimes
The third analytical tool necessary to build a theoretical model is the notion “membership regime,” which links the CCMRs and migrants’ capital to the prevailing complex of rules, regulations, customs, and values surrounding the entry and long-term settlement of migrants in a new polity.Footnote 5 The reason for including the opportunity structure of the receiving polity is that the impact of CCMs depends largely on the freedom of newcomers to deploy their human and cultural capital at the receiving end in interaction with those present. “Moving to cities,” to give just one example, occurred in many ways. Once in a city, migrants might be confronted with a highly segregated polity, or one that is characterized by a relatively “open access regime” (North et al. Reference North, Wallis and Weingast2009). The degree of openness of the receiving society, which following the CCM logic might be a city (migration to cities), an agricultural frontier, a plantation or labor camp (migration to land), an army, shipping company (TMA), or a commercial wage labor market (seasonal), determines to a large extent the opportunities for exchanging (and accumulating) ideas and human capital. Membership regimes are important because they determine the extensity, intensity, and equality of the interaction between migrants and the native population. If migrants are completely isolated, for example as slaves in labor camps, the chances of cross-cultural interaction are extremely limited, whereas in situations in which we can speak of “open access,” as with foreign merchants in early modern Amsterdam and London, or with the creative class in the global cities of today (Gelderblom Reference Gelderblom2014; Sassen Reference Sassen2005), the opposite is the case. In between these two extremes are the millions of ordinary men and women who have flocked to European cities since the sixteenth century and who, together with those already there, became part of a vibrant public sphere, broadly accessible urban institutions, with greater scope for individualistic agency; in combination, these stimulated social and institutional innovation (de Moor Reference de Moor2008; de Moor and van Zanden Reference de Moor and van Zanden2010; Lucassen and Willems Reference Lucassen and Willems2012).
One type of membership regime often overlooked in migration studies is where migrants set the rules. Although “invader migration” might lead to major changes (positive as well as negative) for those already present at the destination, highly asymmetrical power relations can nevertheless also limit social change/development. Take the example of Spanish conquistadores in Latin America in the fifteenth and sixteenth centuries, who imposed Spanish as the main language and Catholicism as the dominant religion. At the same time, between the sixteenth and the nineteenth centuries millions of slaves were shipped to the Caribbean (Wood Reference Wood, Heuman and Burnard2011). These migrants were not only exposed to hardship and death, they were also forced to convert, learn the language of their masters, and give up most of their original culture. Although slaves had more agency than has long been assumed and were to some extent able to hold on to their cultures and contribute to various forms of Creolization,Footnote 6 the extent of social change was one-sided. In both cases (the Amerindians and the African slaves) the result of the interaction seems predominantly to have involved the imposition of the invaders’ culture rather than the creation of new outcomes.
In figure 8 we have summarized the three analytical building blocks necessary to formulate a middle-range theory that aims at explaining the impact of CCMs on receiving (and sending) societies in terms of social change or social development.
Schematic representation of the relationship between CCM and social change.

The final step at this point would be to unpack “social development” using the four dimensions adduced by Ian Morris (energy capture, social organization, information technology, war-making capacity) and link these to the three analytical building blocks. For the moment one could say three things in this respect. As for CCMs there seems to be a logical connection between “migration to cities” and social organization and between TMA and war-making capacity. As for migrants’ capital, this is highly relevant for energy capture and information technology, as the skills and ideas of migrants will be instrumental in forging changes in these domains. Finally, it seems reasonable to assume that the more “open access” membership regimes are, the greater the impact CCMs will have on social development.
Eurasian Comparisons
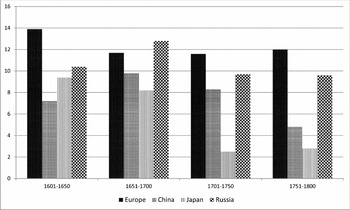
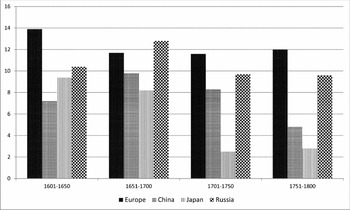
Nourished and inspired by the theoretical models of Manning and Morris, in the remainder of this article we will apply some of these preliminary thoughts to the aggregate results recently published in a volume in which the CCMR method is used to map migration in Eurasia (Lucassen and Lucassen Reference Lucassen, Lucassen and Fauri2014b). A closer look at developments in Eurasia shows that comparisons in time and space at the aggregate level are the most useful for identifying broader trends and generate new questions, which then must be tested at lower levels of abstraction. In the following figure, total CCMRs for Europe, Russia, China, and Japan are visualized. They show a growing divergence from the eighteenth century, with rates in East Asia decreasing considerably and those in Europe and Russia remaining stable (see figure 9).
CCMRs in Europe (without Russia), Russia, China, and Japan, 1601–1800.
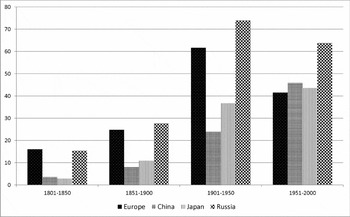
As figure 10 shows, this gap widened even further in the nineteenth century before slowly converging, especially in the second half of the twentieth century. For China, Japan, and Russia, the steep increase cannot be explained by immigration from abroad. Instead of “immigration,” which was very low in all three cases, CCMs in Asia consist predominantly of people moving to cities. In other words, whereas large parts of Europe had already become urbanized—primarily by migration—between the seventeenth (the northwest) and nineteenth centuries, the take-off in Russia and East Asia took place mainly in the twentieth century (Japan was a notable exception, with early urbanization in the sixteenth and seventeenth centuries). A second important difference between Europe and the other three large Eurasian territories relates to colonization.
CCMRs in Europe (without Russia), Russia, China, and Japan, 1801–2000.

People who migrated, often forced or encouraged by the state, to sparsely populated frontier areas formed a significant component of CCM in Russia and East Asia, which is explained not only by the relatively low population density in these three states, but also by the fact that we are dealing here with empires that constantly expanded their territory at the expense of nomadic tribes in Central Asia and, to consolidate their conquests, had a great interest in populating the newly acquired frontier provinces with people from the center. Most of these colonists were farmers, or soldiers turned farmers, and therefore fit the category of colonization. Apart from the Habsburg and Ottoman empires (which both collapsed during World War I), state formation in Europe was in contrast distinguished by a fierce competition between territorial and later nation-states, with little space for colonization. This produced constant warfare and hence a huge demand for soldiers, often from other countries (Tilly Reference Tilly1990). Together with millions of sailors who manned Dutch, Portuguese, British, French, and Spanish ships on a quest for riches in Asia and the Americas during the first phase of globalization following the discovery of the Americas and the route to Asia via the Cape of Good Hope, these TMA migrants constitute about 60 percent of all CCM prior to the nineteenth century.
The trends over time in the different Eurasian regions tell us several interesting things. First, and this is in line with the general historical development, the European ratios are not only much higher than those in East Asia, at least until the mid-twentieth century, they also display different forms of cross-cultural contact. In Europe, migrants to cities and migrants as soldiers and sailors (TMA) dominate. In both cases, we can speak of an intensive mixing of people from different cultural backgrounds in spaces with a high population density. Moreover, due to the generally open-access nature of cities and armies (especially in Western Europe) (Davids and Lucassen Reference Davids and Lucassen1995; de Vries Reference de Vries1984; Lucassen Reference Lucassen and Clark2013) and the on average relatively high level of human capital of the migrants (Bade et al. Reference Bade, Emmer, Lucassen and Oltmer2011; van Lottum Reference van Lottum2011; van Lottum et al. Reference van Lottum, Lucassen, Heerma van Vos and Unger2011), these CCMs were characterized by multiple interactions with a high impact. It seems reasonable to assume that this caused considerable social change/development and stimulated social development: knowledge, ideas, and labor floated freely and the intense (military and otherwise) competition between cities and between states promoted economic growth and the accumulation of technological expertise (Davids Reference Davids2008; Mokyr Reference Mokyr2002). All four features of social development mentioned by Morris, especially social organization, war-making capacity, and information technology, made important advances and largely explain the widening gap in terms of military power and wealth between Western Europe and large parts of Asia.
In Russia and China, even when the total CCMR was high (as in Russia), the building blocks differed. As noted earlier, colonization had been much more important, but this type of CCM most probably had much less of a transformative effect (see table 2). Not only was it more extensive than intensive, often there was little, or highly asymmetrical, interaction with the people already present in the frontier areas. The same is true for seasonal migrations, whereas people moving to cities constituted a much smaller part of the total. On top of this we need also to realize that Russian and Chinese cities were much more segregated along religious and ethnic lines, and so cross-cultural interactions in urban spaces were less frequent and intense than in Western Europe (Lucassen Reference Lucassen and Clark2013; see also Rowe Reference Rowe1984: 213–15). In China, this limited access to urban institutions and consequently higher levels of spatial and social segregation have continued during the recent revolutionary phase of mass urbanization. Due to the distinctions between rural and urban administrative units (the hukou system), rural migrants who settle in cities are to a large extent de facto excluded from urban citizenship and services (housing, welfare, including schools for their children) and channeled into the secondary (low-paid and offering no prospect of upward social mobility) tier of the labor market (Shen Reference Shen, Lucassen and Lucassen2014; Swider Reference Swider, Kuruvilla, Kwan Lee and Gallagher2011; Whyte Reference Whyte2010; Zhang and Wang Reference Zhang and Wang2010).
Adding Weights
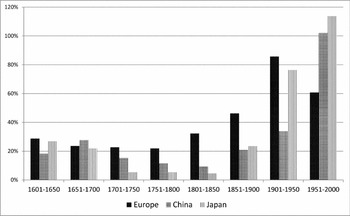
As discussed before, a final step in our CCMR approach is to add weights to the four different categories, based on the expected potential to forge change. In figure 11 we apply the multipliers from table 2 (3 for “to cities” and 2 for TMA). This highlights the spectacular economic developments seen in Japan (since the end of the nineteenth century) and China (after the 1970s) much better than in figures 9 and 10, but also reflects better the stabilizing influence of the transition from the Ming to the Qing in China in the mid-seventeenth century.
Weighted CCMRs for Europe, China, and Japan 1600–2000.

Finally, to return to the Great Divergence debate, figure 11 shows an interesting correlation between CCM and economic development from the beginning of the seventeenth century. The divergence between Europe and China was further exacerbated during the first half of the twentieth century, only to be reversed in the second half of that century, when unprecedented numbers of Chinese started moving to cities. This massive flow should not simply be regarded as the necessary “cannon fodder” for China's industrialization and urbanization process, it also forged structural institutional and social changes in the relationship between citizens and the state (Tang and Holzner Reference Tang and Holzner2007) and between family members.
Although family systems in villages had undergone changes even before World War II, the revolutionary process of urbanization since the late 1970s speeded up the process of individualization, partly replacing family and kinship by much more heterogeneous urban communities as the prism of social organization (Daming and Yingqiang Reference Daming, Yingqiang and Guldin1997; Ngai Reference Ngai2005). Apart from a greater stress on consumption and aspirations of a better life, the high mobility of young people also has consequences for China's patriarchal family system. As recent anthropological studies show, young migrants are now starting to defy a centuries-old tradition of accepting a partner selected by their mutual families, forcing the bride to move into the husband's household. Being far away from home and less controlled by family ties, young Chinese migrants in booming cities have begun to make their own individual choices and to settle on their own (“neo-locality”). In other words, many migrants no longer accept marriage as a contract between two families, but rather between two individuals (de Moor and van Zanden 2008: 6; Jacka et al. Reference Jacka, Kipnis and Sargeson2013; Nansheng Reference Nansheng and Qiang2010; Zhang Reference Zhang2009). Although it is too early to tell how structural this trend is, it is a telling example of how CCM can lead to significant social change.
Conclusion
In this article, we argue the need for a less state-centered definition of migration to understand better the relationship between CCMs and social change or social development in the long run. We have therefore developed a new definition of migration that enables researchers to systematically compare CCMRs through time and space. This CCMR method is not blind to political factors. Far from it. But it puts issues of state policies and citizenship in a much broader social context. We can thus conclude that while the opening quote, taken from Castles and Miller, might not be completely off the mark, it is highly idiosyncratic and myopic, as it privileges modern migrations crossing state borders over internal moves, and it—implicitly—seems to favor migrants who intend to settle for good. Theirs is a legitimate choice, especially if the core explanandum is the way the long-term settlement process in another modern state evolves.
If one is more interested in social change over time, wrought by CCMs and their effect on both migrants and on sending and receiving societies, then such a definition is inadequate. Moreover, even if one limits oneself to long-term settlement (in terms of assimilation, integration, or otherwise) (Alba and Nee Reference Alba and Nee2003; Foner and Lucassen Reference Foner, Lucassen, Crul and Mollenkopf2012; Lucassen Reference Lucassen2005), the gaze of the state falls short as well, because the power and interest of territorial states in controlling migration is a very recent phenomenon and in most states emerged—at least in Western Europe and North America—in the late nineteenth century with the “nationalization” and “bureaucratization” of international migration (Rosental Reference Rosental2011), resulting in a statist migration control regime around World War I (Lucassen Reference Lucassen, Böcker, Groenendijk, Havinga and Minderhoud1998; McKeown Reference McKeown2008). Before that, migration controls were exerted much more at the level of cities or, especially in empires (such as Russia), internally (Garcelon Reference Garcelon, Caplan and Torpey2001; Torpey Reference Torpey2000). Especially in early modern Europe, membership regimes were built locally, and so for comparisons over time that are intended to reveal the similarities and differences in the settlement process of migrants with our current world the nation-state model has severe limitations.
The second result of this article is the development of (admittedly) preliminary ideas on how to construct a middle-range theory that links the different kinds of CCM as distinguished in the CCMR method to social change and social development. The three analytical building blocks we propose and that we linked to the four dimensions of social development suggested by Ian Morris are, of course, open to discussion. For the moment, the model seems to work, at least at the aggregate level, but the proof of the pudding is in the eating at the meso- and microlevel.
In the more empirical parts of this article we have concentrated on the effects of societies receiving migrants, in this case Eurasia between 1500 and the present. Individual migrants and nonmigrants in sending and receiving societies have been largely left out. Finally, and paradoxically, integration and assimilation leads in the long run to diminishing opportunities for social development through cross-cultural experiences. A possible consequence could be the slowing down of social change, or even a kind of “cultural involution” (after Geertz Reference Geertz1963), as due to globalizing migration cultures converge further and thus cultural boundaries become less salient or disappear entirely (as was already the case in migration to cities within culturally homogenous nation-states in the twentieth century). Logically speaking, this is also an implication of the model, presently to be developed further.