Repression is one of the defining features of autocracies (Bueno de Mesquita and Smith Reference Bueno de Mesquita and Smith2011; Davenport Reference Davenport1995; Greitens Reference Greitens2016; Haggard Reference Haggard1990; Svolik Reference Svolik2012; Truex Reference Truex2019). The main goal of repression is to demobilize disloyal citizens (Bellin Reference Bellin2004; Levitsky and Way Reference Levitsky and Way2012). In the short term, repression can effectively deter disloyalty by raising the costs of continued resistance and depleting an opposition's pool of recruits and resources. Scholars thus consider it to be one of the main pillars of stability in autocratic regimes (Dickson Reference Dickson2016b; Gerschewski Reference Gerschewski2013).
While repression can effectively enforce compliance in the short run (Lichbach Reference Lichbach1987; Moore Reference Moore1998), few empirical studies have investigated its long-term effects in durable authoritarian regimes.Footnote 1 Important questions remain unanswered. For example, how long can repression's deterrent effects last? Could repression lead alienated citizens to cultivate long-lasting dissenting political attitudes? Under what conditions might these dissenting attitudes be translated into contentious behavior, such as protest?Footnote 2
A distinguished line of research has started to investigate the legacies of authoritarian repression after regime collapse. For example, Lupu and Peisakhin (Reference Lupu and Peisakhin2017) find that the descendants of Crimean Tatars who were forcibly deported by the Soviets in 1944 more intensely identify with their ethnic group, more strongly support the Crimean Tatar political leadership, hold more hostile attitudes toward Russia and participate more in politics. Similarly, Rozenas, Schutte and Zhukov (Reference Rozenas, Schutte and Zhukov2017) show that past Soviet state violence in western Ukraine has made affected communities less likely to vote for ‘pro-Russian’ parties today. But we still know relatively less about repression's long-term effects while the regime is still in power.
There are good reasons to expect the long-term effects of repression to be different in a durable authoritarian regime. After a regime transition, the state no longer signals its willingness to punish citizens for their disloyal behavior, and citizens have more political space in which to express their dissent through (semi-)competitive elections. So past repression might have a ‘backlash effect’ after a regime collapses that provokes more protests against the former ruling party. In a durable autocracy, however, the state remains willing and able to carry out these punishments. We should therefore expect state repression to have long-term coercive effects that suppress citizens’ anti-government behavior. Indeed, emerging evidence shows that when a regime can renew its threat of violence, citizens who have been exposed to more past repression behave more loyally toward the regime (Rozenas and Zhukov Reference Rozenas and Zhukov2019).
An absence of mass uprisings, however, does not indicate a lack of mass discontent (Kuran Reference Kuran1991). State repression may generate alienating effects on political attitudes. Consistent with the nascent literature on political violence, citizens exposed to state-sponsored violence are more likely to reject the perpetrator's authority and ideas, which provokes hostile attitudes toward a violent regime (Balcells Reference Balcells2012; Lupu and Peisakhin Reference Lupu and Peisakhin2017; Rozenas, Schutte and Zhukov Reference Rozenas, Schutte and Zhukov2017). State repression might create ‘silent dissidents’ – citizens who resent the regime but do not act on this sentiment – as long as it can credibly threaten violence.
I evaluate state repression's long-term coercive and alienating effects by examining one of the most tragic episodes of authoritarian repression in recent times: state terror during China's Cultural Revolution (1966–76). Initiated by Mao Zedong in 1966 and ending with his death in 1976, the Cultural Revolution caused 1.1 to 1.6 million deaths and subjected 22 to 30 million people to some form of political persecution (Walder Reference Walder2014, 533). The vast majority of casualties were caused by state repression rather than the actions of insurgents (543). This extraordinary toll of human suffering is greater than some of the modern era's worst incidents of politically induced mortality, such as the Soviet ‘Great Terror’ of 1937–38, the 1994 Rwandan genocide, and the Indonesian coup and massacre of suspected communists in 1965–66.
The traumatic events that occurred during the Chinese Cultural Revolution present an unusual research opportunity. China is one of the most durable authoritarian regimes in history. Unlike many hybrid regimes that have become less repressive over time, the Chinese regime has credibly renewed its threat of violence since 1989 (Wang Reference Wang2014; Wang and Minzner Reference Wang and Minzner2015). The Chinese state's persistent coercive capacity makes it possible to study the long-term effect of repression by a single regime that has experienced leadership changes. This unique combination of regime continuity and leadership turnovers enables researchers to examine how victims of repression attribute blame. Do they blame the leadership that imposed the violence, or the regime that empowered the leadership? Lastly, China also represents a ‘hard test’ because state censorship of public discussions of the Cultural Revolution (in movies, books and academic research) makes it harder for the effects to extend beyond the victimized generation.Footnote 3 Can past repression influence a younger generation that has never directly witnessed the violence?
To address these questions, I analyze a prefectural-level dataset of violence during the Cultural Revolution and a nationally representative survey conducted in 2008. I find that the events of this period have a persistent effect on political attitudes and behavior almost a half century later. Respondents who grew up in areas that experienced more violence during 1966–71 are less trusting of current national leaders and more critical of the political regime, as reflected in their condemnation of the country's lack of democracy and freedom of expression. In contrast to recent research that finds repression has a ‘backlash effect’ after authoritarian collapse (Lupu and Peisakhin Reference Lupu and Peisakhin2017; Rozenas, Schutte and Zhukov Reference Rozenas, Schutte and Zhukov2017), I find that repression, despite causing more discontent, has decreased contentious behavior such as protest.
State repression not only directly affected the generation that witnessed the violence; it also indirectly influenced the generation born after the Cultural Revolution. But this effect fades over time: younger respondents are less (but still significantly) influenced by the violence. Consistent with recent studies on family socialization (Bisin and Verdier Reference Bisin and Verdier2001; Lupu and Peisakhin Reference Lupu and Peisakhin2017), I find that the more the younger generation discusses politics with their families, the more strongly their political attitudes are influenced by past repression. This pattern suggests the power of private channels of political socialization, despite state censorship of the issue.
Violence during the Cultural Revolution, however, was not randomly assigned. In addition, the outcome variables – political attitudes and behavior – are common individual features that can be the effect of many causes, such as historical events, family background and socio-economic factors. The non-randomness of the explanatory variable and the multiple potential causes of the outcome variables all pose threats to inference. One potential threat is that the prefectures that had more disloyal citizens before the Cultural Revolution were more likely to be targeted during the repression, and their disloyalty (at the regional and individual levels) continues to persist today. Secondly, other historical events, such as the Great Famine, may be correlated with the severity of Cultural Revolution violence and subsequent political attitudes and behavior. Lastly, unobservable regional- and individual-level factors might cause omitted variable bias.
I pursue three main strategies to address the possibility that these threats may be influencing my results. First, I collect a wide range of pre-treatment historical and geographic variables, including a measure of prior political alignment proxied by Communist Party member density and measures of Great Famine severity, and show that none of these variables successfully predicts Cultural Revolution violence. This supports the qualitative evidence that repression during the Cultural Revolution was indiscriminate (MacFarquhar and Schoenhals Reference MacFarquhar and Schoenhals2006, 256). Secondly, I control for respondents’ family class backgrounds,Footnote 4 as defined by the Chinese government in the early 1950s, as a proxy for the family's prior political identity before the Cultural Revolution. Lastly, I employ an instrumental variable (IV) approach to tackle potential endogeneity and omitted variable bias. I exploit localities’ exogenous variation in their proximity to sulfur mines, which determined the locations of arms manufacturing plants. These factories were heavily guarded by the army and experienced less violence. My IV estimates are similar to my original results.
Most of my analyses assume a channel internal to the individual – repression altering the political identity of victimized communities. But as Nunn and Wantchekon (Reference Nunn and Wantchekon2011, 3223) suggest, there might also be an external channel linking historical events and current outcomes. The violence might have produced a long-term deterioration of political institutions that affects current residents’ attitudes and behavior. To evaluate this alternative mechanism, I focus on the new residents who moved to their current prefectures as adults. If the violence affects attitudes and behavior primarily through its deterioration of institutions or other factors external to the individual, then we should expect it to affect these new residents as well. My estimates using the new residents, however, are small and weak, indicating that the internal channel is the primary mechanism.
To my knowledge, this is the first evidence of the long-term effects of state repression in a durable authoritarian regime. My findings contribute to the literature on authoritarian politics. While previous studies have focused on how autocrats use repression to consolidate their regimes (Bellin Reference Bellin2004; Levitsky and Way Reference Levitsky and Way2012; Svolik Reference Svolik2012), I show that repression might produce ‘silent dissidents’ who hold anti-regime attitudes even after leadership changes, although they might not have acted on these negative views yet. This finding differs from recent studies that show the ‘backlash effect’ of state repression on anti-perpetrator behavior (Lupu and Peisakhin Reference Lupu and Peisakhin2017; Rozenas, Schutte and Zhukov Reference Rozenas, Schutte and Zhukov2017). The persistent hostile attitudes toward the leadership and regime suggest the inheritability of blame: future leaders of the same regime will be held responsible for some of their predecessors’ wrongdoings. The seeds of dissent, sown decades ago, might grow into anti-regime behavior in the future when political opportunities change (Kuran Reference Kuran1991).
I also contribute to the distinguished line of research on political attitudes in China. Previous surveys have found that Chinese citizens exhibit a high level of trust in the national government and leadership. Much scholarship has examined the trust-boosting effects of high economic growth, policy successes, the media and Chinese traditional culture (Chen and Dickson Reference Chen and Dickson2010; Dickson Reference Dickson2016a; Lü Reference Lü2014; Shi Reference Shi2001; Stockmann and Gallagher Reference Stockmann and Gallagher2011; Tang Reference Tang2016). Most studies conclude that more than 90 per cent of the Chinese population trusts the national government, which makes the hostile attitudes held by the remaining 10 per cent (about 140 million people) even more intriguing. I trace the historical evolution of these dissenting attitudes.
Background and Theoretical Expectations
In this section, I will provide a brief historical background of the Cultural Revolution and then derive several expectations from previous studies about how state repression affects people's long-term political attitudes and behavior.
Historical Background
MacFarquhar and Schoenhals (Reference MacFarquhar and Schoenhals2006, 1) describe the Cultural Revolution as a ‘watershed’ in Chinese modern history and ‘the defining decade of half a century of Communist rule in China’. Many scholars believe the origins of the Cultural Revolution should be understood through the lens of Mao's goals to change the pattern of succession and to discipline the country's huge bureaucracies (Lieberthal Reference Lieberthal2004; MacFarquhar Reference MacFarquhar1997).
The early and most chaotic period was from 1966–69. In August 1966, Mao encouraged urban middle school and college students to form Red Guard groups to attack ‘class enemies’ and the party. Millions of teenagers whose schools were closed formed Red Guard groups based on their class backgrounds, geographic locations and personal ties, and quickly launched a reign of terror in most cities (Chan, Rosen and Unger Reference Chan, Rosen and Unger1980).
Because of the Red Guards’ visibility and large numbers, earlier works on the Cultural Revolution often explain the violence from this era as the result of group conflict. Many scholars use the language of mass insurgencies to describe this period in which various groups organized to press their interests and make demands against party authorities (Chan, Rosen and Unger Reference Chan, Rosen and Unger1980; Lee Reference Lee1978). As some recent studies show, however, the public officials themselves were major players in causing the chaos and violence, as they were in widespread rebellion against their superiors (Walder Reference Walder2009; Walder Reference Walder2016). For example, beginning in January 1967, lower-ranked officials, with the help of the People's Liberation Army (PLA), Red Guard groups and urban workers, started to seize power by sweeping aside party and government leaders to form ‘revolutionary committees’ in various cities to exercise authority (Walder Reference Walder2016).
In May 1968, Mao mobilized new revolutionary committees to conduct his ‘Cleansing the Class Ranks Campaign’. The campaign was ‘a purge designed to eliminate any and all real and imagined enemies’ and ‘provided whoever happened to be in power with an opportunity to get rid of opponents’ (MacFarquhar and Schoenhals Reference MacFarquhar and Schoenhals2006, 253). Although it originally had a well-defined target, that target became blurred and the process degenerated into uncertainty. As MacFarquhar and Schoenhals (Reference MacFarquhar and Schoenhals2006, 256) observe, ‘Local officials invariably broadened its scope and used it as an excuse to intensify the level of organized violence in general’. As a result, the violence became increasingly indiscriminate.
According to Walder's (Reference Walder2014) estimate based on local gazetteers, the vast majority of the deaths that can be linked to specific events during 1966–71 were caused by the actions of authorities associated with the Cleansing the Class Ranks Campaign. Su's (Reference Su2011) ethnographic research in Guangdong and Guangxi shows that the killings did not follow a master plan. While the center initially mobilized the campaign, local officials and militia leaders unexpectedly initiated collective killings and arbitrarily expanded the campaign to target their enemies; upper-level authorities failed to contain increasing radicalization at the lower levels (Su Reference Su2011, 125–55). Walder (Reference Walder2015, 276) compares the campaign to ‘inquisitions and witch hunts’ in which one victim's confession led to the arrest of many others, finally escalating to claim large numbers of victims.
Local governments, offices, factories and schools were charged with gathering evidence about the alleged crimes of targeted individuals (273). These organizations were characterized by ‘insecurity and mutual suspicion’, leading the whole campaign ‘through an unplanned escalation process’ (275–76). So individual leader discretion, rather than systematic factors, largely determined local levels of violence. This helps ease a concern that some structural variables, such as prior political support for the party or the severity of the Great Famine, affected the level of violence. As I will show later, these structural factors are not correlated with levels of violence.
The violence started to fade after 1969 when Mao ordered the PLA to re-establish order and to send the Red Guards to remote rural areas. In 1971, after the death of the radical military leader Lin Biao, the country started to recover from the political chaos and economic stagnation. The Cultural Revolution ended in 1976 when Mao died and the movement's radical leaders – the ‘Gang of Four’ – were arrested.
Theoretical Expectations
Goldstein (Reference Goldstein1978) proposed a common definition of state repression, which was later adopted by Davenport (Reference Davenport2007, 2). By most accounts, state repression ‘involves the actual or threatened use of physical sanctions against an individual or organization, within the territorial jurisdiction of the state, for the purpose of imposing a cost on the target as well as deterring specific activities and/or beliefs perceived to be challenging to government personnel, practices or institutions’ (Goldstein Reference Goldstein1978, xxvii) (emphasis added). But can state repression achieve these goals – deterring activities and beliefs – in the long run?
Political consequences of violence
A vast literature has examined the effects of wartime violence on attitudes and behavior (Balcells Reference Balcells2012; Beber, Roessler and Scacco Reference Beber, Roessler and Scacco2014; Bellows and Miguel Reference Bellows and Miguel2009; Blattman Reference Blattman2009; Fearon, Humphreys and Weinstein Reference Fearon, Humphreys and Weinstein2009; Gilligan, Pasquale and Samii Reference Gilligan, Pasquale and Samii2014; Grossman, Manekin and Miodownik Reference Grossman, Manekin and Miodownik2015; Hou and Quek Reference Hou and Quek2019). While many of these studies’ findings are contradictory, there is an emerging consensus that violence can enhance solidarity within the victims’ communities and increase hostility toward the out-group, especially the perpetrator(s). This is consistent with a recent meta-analysis by Bauer et al. (Reference Bauer2016), which shows that exposure to wartime violence increases prosocial behavior, although such behavior is usually biased toward in-groups. While most of these studies focus on short-term effects, one exception is Balcells (Reference Balcells2012), who examines the long-term consequences of victimization during the Spanish Civil War. She finds evidence to support her theory that victims and their offspring strongly reject the perpetrator's identity, and hold hostile feelings and attitudes toward social or ethnic groups associated with this group or individual.
Some recent work examines the effect of violence on trust. Nunn and Wantchekon (Reference Nunn and Wantchekon2011) find that individuals whose ethnic groups were heavily raided during the slave trade in Africa have lower levels of interpersonal trust today. De Juan and Pierskalla (Reference De Juan and Pierskalla2016) demonstrate that exposure to violence during Nepal's civil war reduces trust in the national government. Both studies use community-level measures of violence and individual-level measures of trust, and suggest that violence can negatively influence bystanders’ trust in the government and each other.
A more closely related literature focuses on the long-term effects of authoritarian coercion. In 1944, after the Soviet Union recaptured the Crimean Peninsula from Nazi Germany, the Red Army accused all Crimean Tatars of collaborating with the Nazis and deported them to Uzbekistan. Lupu and Peisakhin (Reference Lupu and Peisakhin2017) investigate the long-term consequences of this event, and demonstrate that the violence experienced by direct victims of the deportation induced them to identify more strongly with their ethnic group and made them more hostile toward Russia. Rozenas, Schutte and Zhukov (Reference Rozenas, Schutte and Zhukov2017) argue that repression alienates bystanders as well. Studying Stalin's repression of a nationalist insurgency in Ukraine in the 1940s, they show that communities that were subjected to more deportations during this period are more likely to oppose the contemporary political forces associated with the perpetrators (for example the ‘pro-Russian’ parties). Examining the long-term effects of Stalin's terror, Zhukov and Talibova (Reference Zhukov and Talibova2018) show that communities that were more heavily repressed under Stalin are less likely to vote in Putin's Russia.
One important insight from this line of research is that state repression generates long-lasting resentment of not only the perpetrator, but also the regime and future leaders who are associated with it (from Stalin to Russia to Putin). This notion is supported by studies in psychology and cultural anthropology, which demonstrate that past traumatic experiences can cause individuals to internalize a strategy (trust or distrust) as a heuristic or rule of thumb (Boyd and Richerson Reference Boyd and Richerson2005; Tversky and Kahneman Reference Tversky and Kahneman1974). For example, Tversky and Kahneman (Reference Tversky and Kahneman1974) argue that people rely on a limited number of heuristic principles in order to simplify the complex task of assessing probabilities. One such principle is availability: people evaluate the probability that a future event will occur based on the ease with which instances of previous similar events can be brought to mind. They further show that the more retrievable and the more salient such instances are, the more likely they are to be brought to mind (1127).
Likewise, state repression that causes the deaths of family members, friends, neighbors or other acquaintances can leave a lasting impression on one's memory. If political trust can be defined as ‘the probability … that the political system (or some part of it) will produce preferred outcomes even if left untended’ (Gamson Reference Gamson1968, 54), these events can be easily recalled when one needs to assess that probability. Experiencing these traumatic events leads communities to develop a distrust of political leaders that they use as a rule of thumb to understand their relationship with the authorities in general, even if the parties or individuals change. Although a new leadership may not repress, it still inherits the memory of an earlier leadership that did repress. This pattern is consistent with public opinion research, which shows that political trust of a past leader (or lack thereof) can influence public support for the regime and trust in future leaders (Hetherington Reference Hetherington1998).
Citizens’ attitudes toward the leader and the regime are more intertwined if the leader serves as the face of the regime. Weber (Reference Weber1978 [1922], 215) seminally argued that in the charismatic type of regime legitimacy, popular obedience derives from devotion to the supreme leader. Mao's China is a classic case of charismatic rule: the supreme leader, who restored Chinese sovereignty, firmly linked his personal reputation to the legitimacy of the communist regime (Perry Reference Perry, Rudolph and Szonyi2018, 12). Thus violence during the Cultural Revolution, which undermined Mao's legitimacy, should also undermine the regime's legitimacy. Witnesses of the violence are more likely to reflect on why the regime engages in such repression and to be critical of the country's political institutions.
Victims and bystanders of state repression are therefore expected to become ‘dissidents’, and to develop antagonistic political identities and hostile attitudes toward the regime and its leadership. This dissent is likely to be reflected in their distrust of current political leaders, and their criticism of both the country's political system and the regime's violation of political rights (for example, freedom of expression). I formulate this expectation into the following hypothesis.
Hypothesis 1 Citizens who have been exposed to more state repression are more likely to have political attitudes that are hostile to the state, ceteris paribus.
State repression and contentious behavior
Another literature focuses on the effects of state repression on contentious behavior. The findings suggest that state repression produces a ‘backlash effect’: dissenters react strongly to harsh coercion and take actions to voice their dissent, either by joining a protest (Francisco Reference Francisco1996; Gurr and Lichbach Reference Gurr and Lichbach1986) or voting against the perpetrator (Lupu and Peisakhin Reference Lupu and Peisakhin2017; Rozenas, Schutte and Zhukov Reference Rozenas, Schutte and Zhukov2017). But all studies in this literature have focused on democracies or hybrid regimes after the authoritarian coercive apparatus has collapsed. As Zhukov and Talibova (Reference Zhukov and Talibova2018, 3–4) point out, many of these findings are contingent on the state being unable to sustain high levels of internal repression for long periods of time.
As Kuran (Reference Kuran1991) argues, citizens may have anti-regime views but be too scared to protest if they expect to be persecuted. Rozenas and Zhukov (Reference Rozenas and Zhukov2019) present the first systematic attempt to investigate how the effects of repression vary according to the level of state coercive capacity. In 1932–34, Stalin implemented coercive agricultural policy and a collective punishment campaign in Soviet Ukraine, which caused over 3 million people to starve to death. Using data on eight decades of local political behavior, they find that this act of mass repression inflamed opposition to Moscow, but only in the absence of a renewed threat of violence. When such a threat was present, communities that experienced greater exposure to ‘terror by hunger’ behaved more loyally toward the regime.
The key insight from this literature is that whether repression deters future contentious behavior depends on the extent to which the regime can credibly renew its threat of violence. When the state signals its willingness and ability to impose violence, citizens who were exposed to past repression will take into account the costs of persecution and falsify their preference. Fearing that the same tragedy might happen again, they will curtail their contentious behavior to avoid repression.
Recent work on repression in China shows that state coercion has increased in recent years. Since the violent suppression of the 1989 Tiananmen Square protests, the Chinese domestic security apparatus has dramatically expanded. ‘Stability maintenance’ operations – which are focused on the need to respond to social unrest, primarily through repression – have become a top priority for the Chinese Communist Party (CCP) (Wang and Minzner Reference Wang and Minzner2015). Central leaders have adopted new governance models in which they increased the bureaucratic rank of public security chiefs within the party apparatus, expanded the reach of the party's political–legal apparatus into a broader range of governance issues, and altered cadre evaluation standards to increase local authorities’ sensitivity to potential social instability.
I therefore expect that, in a durable authoritarian state such as China that consistently signals its coercive capacity, citizens will reduce their anti-regime behaviors such as joining a protest, despite having anti-regime attitudes. State repression therefore exerts long-term coercive effects and creates silent dissidents in durable authoritarian regimes. I formulate this expectation into the following hypothesis.
Hypothesis 2 In a durable authoritarian regime, citizens exposed to more state repression are less likely to take actions to challenge the state, such as joining a protest, ceteris paribus.
Long-term legacies
An emerging literature on cultural persistence suggests that historical events not only directly affect the people who experienced them, but also indirectly influence younger generations through internal or external channels. This explains why political identities formed at a particular point in history can endure for decades (Darden and Grzymala-Busse Reference Darden and Grzymala-Busse2006; Wittenberg Reference Wittenberg2006).
Recent work on internal channels identifies the family as the primary locus of value transmission: parents consciously socialize their children to particular identities. In Bisin and Verdier's (Reference Bisin and Verdier2001) theoretical model, parents socialize and transmit their preferences to their offspring, motivated by a form of paternalistic altruism. In the process of intergenerational transmission, parents gain utility by passing their cultural traits to their children (Bisin and Verdier Reference Bisin and Verdier2001, 302–305). Similarly, Tabellini (Reference Tabellini2008b) models how parents rationally choose what values to transmit to their offspring.
Nascent empirical research has provided ample evidence that families are important agents of value transmission. Alesina, Giuliano and Nunn (Reference Alesina, Giuliano and Nunn2013, 55) examine the children of immigrants living in Europe and the United States, and find that those with a heritage of traditional plough use exhibit less equal beliefs about gender roles today. Nunn and Wantchekon (Reference Nunn and Wantchekon2011, 3227) argue that the most important channel through which the slave trade affected trust is via internal norm transmission; they suggest family socialization as a possible mechanism. Acharya, Blackwell and Sen (Reference Acharya, Blackwell and Sen2016, 623) demonstrate that contemporary differences in political attitudes across counties in the American South in part trace their origins to slavery's prevalence more than 150 years ago. They contend that the culture of the Southern Black Belt, including black subjugation, was passed on within white families and across generations. Lupu and Peisakhin (Reference Lupu and Peisakhin2017, 846) argue that victims of violence transmit anti-Russia identities to their offspring. Using a multigenerational survey of Crimean Tatars, they show that political attitudes are correlated across generations within families, and that if younger respondents often discuss the Soviet-era deportation experience with their parents and grandparents, they are more likely to be affected by this historical event.
Cultural change occurs slowly, and the shock created by past events will gradually dissipate. In Alesina and Fuchs-Schündeln's (Reference Alesina and Fuchs-Schündeln2007) study of the effects of the division of Germany between 1945 and 1990 on individuals’ beliefs about the benefits of redistribution and government intervention, they find that East Germans view government intervention more favorably than West Germans, and that since reunification East Germans’ beliefs have begun to slowly converge with those from the West. While this particular shock lasted only forty-five years, the authors estimate that the differences generated by the shock will take 20–40 years to diminish to zero (Alesina and Fuchs-Schündeln Reference Alesina and Fuchs-Schündeln2007, 1512).
I hence expect that the political identities formed during periods of state repression will be handed down through generations, creating downstream effects on young people's political attitudes. But these effects will gradually fade over time. Family socialization often takes the form of family discussions of political issues (Jennings and Niemi Reference Jennings and Niemi1968, 182), so intergenerational transmission should be stronger when family members spend more time discussing politics. As a result, although the CCP strictly censors all public discussion of the Cultural Revolution (Lu Reference Lu1994, 537), the younger generation might still be indirectly influenced by the violence through private channels. I formulate these expectations into the following hypotheses.
Hypothesis 3 Younger generations that did not experience state repression can still be affected by it and have hostile political attitudes toward the state. But the indirect influence fades over generations: the younger the respondents, the less likely they are to be influenced by past repression, ceteris paribus.
Hypothesis 4 Family socialization occurs during family discussions of political issues. The more frequently younger people discuss politics with family members who have direct experience of past state repression, the more likely they are to be influenced by it, ceteris paribus.
An alternative (external) channel is that the violence during the 1960s triggered a long-term deterioration of political institutions, which in turn led to mistrust. Indeed, strategic complementarities have been identified between culture and institutions (Tabellini Reference Tabellini2008a). Putnam (Reference Putnam1993, 121–162) empirically shows that the legacy of self-government in northern Italy – an institution – has a long-term effect on political trust. Acharya, Blackwell and Sen (Reference Acharya, Blackwell and Sen2016, 623) maintain that institutions such as Jim Crow laws helped enforce racial segregation, which further shaped current racial attitudes in the US South.
This institutional mechanism would imply that governments that experienced more violent factional fights during the Cultural Revolution might have retained more radicals as bureaucrats, resulting in the destruction of many rules and norms. Citizens who live under these bad institutions develop hostile attitudes toward their political authorities, but are less likely to engage in contentious behavior due to the renewed threat of persecution. However, Deng Xiaoping's personnel reform in the 1980s likely weakened this channel. He gradually pushed for the retirement and exit of many Cultural Revolution radicals and replaced them with young, professional bureaucrats, so there has been a nearly complete turnover of government personnel since the Cultural Revolution (Manion Reference Manion1993). I formally test this alternative mechanism by examining a subset of the sample that moved to their current localities as adults. Note that this is a different sample from the main analysis, which focuses on natives who grew up in these prefectures and were exposed to the violence directly or indirectly through their parents. By contrast, new residents have only been exposed to the institutions that might have been affected by the violence. I formulate this external channel into the following hypothesis.
Hypothesis 5 If past violence affects current attitudes and behavior through a deterioration of political institutions, we should expect new residents who are exposed to the institutions (but not to the violence) to be affected by the violence, ceteris paribus.
Empirics
This section introduces the dataset and the main empirical results. I start by exploring possible explanations of the violence during the Cultural Revolution, but my results show that none of the historical and geographic variables can predict violence, indicating that the repression was indiscriminate and determined by local, idiosyncratic factors. I then present my main results: repression increases hostile attitudes but decreases contentious behavior. These results are highly robust to a variety of checks and an IV strategy. I also present suggestive evidence that supports my proposed transmission mechanism (that family socialization extends the effects of repression to younger generations) and evidence against the external, institutional mechanism.
Data
I use a dataset compiled by Walder (Reference Walder2014) that tracks variation in levels of violence during the Cultural Revolution.Footnote 5 Walder (Reference Walder2014) uses local annals published in the reform era to code the number of deaths from June 1966 to December 1971 for 2,213 jurisdictions (prefectures, cities and counties).Footnote 6
The dataset has two potential measurement errors. First, the rules for counting deaths were conservative: local governments might have had an incentive to under-report the number of casualties to obscure the extent of this dark period of history. But the annals were compiled under a new national leadership that strived to differentiate itself from Mao. Most of the local leaders who were responsible for compiling these annals were purged during the Cultural Revolution and rehabilitated only after Mao died (Manion Reference Manion1993, 45–76). So they might have had some incentive to tell the truth. Even if they under-reported the number of deaths, this will only create a downward bias for my estimates and make me less likely to find any results. I also use an IV approach to deal with the potential measurement error and show that my results are similar. The second potential measurement error is that the annals’ publication was coordinated at the provincial level, so the between-province variation in deaths is accounted for not only by the actual death tolls but also by the format and reporting efforts of local annals. In all of my analyses I therefore control for provincial fixed effects, so any estimate is the within-province effect of violence. I also control for the number of words that each annal devoted to the Cultural Revolution in all analyses to account for variation in reporting efforts.
The independent variable
The key independent variable is Number of Deaths/1,000 measured at the prefectural level. As Walder (Reference Walder2014) shows, the vast majority of the deaths were caused by state repression. One might instead argue that many deaths were caused by intra-community violence, such as children betraying parents, and even spouses denouncing and attacking each other. This type of violence, similar to the communal violence in urban Kenya as described by Kasara (Reference Kasara2017) and intra-ethnic violence in Africa during the slave trade (Nunn and Wantchekon Reference Nunn and Wantchekon2011), might have affected political trust as well as interpersonal trust. But as Walder (Reference Walder2014) shows, very few deaths were caused by citizens attacking each other. To test this assumption, I regress measures of interpersonal trust on Number of Deaths/1,000 and find a positive (but unstable) effect on generalized trust and trust of family and relatives, suggesting that people who lived in violent localities relied on their family for support and rescue during the chaos (Appendix Table 2.2). This finding is consistent with other studies that have found an in-group bias in social behavior after violence.
I aggregate the number of deaths at the county level to the prefectural level, because data on some of the covariates are available only at the prefectural level. But I show in the robustness checks that using county-level data yields the same results. The resulting dataset includes 277 prefectures (94.5 per cent of all prefectures) across 29 provinces (93.5 per cent of all provinces), and most of the missing prefectures are in Tibet and Qinghai, where local annals were less systematically published. Number of Deaths/1,000 ranges from 0 to 22.57 (mean = 0.51).Footnote 7
Figure 1 shows the regional distribution of violence during 1966–71: the violence was concentrated in the Northwest, such as Inner Mongolia and Shaanxi, and in the Southwest, including Guangxi. But these patterns cannot be overgeneralized because the between-province variation is largely caused by different reporting rules in local annals. We should instead pay attention to the within-province variation, which is the focus of the empirical analysis. The map also shows the spatial clustering of violence, indicating that violence may have a spatial spillover effect (that is, neighboring cities’ violence affects trust). I later show that my results remain the same when I include a spatial lag to account for this effect.
The number of deaths per 1,000 people across Chinese prefectures (1966–71)
Note: the map shows the regional distribution of violence during the first half of the Cultural Revolution measured by the number of deaths per 1,000 people. The data are from Walder (Reference Walder2014).

Correlates of violence
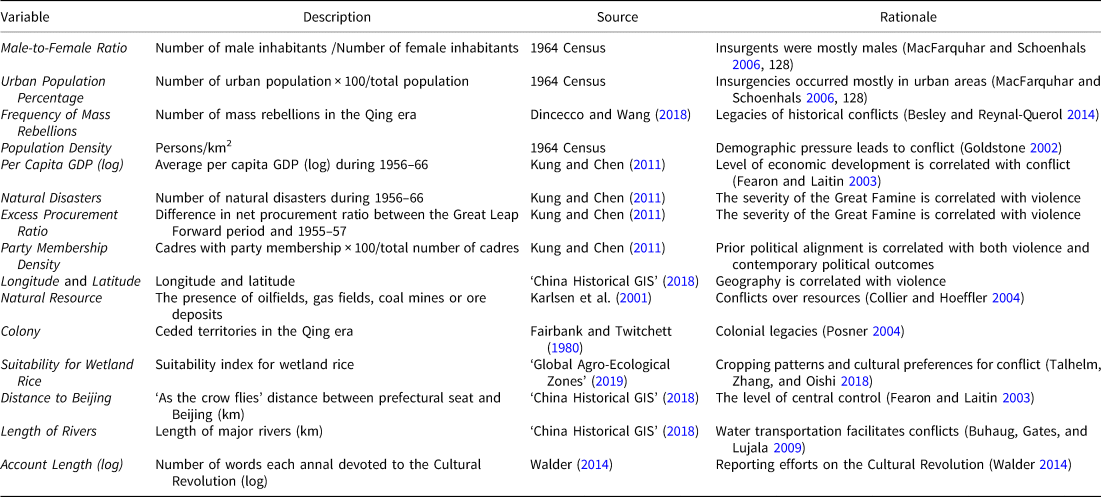
To explore local variation, I first examine whether some historical and geographic factors systematically predict levels of violence. If any of these variables can explain the violence, then the repression was not randomly distributed, which creates threats to my inference. Table 1 describes a wide range of pre-Cultural Revolution factors that might be correlated with violence.Footnote 8
Description of pre-Cultural Revolution covariates

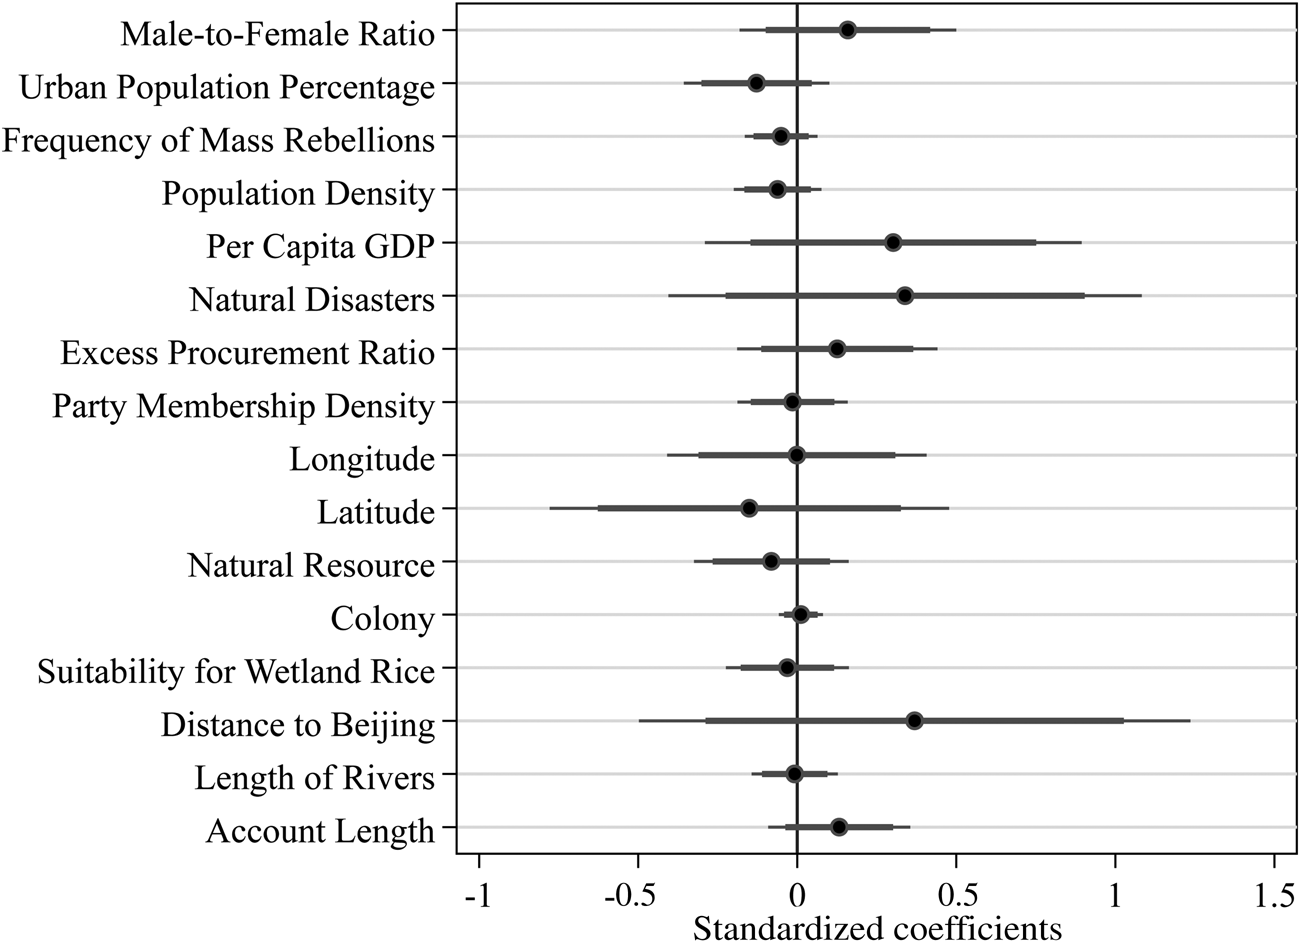
Figure 2 shows the ordinary least squares (OLS) estimates of the effects of these historical and geographic variables on Number of Deaths/1,000, including all 277 prefectures. None of these variables significantly explains the violence across prefectures. In particular, Party Member Density in 1956–66 did not affect state repression in the late 1960s, suggesting that the violence did not target areas with more disloyal citizens. These quantitative results are consistent with the qualitative evidence discussed earlier, which indicates that local leaders exercised considerable discretion in carrying out the repression, so idiosyncratic and leader-specific (rather than systematic) factors explain the violence (MacFarquhar and Schoenhals Reference MacFarquhar and Schoenhals2006; Su Reference Su2011; Walder Reference Walder2015).
Determinants of Cultural Revolution violence across Chinese prefectures (1966–71)
Note: this coefficient plot shows the OLS estimates of the effects of historical and geographic variables on Number of Deaths/1,000 at the prefectural level. The dots represent the standardized coefficients, and the bars 95 per cent and 99 per cent confidence intervals. The regression clusters standard errors at the prefectural level and includes provincial fixed effects. Appendix Table 2.3 presents the full results.

The dependent variables
To measure political attitudes and behavior, I use data from the China Survey – a national probability sample survey that was designed by a group of leading survey researchers, coordinated by Texas A&M University and implemented by the Research Center for Contemporary China at Peking University in 2008. The survey used a spatial sampling technique (Landry and Shen Reference Landry and Shen2005) to randomly draw a sample of 3,989 adults across China's fifty-nine prefectures and twenty-five provinces.Footnote 9
I use three variables to measure political attitudes toward the state (distributions presented in Appendix Table 1.1). The first is Trust in Central Leaders. The survey asks respondents how much they trust central leaders on a scale from 1 (not at all) to 4 (very much). The second and third variables measure people's attitudes toward the regime. Democracy and Freedom of Expression are based on survey questions that ask respondents to what extent they believe that China lacks democracy and freedom of expression, respectively, scaled from 0 (not at all) to 10 (severely lacks democracy). Consistent with previous works that show a high level of trust in the center (Li Reference Li2004, Li Reference Li2016), almost 90 per cent of the respondents reported that they trust the central leaders ‘somewhat’ or ‘very much’. This makes the remaining 10 per cent more interesting and worth exploring. Since there are some missing values created by ‘don't know’ or item non-response, I use listwise deletion in the main analyses and will use multiple imputation in the robustness checks to show that the results are similar.
I use Protest to measure contentious behavior. The survey asks respondents whether they have ever joined a protest, sit-in or demonstration (5 = ‘did it last year’, 4 = ‘did it earlier’, 3 = ‘did it earlier but never will again’, 2 = ‘never did but probably will’, 1 = ‘never did and never will’).Footnote 10 Because my theoretical predication is that people who were exposed to repression are less likely to participate in a protest, both in the past and in the future, I need to construct an indicator for people who have participated in a protest before and would not hesitate to participate in the future. I therefore code this new variable by coding responses 4 and 5 as 1, and 1–3 as 0, so this dummy variable indicates a general willingness to participate in a protest.Footnote 11
While these attitudinal and behavioral measures are subject to social and political desirability bias, the direction of the bias is unclear. They might under-report their anti-regime attitudes and behavior due to political fear (Jiang and Yang Reference Jiang and Yang2016), or over-report them in order to impress the surveyor. A recent experimental study finds that political desirability bias is very low among Chinese survey respondents (Tang Reference Tang2016, 134–51). Another study shows that people who were exposed to more political violence in authoritarian regimes, and hence are more fearful of government repression, are more likely to over-report their support for the regime (Garcia-Ponce and Pasquale Reference Garcia-Ponce and Pasquale2015). This upward bias only makes it less likely to find a negative effect of violence on pro-regime attitudes. The more worrisome problem is the possible downward bias of repression's effects on reported contentious behavior: people might under-report their anti-government behavior due to fear of persecution. Although this downward bias somehow confirms repression's ‘coercive effects’ (on honest reporting in surveys), it makes me more likely to find that repression has coercive effects on self-reported contentious behavior. I acknowledge this issue and exercise caution in interpreting the results on behavior.
The covariates
I also consider several covariates. At the individual level, I code Male, Age, Age Squared and Ethic Han. The China Survey also asks respondents about their families’ Class backgrounds, as defined by the Chinese government in the early 1950s. Class can serve as a proxy for the family's political identity before the Cultural Revolution, because class labeling was the primary way for the regime to distinguish between regime supporters and enemies (Unger Reference Unger1982). Following Deng and Treiman (Reference Deng and Treiman1997), I code Good Class to include hired peasants, poor peasants, lower-middle peasants, urban poor and workers; Middle Class to include middle peasants, upper-middle peasants, clerks and petty merchants; and Bad Class to include rich peasants, landlords and capitalists. Note that these individual-level covariates are either measured pre-treatment or are not likely to be altered by violence during the Cultural Revolution, so including them will not introduce post-treatment bias. At the prefectural level, I consider all the covariates in Table 1. Similarly, all of them were measured before the Cultural Revolution to avoid post-treatment bias. Although they do not explain Cultural Revolution violence (Figure 2), they might have an effect on current political attitudes and behavior.
In every regression, I include Account Length (log) and provincial fixed effects, so the estimates reflect the within-province effects of Cultural Revolution violence. Appendix Table 2.1 presents all variables’ sources and summary statistics.
Ordinary Least Squares Estimates
I now estimate the effects of violence during the Cultural Revolution on people's political attitudes and behavior. Because my theory focuses on people's exposure to the Cultural Revolution, I include only the subset (61.6 per cent) of the sample that grew up in the localities where they took the survey; I exclude those who moved to their current area after they turned eighteen. Later I focus on these new residents to test an alternative mechanism. In my main analysis, I use OLS to fit Equation 1 to a cross-section data file that mixes prefectural- and individual-level variables, and cluster standard errors at the treatment (prefectural) level to avoid overstating the precision of my estimation. Combining measures of community-level violence and individual-level outcomes is a standard practice in the literature (Nunn and Wantchekon Reference Nunn and Wantchekon2011). In the robustness checks, I also use hierarchical linear modeling (HLM) as an alternative estimation strategy, and show that the results are similar. My baseline estimation equation is:
 $$Y_{ij} = \alpha _{ij} + \beta \,{\rm Number}\;{\rm of}\;{\rm Deaths}/1,000_j + {\bi {X}^{\prime}}_{{\bi ij}}{\rm \Gamma} + {\bi {X}^{\prime}}_{\bi j}{\rm \Omega} + \epsilon_{ij},$$
Where i indexes individuals and j prefectures. Y ij denotes one of the four outcome variables: Trust in Central Leaders, Democracy, Freedom of Expression or Protest. Number of Deaths/1,000 j is a measure of the number of ‘unnatural deaths’ per 1,000 inhabitants during 1966–71 at the prefectural level. β is the quantity of interest measuring the effect of violence. The vector Xij denotes a set of individual-level covariates, including Male, Age, Age Squared, Ethic Han, Good Class and Middle Class (Bad Class is the reference group). The vector Xj denotes a set of prefectural-level covariates, including Male-to-Female Ratio, Urban Population Percentage, Frequency of Mass Rebellions, Population Density, Per Capita GDP (log), Natural Disasters, Excess Procurement Ratio, Party Member Density, Longitude, Latitude, Natural Resource, Colony, Suitability for Wetland Rice, Distance to Beijing and Length of Rivers. Every regression also controls for Account Length (log) and provincial fixed effects.
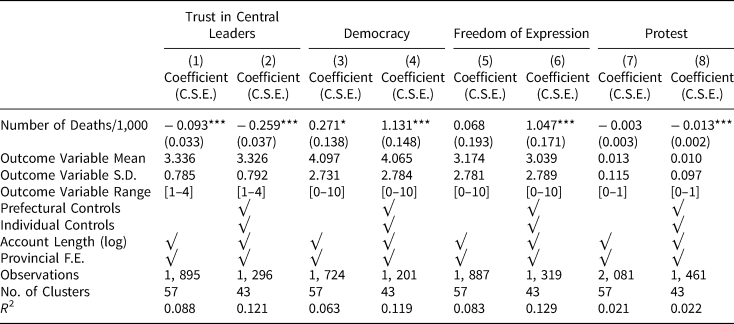
Table 2 presents the results.Footnote 12 To avoid any biases introduced by covariates, I first exclude all prefectural- and individual-level covariates and add them later. Consistent with Hypothesis 1, respondents who grew up in localities that experienced more violence during the Cultural Revolution have lower levels of trust in central leaders, and are more critical of China's lack of democracy and freedom of expression. Adding prefectural- and individual-level covariates strengthens these estimates. The magnitude of the effects is striking. Interpreting the estimates in the full models, relative to the full range of the outcome variables, one more death per 1,000 people in 1966–71 leads to 6.48 per cent less trust in central leaders, 11.31 per cent more criticism of the country's lack of democracy and 10.47 per cent more criticism of the country's lack of freedom of expression. The magnitude of the coefficient on political trust is similar to Nunn and Wantchekon's (Reference Nunn and Wantchekon2011, 3233) estimate of the effect of the slave trade on interpersonal trust: the magnitude of the shock caused by one person dying during state repression is comparable to that of one coethnic being sold for slavery.Footnote 13
OLS estimates of the effects of Cultural Revolution violence on political attitudes and behavior

Note: this table presents the OLS estimates of the effects of Cultural Revolution violence on political attitudes and behavior. I restrict the sample to respondents who grew up in their current localities. Number of Deaths/1,000 is a continuous variable measuring the number of ‘unnatural deaths’ per 1,000 people during 1966–71. Prefectural controls include Male-to-Female Ratio, Urban Population Percentage, Frequency of Mass Rebellions, Population Density, Per Capita GDP (log), Natural Disasters, Excess Procurement Ratio, Party Member Density, Longitude, Latitude, Natural Resource, Colony, Suitability for Wetland Rice, Distance to Beijing and Length of Rivers. Individual controls include Male, Age, Age Squared, Ethic Han, Good Class and Middle Class (Bad Class is the reference group). Columns 1, 3 and 5 present the results without prefectural- and individual-level controls, and the remaining columns present results with these controls. All specifications include Account Length (log) and provincial fixed effects. Standard errors clustered at the prefectural level are presented in parentheses. Appendix Table 3.1 presents the full results including coefficients and standard errors of all of the covariates. *p < 0.1, **p < 0.05, ***p < 0.01 (two-tailed)
I also find that state repression has a negative effect on protest behavior (Hypothesis 2). The coefficient is negative but not statistically significant (p = 0.30) without prefectural and individual controls (Column 7), but becomes significant once these controls are included (Column 8). Based on the full model, one more death per 1,000 people in 1966–71 makes people 1.3 per cent less likely to participate in a protest. This finding is in contrast to the ‘backlash effect’ of repression found in regimes that have experienced a transition. However, I caution against overinterpreting the results. In one possible scenario, respondents who were exposed to violence have a higher level of actual contentious behavior, but they under-report their behavior due to political fear. This indicates that state repression can increase contentious behavior but suppress honest reporting in surveys (another kind of ‘coercive effect’). In another scenario, respondents who were exposed to violence have a low level of both actual and self-reported contentious behavior, which confirms the ‘coercive effects’ of state repression. I cannot differentiate between these scenarios using the observational data, and thus flag the evidence as merely suggestive. Future research, using list or endorsement experiments, can investigate this issue.
These results are highly robust according to eight robustness checks: I exclude people who were sent down to the countryside (and were thus not only affected by the violence in their hometowns), run the analyses using a county-level dataset, employ HLM, drop one prefecture at a time, use multiple imputations to deal with missing values, transform the independent variable into a natural log-transformed variable (log((Number of Deaths/1,000) + 1)) to tackle its skewness, consider survey design effects and include a spatial lag to consider the spatial spillover effect of violence. None of these checks changes my original results (Appendix Section IV).
Instrumental Variable Estimates
So far, I have established a strong and robust correlation between exposure to violence and anti-regime political attitudes and behavior, but the relationship might be spurious. The biggest challenge to inference is omitted variable bias – that is, that some unobservable factors before the Cultural Revolution affected both the violence and the change in political attitudes and behavior. Although I have controlled for historical levels of regime support (proxied by Party Member Density at the prefectural level and Class at the individual level), I might have overlooked some unobservables. And because the data are historical, there might be measurement errors. In the following analyses, I use an IV approach to show that omitted variables and measurement errors are unlikely to bias my estimates.
An ideal instrument should be a strong, exogenous predictor of Number of Deaths/1,000. To meet the exclusion restriction, the instrument should also affect political attitudes and behavior only through its effect on Cultural Revolution violence. I must therefore find an exogenous variable (specific to the Cultural Revolution) that affected violence. I use the average distance between a prefecture's seat and the nearest sulfur mines to instrument for levels of Cultural Revolution violence. Below I demonstrate that this measure is a strong and exogenous predictor of Number of Deaths/1,000, and that it affects contemporary political attitudes and behavior only through its effect on Cultural Revolution violence.
The rationale for the instrument is based on the qualitative evidence that, in the early stages of the Cultural Revolution, the People's Liberation Army (PLA) dispatched troops to guard important military installments, especially arms manufacturing plants, to prevent civilians from seizing weapons. The PLA needed to maintain security and some semblance of law and order to insulate these localities from the factional fights. So the extent of PLA presence, determined by the locations of arms manufacturing plants, to a large degree determined the level of violence.
As MacFarquhar and Schoenhals (Reference MacFarquhar and Schoenhals2006, 175) argue, ‘the PLA's behavior became the most powerful factor in shaping the further course of the Cultural Revolution’. The PLA played a crucial role in keeping the peace in two ways. First, it was instructed to restrain both local governments and the masses. Because most of the violence happened when local revolutionary committees suppressed their ‘enemies’, the PLA was specifically ordered to constrain any attempts to ‘resolve “contradiction among the people” with methods designed to deal with “the enemy”’ (176). Where there was a PLA presence, the insurgents were less likely to attack the government, and the government was less likely to use force to repress the masses (176). Walder (Reference Walder2015, 243–44) shows that Mao and the Cultural Revolution leadership strongly supported military intervention, and ‘[the] actions of the military to defend approved new organs of power in Shanghai, Heilongjiang, and elsewhere were deemed entirely legitimate, even essential’. And because the army units were ordered to restrain their use of fire, their intervention only decreased the death toll (244).
Secondly, Mao relied on the PLA to maintain his grip on power. He therefore wanted to insulate it from ‘the disruption among the civilian population’ by postponing Cultural Revolution actions in military regions until after they were concluded in civilian areas (MacFarquhar and Schoenhals Reference MacFarquhar and Schoenhals2006, 177). The PLA was thus ordered to impose law and order in areas it controlled. A January 1967 order from the Military Affairs Commission – the highest military leadership body – ‘explicitly forbade all attempts to “assault” key military installations’ (176).Footnote 14 This order seemed to be strictly enforced: in Sichuan, when rebels tried to seize the Chengdu military headquarters, ‘tens of thousands were arrested’ (Walder Reference Walder2015, 243). And the rebels who resisted military control ‘suffered arrests, and had their organizations banned’ (247). The army then ‘proceeded to stabilize public order and restore production’ by setting up production teams in factories, and relying on party and trade union organizations (247).
We should therefore expect prefectures with arms manufacturing plants to experience fewer deaths. Although the locations of such plants are classified, it is intuitive to assume that the PLA located them close to raw materials. To make gunpowder – an important component of all ammunition – three ingredients are needed: saltpeter, charcoal and sulfur. Saltpeter and charcoal can be manufactured; sulfur must be extracted from natural minerals. Sulfur primarily exists in three forms: native sulfur, iron sulfide associated minerals and iron sulfide. I calculate Average Distance to Sulfur Mines (log), which is the natural log-transformed average distance (in km) from a prefecture's seat to its nearest native sulfur mine, iron sulfide associated minerals mine or iron sulfide mine, and use it as an instrument.Footnote 15 The distance measure is motivated by the rationale that the manufacturing plants were located close to sulfur mines to minimize transportation costs. An alternative measure is the presence of any sulfur mine within the prefecture. I show that I can obtain similar results using this alternative IV.Footnote 16
Although I do not have systematic data on the locations of PLA plants to offer direct evidence, there is qualitative evidence confirming that the plants were located near sulfur mines. For example, according to the Liaoning Provincial Gazetteer, the Fengtian Arms Plant (which was renamed the Northeastern Arms Plant after 1949), the largest ammunition factory in northeast China, was located close to iron sulfide mines to save on transportation costs (Liaoning 1999). Peng Dehuai, one of the founders of the PLA, suggested to Mao Zedong in 1939 that the PLA should take advantage of the rich reservoir of sulfur in southeast Shanxi to establish arms manufacturing plants.Footnote 17 The Huangyadong plant, the biggest PLA plant during the war era, was later established in Changzhi County in Shanxi Province. Appendix Figure 5.1 shows the geographic locations of sulfur mines.
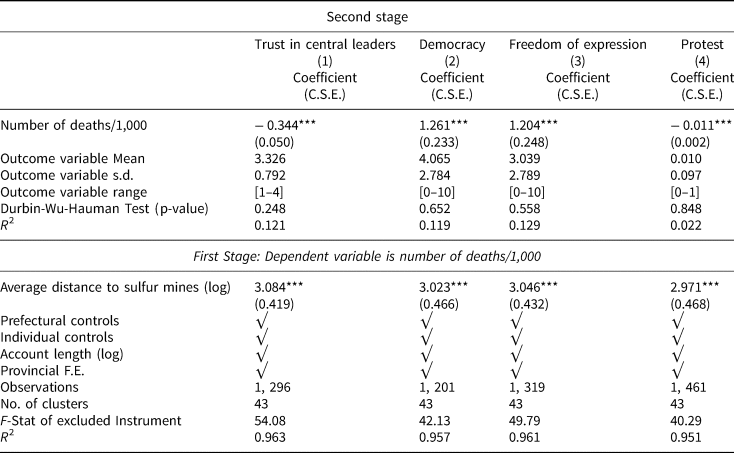
Average Distance to Sulfur Mines (log) has strong first-stage qualities. As shown in Appendix Figure 5.2, Average Distance to Sulfur Mines (log) is a strong and positive predictor of Number of Deaths/1,000. In addition, as the bottom panel in Table 3 confirms, Average Distance to Sulfur Mines (log) is a strong instrument: the first stage yields large F statistics ranging from 40.29 to 54.08, which far exceeds the standard critical value of 10 required to avoid weak instrument bias.
IV estimates of the effects of Cultural Revolution violence on political attitudes and behavior

Note: this table presents the two-stage least-squares estimates of the effects of Cultural Revolution violence on political attitudes and behavior. The upper panel presents the second-stage results, while the bottom panel presents the first-stage results. I restrict the sample to respondents who grew up in their current localities. Number of Deaths/1,000 is a continuous variable measuring the number of unnatural deaths per 1,000 people during 1966–71. Average Distance to Sulfur Mines (log) is the excluded instrument that measures the natural log-transformed average distance between a prefecture and its nearest native sulfur mine, iron sulfide associated minerals mine or iron sulfide mine. Prefectural controls include Male-to-Female Ratio, Urban Population Percentage, Frequency of Mass Rebellions, Population Density, Per Capita GDP (log), Natural Disasters, Excess Procurement Ratio, Party Member Density, Longitude, Latitude, Natural Resource, Colony, Suitability for Wetland Rice, Distance to Beijing and Length of Rivers. Individual controls include Male, Age, Age Squared, Ethic Han, Good Class and Middle Class (Bad Class is the reference group). All specifications include Account Length (log) and provincial fixed effects. Standard errors clustered at the prefectural level are presented in parentheses. Appendix Tables 5.3–5.4 present the full results including the coefficients and standard errors of all of the covariates. *p < 0.1, **p < 0.05, ***p < 0.01 (two-tailed)
To satisfy the exclusion restriction, Average Distance to Sulfur Mines (log) should affect current political attitudes and behavior only through its effect on Cultural Revolution violence. Because seizing weapons from the PLA was a phenomenon that was specific to the Cultural Revolution and no longer occurs, we should not expect the locations of plants to influence current political variables through other channels. In the Appendix, I discuss several possible violations of the exclusion restriction and compare the results to these violations (Appendix Tables 5.1–5.2).
The top panel in Table 3 shows the second-stage results.Footnote 18 The IV estimates are remarkably similar to the OLS estimates. In fact, the Durbin-Wu-Hauman test cannot reject the null hypothesis of the consistency of the OLS estimates at the 0.1 level in any of the specifications. These results suggest that selection on unobservables is not strongly biasing the OLS estimates.
Indirect Effects through Family Socialization
So far, my analysis has lumped together respondents from different generations. The older generation that had direct experience of the Cultural Revolution formed its political identities during that time; these individuals’ political attitudes and behavior have persisted since then. But younger people who did not directly experience the violence can also develop anti-perpetrator attitudes due to family socialization (Lupu and Peisakhin Reference Lupu and Peisakhin2017). I provide evidence below that Cultural Revolution violence has also alienated the younger generation, which inherited its attitudes from family members who were directly exposed to the violence.
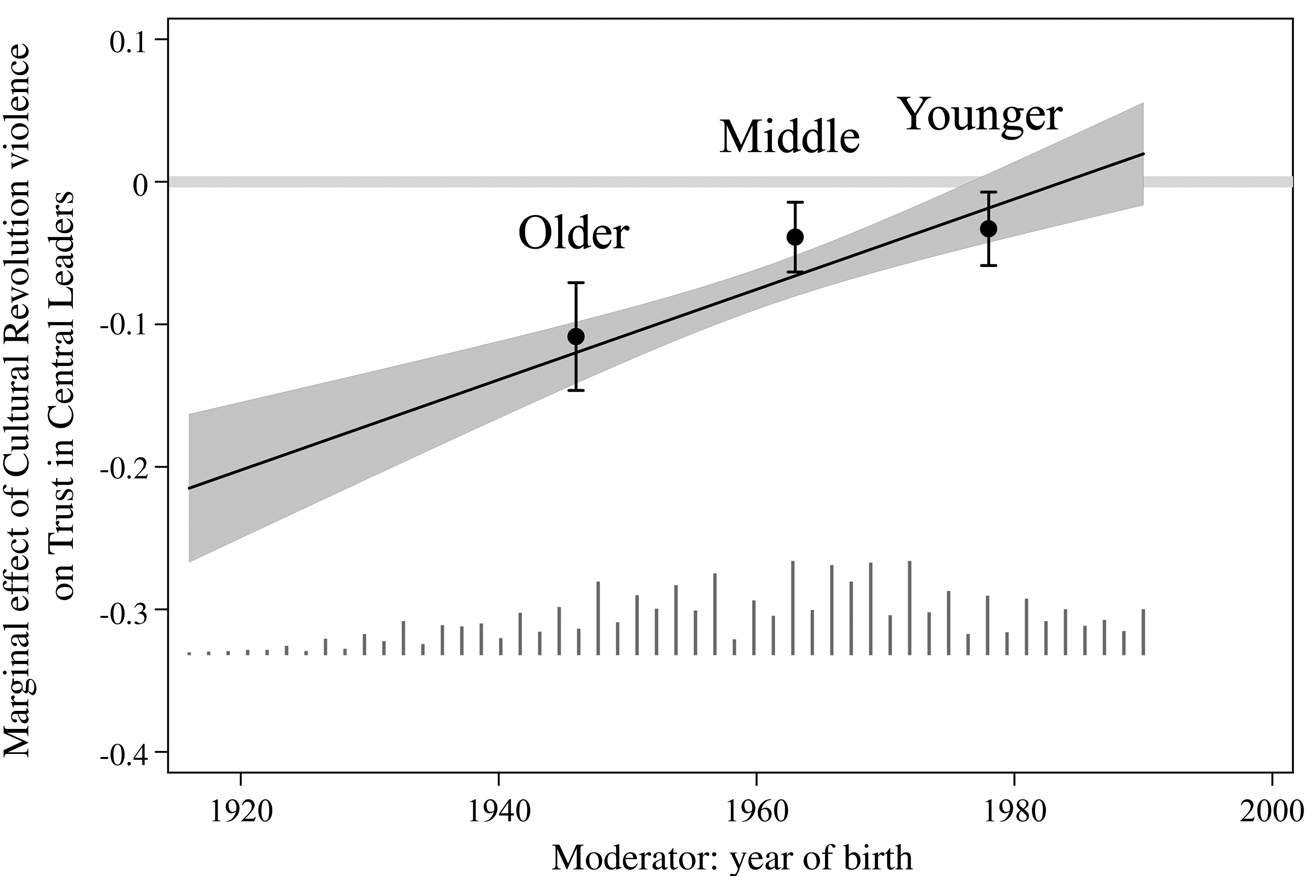
To test Hypothesis 3, I interact respondents’ year of birth with Number of Deaths/1,000 to estimate the marginal effect of Cultural Revolution violence across different generations. I estimate this interaction model following Hainmueller, Mummolo and Xu (Reference Hainmueller, Mummolo and Xu2019), who propose the current best-practice method and a more flexible approach, which does not rely on a linear interaction effect and can reliably estimate the conditional effects of the independent variable at values of the moderator that have sufficient common support. Using a (data-driven) binning estimator to divide the respondents into three generations based on their year of birth, Figure 3 shows the estimates of the marginal effect of Cultural Revolution violence on Trust in Central Leaders across generations.
The marginal effects of Cultural Revolution violence on trust in central leaders across three generations
Note: the plot presents estimates of the marginal effects of Number of Deaths/1,000 on Trust in Central Leaders across three generations. The X-axis indicates the respondent's year of birth. The Y-axis shows the OLS estimate of the effect of Number of Deaths/1,000 on Trust in Central Leaders, controlling for Account Length (log) and provincial fixed effects. The black dots indicate the point estimates, and bars the 95 per cent confidence intervals based on standard errors clustered at the prefectural level. I conduct the estimation and graphic analysis using the interflex package in Stata. Appendix Table 6.1 shows the estimates.

Figure 3 shows that violence decreases levels of trust for all three generations, but the marginal effect is smaller for the younger generations. For older citizens who were born in the 1940s and hence had direct experience of the Cultural Revolution, every death per 1,000 decreases their trust by 0.109 (clustered s.e. = 0.019). For the middle generation, which was born in the early 1960s and grew up during the Cultural Revolution, every death per 1,000 decreases their trust by 0.039 (clustered s.e. = 0.012). For the younger generation that was born in the late 1970s and did not experience the Cultural Revolution, every death per 1,000 decreases their trust by 0.033 (clustered s.e. = 0.013). Note that the point estimates for the middle and younger generations are similar, indicating that there is a strong effect for those who directly experienced violence but a much weaker effect for all later generations. This suggests that the effect of family socialization is homogenous, regardless of generations.Footnote 19
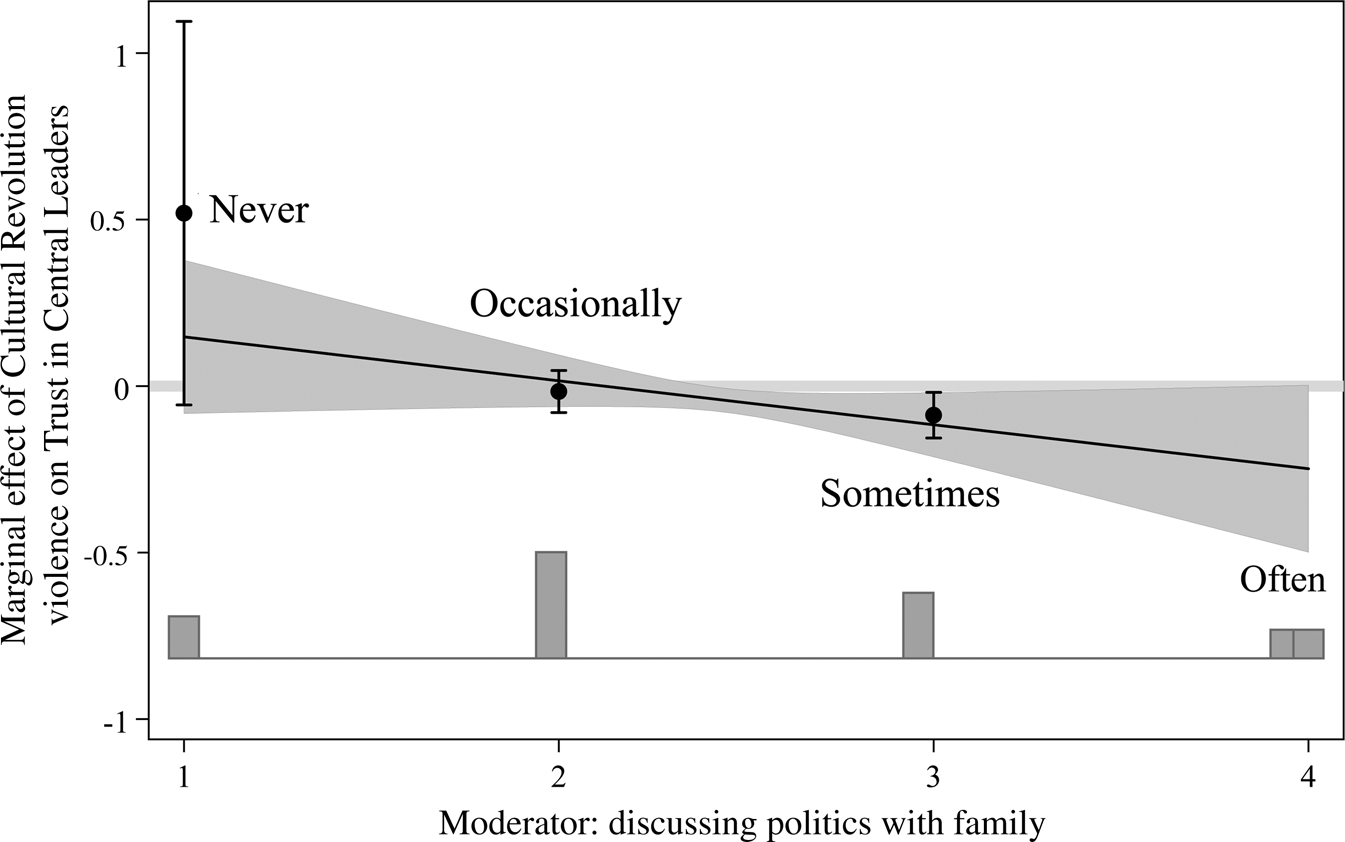
To evaluate Hypothesis 4, I examine why younger generations are affected by historical violence. Prior studies suggest that parents may directly transmit specific political attitudes to their children (Bisin and Verdier Reference Bisin and Verdier2001; Lupu and Peisakhin Reference Lupu and Peisakhin2017). Because the China Survey did not interview different generations within the same household, I cannot provide direct evidence of intergenerational transmission. I instead use a survey question about how frequently respondents discuss political issues with their family members (1 = never; 4 = often) (Discussing Politics with Family) to proxy for family socialization. This measurement is imperfect for two reasons. First, we do not know who they consider to be their family members, or whether their discussions involved experiences during the Cultural Revolution. Secondly, the measure is post-treatment: the level of state repression can determine the extent to which people feel comfortable discussing political issues with their family.Footnote 20 This is a challenge for all studies that examine intergenerational transmission (see a discussion in Lupu and Peisakhin (Reference Lupu and Peisakhin2017, 846)).
I thus estimate a model with an interaction term between Discussing Politics with Family and Number of Deaths/1,000. I restrict my sample to respondents who were born after 1976, and expect younger respondents who discuss politics more frequently with their family to be more likely to be (indirectly) affected by past violence.
Figure 4 presents the marginal effects of Number of Deaths/1,000 on Trust in Central Leaders at different levels of Discussing Politics with Family. As shown, violence has a positive and insignificant (beta = 0.519, clustered s.e. = 0.294) effect on respondents who never discuss political issues with their families. For respondents who occasionally discuss political issues with their families, the effect of violence is close to zero (beta = −0.016, clustered s.e. = 0.032). But for respondents who sometimes discuss politics with their families, Cultural Revolution violence significantly decreases their trust in central leaders. Every death per 1,000 leads to a 0.087 (clustered s.e. = 0.035) decrease in trust. For respondents who often discuss political issues with their families, there are insufficient data to estimate the marginal effect, but the linear extrapolation (indicated by the line and its shaded confidence interval) indicates a more negative effect than for those who sometimes discuss these issues.Footnote 21
The marginal effects of Cultural Revolution violence on trust in central leaders, by frequency of political discussions with family
Note: the plot presents the estimates of the marginal effects of Number of Deaths/1,000 on Trust in Central Leaders at different levels of Discussing Politics with Family. The X-axis indicates the frequency with which the respondents discuss political issues with their family members: 1 = never, 2 = occasionally, 3 = sometimes and 4 = often. The Y-axis presents the OLS estimates of the effect of Number of Deaths/1,000 on Trust in Central Leaders, controlling for Account Length (log) and provincial fixed effects. The black dots indicate the point estimates, and bars the 95 per cent confidence intervals based on standard errors clustered at the prefectural level. I conduct the estimation and graphic analysis using the interflex package in Stata. Appendix Table 6.2 shows the estimates.

In sum, the evidence is consistent with Hypotheses 3 and 4: past state repression can indirectly affect a generation that did not experience the repression, and younger generations obtain their political attitudes through family socialization.
Deterioration of Political Institutions
An alternative, external mechanism might also be at work: the chaos and violence during the Cultural Revolution have caused a long-term deterioration in political institutions. As discussed above, Deng Xiaoping's personnel reform in the 1980s, which replaced local bureaucrats, weakened this channel (Manion Reference Manion1993). To empirically test this alternative mechanism, I focus on people who moved to their current areas as adults. Since these new residents were exposed to the institutions but not the violence, if past violence led to changes in political institutions, we should expect it to also affect new residents.
Appendix Table 6.4 shows the OLS results using the sample of new residents. The estimates are small and mostly insignificant, and the magnitude of the effects is, at best, half of that for local residents. So I do not find sufficient support for Hypothesis 5, that the Cultural Revolution affected current political attitudes and behavior through the deterioration of institutions.
Conclusion
Autocrats frequently employ repressive techniques to consolidate their rule. While state repression can crush the opposition and establish political order in the short term, we know little about its long-term effects in durable authoritarian regimes. My findings highlight the dilemma of using repression to consolidate authoritarian rule: although heavy-handed tactics can eliminate immediate political enemies, it causes bystanders and their descendants to hold hostile attitudes toward the regime for decades.
Political attitudes such as trust have important political consequences. High levels of political trust enable governments to function by encouraging citizens to comply with government demands and regulations (Levi Reference Levi1997; Tyler Reference Tyler1990). Although state repression can produce short-term gains, it can generate long-term costs by creating regime dissenters even after leadership changes. Although these dissenters may be silent, they become more vocal and active during and after a regime change, and they will oppose forces and organizations that are associated with the old regime.
This finding has important implications for authoritarian politics. The subset of the population that does not trust or like the government but is politically demobilized (at least in terms of protest) constitutes a group of silent dissidents. As Rozenas and Zhukov (Reference Rozenas and Zhukov2019) demonstrate using the Soviet case, when the regime sends signals that suggest a weakening in coercive power, these silent dissidents will be easily mobilized to join mass opposition to the regime, leading to regime change. This dynamic might explain why there is often an ‘over-provision’ of coercion in authoritarian regimes even when there are no visible revolutionary threats (Wang and Minzner Reference Wang and Minzner2015). My findings suggest that the mobilization of the silent dissidents ‘off the equilibrium path’ might motivate worried autocrats to double down on coercion.
There is also a popular argument that autocrats use successful policies to counteract the adverse effect of repression and gain public support. For example, many believe that the successful economic reforms in post-Mao China have increased the legitimacy of the CCP, even though many of Mao's policies were disastrous. Yang and Zhao (Reference Yang and Zhao2015, 64–65), for instance, argue that Chinese leaders’ public support lies in ‘the state's capacity to make a policy shift’ to avoid ‘making the disastrous mistakes that the Chinese state repeatedly made during Mao's time’. I, however, show that the scars created by state repression are durable: it has had a long-lasting negative effect on people's political attitudes toward the regime, even though the post-Mao leadership has brought economic success.
Although the study covers over one-fifth of the world's population, I advise against over- or under-generalizing its results to other contexts. On the one hand, China is unique in the sense that it has remained a single-party regime for over sixty years, and because the Cultural Revolution is one of the greatest tragedies in modern history, which makes it difficult to compare the China case with other countries. In many countries that have experienced regime transitions, citizens are faced with a different political opportunity structure; we should therefore expect the long-term coercive effects of repression to vanish (Lupu and Peisakhin Reference Lupu and Peisakhin2017; Rozenas, Schutte and Zhukov Reference Rozenas, Schutte and Zhukov2017). On the other hand, the mechanism of the long-term effects can apply to many other contexts. For example, attitudes toward certain groups of people are highly persistent (Acharya, Blackwell and Sen Reference Acharya, Blackwell and Sen2016; Nunn and Wantchekon Reference Nunn and Wantchekon2011). When people socialize their descendants to particular identities, past traumatic experience should have a long-lasting impact.
Supplementary material
Data replication sets are available in Harvard Dataverse at: https://doi.org/10.7910/DVN/1VWM7S; and online appendices are available at https://doi.org/10.1017/S0007123419000255.
Acknowledgements
I would like to thank Andy Walder for sharing his dataset on Cultural Revolution violence, James Kung and Shuo Chen for sharing their dataset on the Great Famine, and Mingming Shen for sharing the China Survey data. Iza Ding, Xiaobo Lü, Jean Oi, Liz Perry, Arturas Rozenas, Andy Walder, Yiqing Xu, Fei Yan, Boliang Zhu, and panel and seminar participants at APSA 2016, University of Pittsburgh, and New York University Abu Dhabi have provided helpful comments. All errors remain my own.