1. Introduction
In line with most developed countries Ireland saw dramatic improvements in mortality in the 20th century. According to a report from the Central Statistics Office Ireland (CSO, 2009) life expectancy at birth rose by approximately 28 years for males and 32 years for females between 1901 and 2006. For comparison the same report also shows that in the preceding thirty years, between 1871 and 1901, both males and females in Ireland experienced a fall in life expectancy. Mortality improvements were not consistent over the 20th century but varied by age group, gender and cause of death. Extensive research has been carried out on the improvements in mortality witnessed over the 20th century in Europe and beyond. In the actuarial literature Forfar et al. (Reference Forfar and Smith1987) discuss the changing shape of the English Life Tables from 1841 while Griffiths Brock (Reference Griffiths and Brock2003) discuss trends in mortality in England and Wales in the 20th century for all-cause and by broad cause of death category. Goss et al. (Reference Goss, Wade, Bell and Dussault1998) discuss trends in North America and trends in Australia are discussed by AIHW (2005) allowing international comparisons of changes in life expectancy and causes of death over the 20th century. O'Reilly (Reference O'Reilly2006) discusses mortality trends over the 20th century in Northern Ireland while Walsh (Reference Walsh2008) discusses mortality in Ireland between 1972 and 2006. Whelan (Reference Whelan2009a, Reference Whelan2009b) discusses all-cause mortality trends in Ireland from 1950 to 2000 and projects future mortality.
This paper analyses trends in all-cause mortality and by five broad categories of cause of death in Ireland between 1901 and 2006. To place the improvements in mortality in an international context the Irish mortality trends are compared with those in Northern Ireland and England and Wales. Since partition in 1922 Ireland and Northern Ireland are separate countries with different political, economic and healthcare systems. By examining trends in the relative difference or gap in mortality between the two countries since partition an indirect assessment of the impact of these systems on the mortality of the populations of Northern Ireland and Ireland over the 20th century can be made.
The 20th century saw major changes in the primary causes of death. In the early part of the century infectious diseases were the primary cause of death across most age groups in Ireland and the UK but had been replaced by the end of the century by heart disease and cancer. McKeon et al. (Reference McKeon, Record and Turner1975) discuss the reasons for the decline in mortality in England and Wales in the 20th century (1901 to 1971) and attribute three quarters of the reduction to the drop in mortality rates from infectious diseases. They conclude that the main influences on this decline were improved nutrition, better hygiene and to a lesser extent medical advances. A country's mortality will be influenced by its smoking habits – both current and past prevalence rates. According to a report by the World Health Organisation (WHO, 2008) tobacco use is a risk factor in six of the eight leading causes of death in the world. The results of a report by the Continuous Mortality Investigation Bureau of the UK Actuarial Profession (CMI, 2004) on the mortality of insured lives over period 1999 to 2002 showed that smokers were, on average, twice as likely to die as non smokers. Differences in smoking patterns will affect comparisons of mortality rates between countries. A comparison of health and lifestyles in the Republic of Ireland and Northern Ireland (Ward et al. Reference Ward, McGee, Morgan, Van Lente, Layte, Barry, Watson, Shelley and Perry2009), based on population surveys between 2005 and 2007, showed that the Republic of Ireland had a higher percentage of current smokers (29%) compared with Northern Ireland (26%). A report by the Information Centre for the National Heath Service in the UK (NHS, 2006) indicated that the smoking prevalence rate in England in 2004 was 25%. Statistics on historical rates of smoking in Ireland are poor and as a result the analysis of trends in all-cause mortality and by cause of death do not allow for the impact of smoking. However, possible differences in smoking prevalence rates should be borne in mind when comparing results between the countries.
The decline in mortality in Ireland and the UK has continued into the 21st century and continuing improvements in standards of living, healthcare and smoking rates indicate that the decline is likely to continue into the foreseeable future for both countries. In this paper we examine trends in the following five cause of death categories: Infectious diseases, Circulatory diseases, Respiratory Diseases, Cancer, Mental Disorders and External (accidents/violence) causes. However, it must be noted that classification of diseases has changed significantly over the 20th century and care should be taken in interpreting the trends.
This paper examines trends in all-cause mortality and by five broad categories of cause of death in Ireland over the 20th century and early years of the 21st century and compares them with Northern Ireland and England and Wales. The paper is organised as follows: section 2 discusses the data and methods used in the analysis, section 3 examines trends for all-cause mortality trends, section 4 examines trends in the five causes of death while section 5 concludes with a discussion of the results.
2. Data and Methods
Death rates are examined for Ireland for the census years between 1901 and 2006 inclusive. Censuses were held every ten years in the first half of the 20th century and approximately every 5 years thereafter. The 1956 census was excluded as it was only a partial census and also the 1979 census given its proximity to the 1981 census. Separate analyses are carried out for males and females. For Ireland data on deaths by age group and gender and cause of death by age group and gender were obtained from the Central Statistics Office (CSO, 2011). Population denominators use the census figures in the corresponding years and were also obtained from the CSO. Unfortunately census figures at older ages are unreliable for the earlier census. In particular there are problems with the 1911 and 1926 census figures. The reasons for this are discussed by O'Grada (Reference O’ Grada2002) and can be attributed in part to the United Kingdom's Old Age Pensions Act of 1908 which introduced the old age pension in the UK (of which Ireland was then part of). The Pensions Act came into effect on the 1st January 1909 and was payable on a means tested basis from age 70 onwards. While in the rest of the UK births were registered from the 1840s, births were not registered in Ireland until the 1860s. This resulted in individuals being able to misrepresent their ages and claim the old age pension before age 70. To ensure consistency with pension claims ages were also mis-reported in the 1911 census and this had the effect of underestimating death rates between approximately ages 50 and 80. Problems persisted until the 1960s as discussed by Whelan (Reference Whelan2009a).
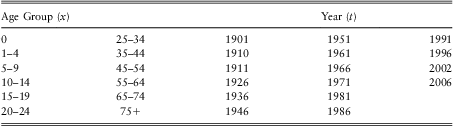
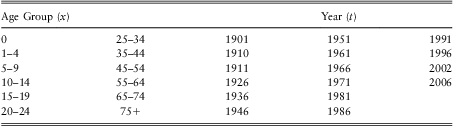
Deaths and population data were obtained from the Human Mortality Database (HMD, 2011) for Northern Ireland and England and Wales. Cause of death data was obtained from the register general reports for Northern Ireland (NISRA, 2011), and from the ONS website (ONS, 2011) for England and Wales. Table 1 presents the age groups and years used in the analysis.
Age groupings (x) and years (t) used to calculate directly age standardised death rates.
The death rate for each age group and year was calculated as:
 $$\frac{{{{D}_{x,t}}}}{{{{P}_{x,t}}}}\: = \:\frac{{average\ no.\ of\ deaths\ in\ age\ group\ x\ in\ the\ three\ years\ centred\ on\ year\ t}}{{population\ count\ for\ age\ group\ x\ in\ year\ t}}$$
For Ireland the population count (Px,t) is the census figure for the corresponding age group and year and typically applies in April of that year. For Northern Ireland and England and Wales the population count is obtained from the HMD database and applies on the 1st of January of that year. For all regions death rates in each year are based on the average of the number of deaths in each age group in the three calendar years centred on the census years, with the exception of death rates for 1951 for Northern Ireland and England and Wales, which are averaged over only the two years 1951 and 1952 to exclude any post war effect on death rates in 1950. Mortality trends are compared using directly age standardised death rates (Siegel et al. Reference Siegel and Swanson2004) standardised to the European Standard Population (Ahmad et al. Reference Ahmad, Boschi-Pinto, Lopez, Murray, Lozano and Inoue2001).
3. All-Cause Mortality Trends
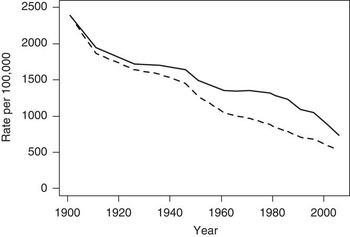
Figure 1 presents the directly age standardised death rates for Ireland over the period 1901 to 2006 for both males and females. As expected the standardised death rates declined over the period for both males and females with females showing the greatest decline. The standardised death rate dropped by approximately 69% for males and 78% for females between 1901 and 2006. In 1901 the directly standardised death rates were effectively equivalent for males and females. However, females initially experienced greater improvements in mortality than males and the gap between males and females increased until the 1980s before starting to narrow again. Ireland experienced significant improvements in mortality in the early years of the 21st century. The directly standardised death rate dropped by approximately 16% for males and 11% for females between the census years 2002 and 2006.
Directly standardised all-cause death rate for Ireland from 1901 to 2006 for males and females. Males ______, Females _ _ _ _ _.

3.1 Mortality Trends by Age Group
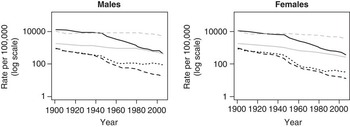
Figure 2 presents the trend in the directly standardised death rates for various broad age groupings for Ireland from 1901 to 2006. All age groups experienced improvements in mortality with the most significant improvements occurring in the younger age groups. Death rates for age group 15–34 effectively level off from the 1960s for males. This is due to the emergence of the “accident hump” in this age group from the 1960s where death rates from accidental deaths amongst young males in their late teens and early twenties rise sharply before declining again. Females display a similar pattern with very little improvement in mortality in this age group since the 1980s. Death rates amongst the oldest age group (65+) remain relatively unchanged for most of the 20th century. Females start to show a steady improvement from the 1980s onwards while the improvement for males start later in the late 1980s or early 1990s.
Directly standardised all-cause death rate for Ireland 1901–2006 for males and females by broad age group. Age 0 ____, Ages 1–14 – – –, Ages 15–34 ……., Ages 35–64 ____, Ages 65+ _ _ _ .

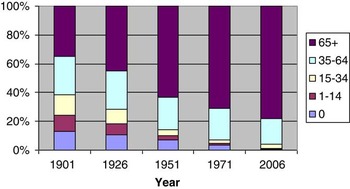
Figure 3 shows how the proportion of actual deaths in the broad age groups changed over the period. In 1901 approximately 65% of all deaths occurred before age 65. By 1926 while this figure had improved the majority of deaths (approximately 55%) still occurred before age 65. However by 1951 the proportions had changed with deaths among the over 65s accounting for the majority (over 60%) of deaths. This pattern continued and by 2006 approximately 80% of deaths were attributed to those aged over 65.
Proportion of actual deaths by broad age group in 1901, 1926, 1951, 1971 and 2006 for both males and females combined.

3.2 Relative Differences in Mortality
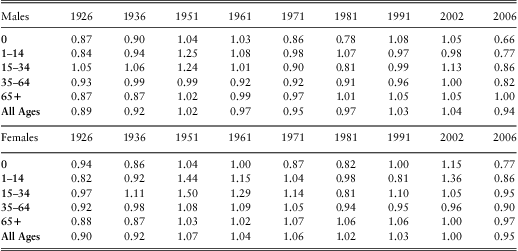
Table 2 presents the relative difference in mortality between Ireland and Northern Ireland by broad age group starting with the first census post partition in 1926 and continuing approximately every 10 years until 2006 with a gap in the war period in the 1940s. A relative difference less than one indicates that Ireland experienced better mortality compared to Northern Ireland and vice versa. The gap between mortality in Northern and Southern Ireland fluctuated over the century and varied between males and females. In the early part of the 20th century Ireland experienced better mortality than Northern Ireland in most age groups. However by 1951 the directly standardised death rates for most age groups for both males and females were lower for Northern Ireland than for Ireland. The gap between females aged 15–34 was particularly high with Irish mortality 1.5 times higher than for females in Northern Ireland. In the second half of the 20th century the relative mortality risk differed between males and females. From table 2 it can be seen that Irish males experienced better mortality at “all-ages” compared with their counterparts in Northern Ireland until 1991 with the difference persisting in 2002. In contrast it can be seen from table 2 that Irish females experienced higher mortality at “all-ages” in the second half of the 20th century with the largest gap occurring in 1971. Thereafter the gap narrowed so that by 2002 the directly standardised mortality rates were effectively equivalent betweenthe two countries. As previously discussed Ireland experienced rapid improvements in mortality at the start of the 21st century and by 2006 Irish mortality was lower than or equal to the mortality of Northern Ireland for all age groups for both males and females. Note that for consistency with death rates in Northern Ireland the directly standardised death rate for 1951 in Ireland was recalculated based on deaths in 1951 and 1952 only.
Relative mortality by broad age group for Ireland and Northern Ireland. A relative value less than 1 indicates that Ireland experienced better mortality than Northern Ireland and vice versa.
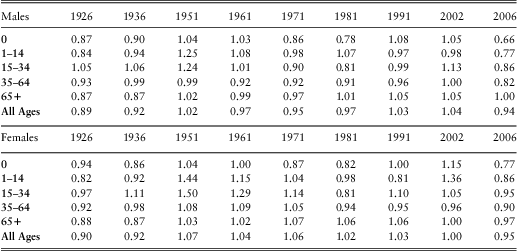
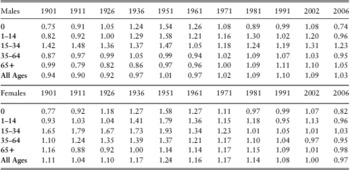
Table 3 presents the relative difference in mortality between Ireland and England and Wales starting from 1901. With the exception of 1951 Irish males at “all-ages” experienced better mortality relative to England and Wales for most of the 20th century. Mortality in England and Wales did not fall below that of Ireland for “all ages” until 1971. Initially England and Wales started to outperform Irish male mortality in the younger age groups with death rates at older ages (65+) not falling below those of Ireland until 1981. Irish male mortality remained higher than that of England and Wales for the rest of the 20th century with the gap only starting to narrow in the 21st century. By 2006 Irish male death rates were either lower than or very similar to male death rates in England and Wales with the exception of age group 15–34 where Irish male mortality was still significantly (1.23 times) higher relative to England and Wales. For females death rates for England and Wales outperform those for Ireland in virtually all years and age groups in the 20th century. The largest gap occurred in 1951 where the mortality of Irish females at “all-ages” was 1.24 times that of females in England and Wales. The gap for age group 15–34 is exceptional with Irish female mortality 1.93 times that of females in England and Wales in 1951. However Irish females have shown a remarkable improvement in mortality relative to England and Wales in the 21st century. While Irish female mortality was generally higher than in England and Wales over the 20th century and was still higher in 1991 by 2006 Irish female mortality had fallen below that of England and Wales at “all-ages” for the first time since 1901. As before the 1951 directly standardised death rate for Ireland was recalculated based on deaths in 1951 and 1952 only for consistency in the comparisons.
Relative mortality by broad age group for Ireland and England and Wales. A relative value less than 1 indicates that Ireland experienced better mortality than England and Wales and vice versa.

From tables 2 and 3 it can be seen that at “all ages” the mortality experience of Irish males was closer to that of males in England and Wales than Northern Ireland until 1981 but closer to that of Northern Ireland for the remainder of the century. For females Irish mortality was closer to the mortality of Northern Ireland than England and Wales during the 20th century. By 2006, however, the mortality experience of Irish males and females was closer to that of England and Wales than Northern Ireland at all ages.
4. Cause of Death
The 20th century saw dramatic improvements in living standards and advances in medicine which changed the principal causes of death for both males and females. At the start of the 20th century infectious diseases were the primary cause of death in Ireland across most age groups. By 2006 circulatory diseases and cancer were the main killers. In this section trends in five broad categories of cause of death in Ireland are analysed over the 20th century – Infectious Diseases, Circulatory Diseases, Respiratory Diseases, Cancer, Mental Disorders and External Causes e.g. accidents. Together these deaths account for over 60% of all deaths in each of the years. Deaths are classified according to the World Health Organisation (WHO, 2011) International Classification of Diseases (ICD) codes. The ICD codes have gone through 10 revisions since the start of the 20th century and the rules governing the classification of deaths under the various ICD codes have also changed. ICD codes were not used in the classification of deaths in Ireland in 1901 and 1911 and consequently trends by the cause of death are analysed from 1926 onwards. Appendix 1 lists the specific causes of death, by ICD code for Ireland, in each of the five broad categories for the years analysed.
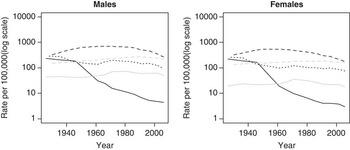
Figure 4 presents the trend in the directly standardised death rate for the five categories of cause of death in Ireland in the census years from 1926 to 2006. As before death rates are averaged over the 3 years centred on the census year with the exception of death rates in 2006 which are based on the average of deaths in 2005 and 2006 only as Ireland moved from ICD-9 for classifying deaths in 2006 to ICD-10 in 2007. Moving between successive revisions of ICD codes can create discontinuities in the analysis of mortality trends by cause due to changes in the coding rules and the cause of death lists. As a result of the significant differences between ICD-9 and ICD-10 it is difficult to allocate deaths under these revisions to consistent categories hence deaths in 2007, coded using ICD-10, are excluded from the analysis by cause of death. Males and females show similar trends for each category. The most dramatic drop occurs for infectious diseases with an approximate 98% fall in the directly standardised death rate between 1926 and 2006 for both males and females. In 1926 tuberculosis (TB) was the primary cause of death due to infectious diseases accounting for over 10% of total deaths in that year. Circulatory diseases (mainly ischemic heart disease and stroke) accounted for the largest proportion of deaths in the second half of the century peaking in the 1960s/1970s for females and slightly later for males. Circulatory diseases remain the primary killer for both males and females in 2006 accounting for 35% of all deaths. Deaths from cancer rose steadily over the 20th century and by 2006 accounted for almost as many deaths as circulatory diseases for females. Deaths from external causes remained relatively stable before starting to rise in the 1960s, peaking in the 1970s. Deaths due to external cause were higher for males than females over the whole period. The standardised death rate for respiratory diseases (mainly pneumonia and bronchitis) declined by approximately 65% for males and 70% for females. As discussed in section 3 Ireland experienced rapid improvements in mortality in the early years of the 21st century and this can be attributed mainly to the improvement in mortality due to circulatory diseases. The drop in the deaths due to circulatory diseases accounts for over 50% of the drop in the standardised death rate between 2002 and 2006 for males and over 60% for females.
Directly standardised death rates by broad cause of death category for males and females in Ireland from 1926 to 2006. Infectious _____, Circulatory _ _ _, Respiratory --------, External _____, Cancer _ _ _ .

The ICD codes contain a “catch-all” group which may be used when the cause of death is unknown. Since ICD-6, introduced in 1950, this group is referred to as “Symptoms, Senility and Ill-Defined Conditions” and includes a number of sub-causes. Prior to ICD-6 senility/old age was listed as a separate cause of death. The proportion of deaths allocated to such “catch-all” causes, henceforth referred to as “ill-defined causes”, varied over the century. In 1926 approximately 22% of all deaths were classified as “ill-defined”. The proportion of ill-defined deaths fell over the 20th century reducing to approximately 7% by 1961, 2% by 1971 and less than 1% by 1981. The majority of deaths due to ill-defined causes were classed as old age/senility and the proportions were slightly higher for females than for males. As the proportion of ill-defined deaths reduced deaths due to other categories such as circulatory diseases and cancer, which predominate in the older population, increased as deaths previously classed as “old age/senility” were now attributed to the correct cause. The lumping of deaths into “old age/ senility” from approximately age 65 onwards in the early years of the century distorts trends for the other main causes of death. Consequently it is important to analyse trends in cause of death by broad age group to ensure trends in younger age groups are not distorted by the catch all cause of “old age/ senility” in the early years of the century.
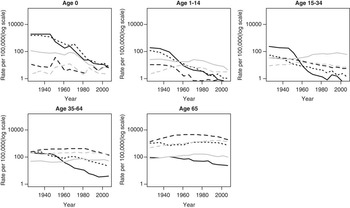
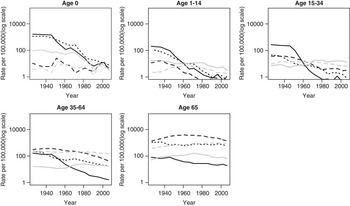
Figures 5 and 6 present the directly standardised death rate for each of the five broad categories of cause of death by age group over the period for males and females respectively. The trends in the cause of death by category vary between age groups although males and females show similar patterns in each of the age groups. The younger age groups (0–34) show dramatic drops in the death rate due to infectious and respiratory diseases. Amongst these age groups deaths due to infectious and respiratory diseases dominated in the early part of the century to be replaced primarily by external causes as the main category of death by 2006. Comparing with figure 2 which shows the drop in all-cause mortality for the same age groups we can see that the significant drop in all-cause mortality for age groups 0 and 1–14 from the 1940s coincides with the drop in infectious and respiratory diseases in these age groups. For age group 15–34 the drop in all cause mortality up to the 1960s coincides with the drop in infectious and respiratory diseases, however the levelling off seen in this age group from the 1960s coincides with the rise in external causes of death (the “accident hump”) from this period as discussed in section 3.1. For age group 35–64 the primary cause of death category changed from circulatory diseases at the start of the 20th century to cancer by the start of the 21st century. Comparing with figure 2 the drop in all-cause mortality for this age group from approximately the 1970s for females and the 1980s for males coincides with the drop in circulatory diseases from this time. In contrast age group 65+ shows different trends for each of the categories compared with the other age groups. Deaths due to infectious and respiratory diseases show a smaller decline compared with the other age groups while deaths due to circulatory diseases, cancer and external causes show a rise. As discussed previously this can partly be attributed to the better reporting and classification of deaths at older ages as the 20th century progressed. Comparing with figure 2 the drop in “all-cause” mortality for this age group coincides with the drop in deaths due to circulatory diseases from the late 1980s for males and the late 1970s to early 1980s for females. Circulatory diseases remain the primary killer for this age group but deaths from cancer increased steadily in significance and by 2006 accounted for almost as many deaths for females as circulatory diseases.
Directly standardised death rates by broad cause of death category for Irish males from 1926 to 2006 by age group. Infectious  $$$$
, Circulatory
 $$$$
, Respiratory
 $$$$
, External
 $$$$
, Cancer
 $$$$
.

Directly standardised death rates by broad cause of death category for Irish females from 1926 to 2006 by age group. Infectious  $$$$
, Circulatory
 $$$$
, Respiratory
 $$$$
, External
 $$$$
, Cancer
 $$$$
.

4.1 Relative Mortality Risk by Cause of Death
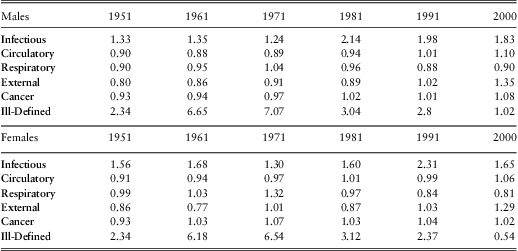
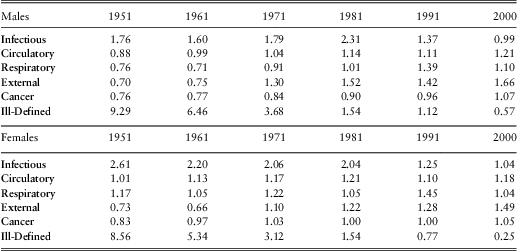
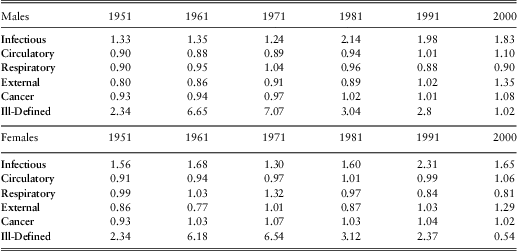
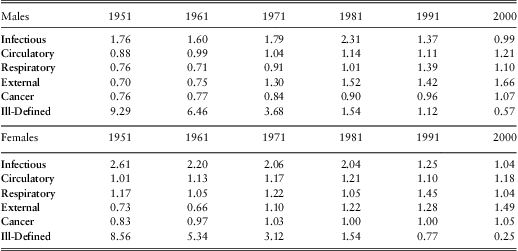
Tables 4 and 5 present the relative differences in the directly standardised death rates for the five broad categories of cause of death between Ireland and Northern Ireland, and Ireland and England and Wales approximately every ten years starting in 1951 for males and females. Death rates in 2000 are based on the average of the deaths in 1999 and 2000 only. The UK moved to ICD-10 for classification of cause of death from 2001 onwards and so comparisons by cause post 2000 are excluded. As before a relative difference greater than one indicates that Ireland experienced worse mortality compared to Northern Ireland or England and Wales and vice versa. The lumping of deaths into the catch-all group of “ill-defined” distorts trends in relative risk between the countries. Ireland classified a much larger proportion of deaths as ill-defined in the early part of the 20th century than either Northern Ireland or England and Wales. In 1951 the percentage of male deaths classified as “ill-defined” was approximately 13%, 6% and 1% for Ireland, Northern Ireland and England and Wales respectively. The corresponding percentages for females were 15%, 7% and 2%. Tables 4 and 5 also include the relative risk for ill-defined causes. As discussed earlier the proportion of “ill-defined” deaths in Ireland reduced over the 20th century. In Northern Ireland and England and Wales the proportion of “ill-defined” deaths also declined until the 1980s and then started to rise slightly. Analysis of relative death rates for a particular category must include consideration of the relative differences in the “ill-defined” death rates and the number of deaths by category. The smaller the number of actual deaths for a category the greater the impact of random fluctuations. Also it can be assumed that in some cases the lower relative death rates for the broad cause of death categories seen in Ireland in earlier years of the 20th century can be partly attributed to the higher likelihood of classifying deaths due to those categories as “ill-defined” in Ireland than in Northern Ireland or England and Wales. As before, the 1951 directly standardised death rates for the cause of death categories for Ireland were recalculated based on deaths in 1951 and 1952 only for consistency in the comparisons with Northern Ireland and England and Wales.
Directly standardised relative mortality by broad cause of death category for Ireland and Northern Ireland. A relative value less than 1 indicates that Ireland experienced better mortality than Northern Ireland and vice versa.
Directly standardised relative mortality by broad cause of death category for Ireland and England and Wales. A relative value less than 1 indicates that Ireland experienced better mortality than England and Wales and vice versa.
From table 4 we see that death rates for the five broad categories of cause of death tend to be higher in Ireland relative to Northern Ireland in 2000 than in 1951. While Ireland experiences much higher relative mortality than Northern Ireland for infectious diseases towards the end of the 20th century the actual number of deaths due to infectious diseases is very low by this time. The higher relative mortality in 1951 due to infectious diseases is however significant as infectious diseases were still a major killer in 1950s’ Ireland. In 1951 and 1952 tuberculosis (TB) was the main cause of death from infectious diseases in Ireland. TB accounted for over 5% of total male deaths and 4.5% of total female deaths in Ireland in 1951 and 1952. The corresponding proportions were 3.5% and 2.8% in Northern Ireland. TB was a major health concern in Ireland and the UK in the first half of the 20th century and its impact has been well documented (Bryder, Reference Bryder1988; Dormandy, Reference Dormandy1999; Jones Reference Jones2001). It was only with the introduction of effective vaccines and antibiotics from the late 1940s that TB could effectively be treated and from 1950 onwards deaths due to TB declined dramatically. By 1961 TB accounted for less than 1.5% of deaths in Ireland. According to table 4 Irish males had lower death rates for circulatory diseases and cancer (the primary cause of death categories in the 2nd half of the 20th century) in 1961 and 1971 than males in Northern Ireland. However this coincides with much higher death rates for “ill-defined” causes for Irish males in the same years. As the relative difference between the two countries for deaths due to “ill-defined” causes reduced the standardised death rates for circulatory diseases and cancer in Ireland worsened relative to Northern Ireland in 1981, 1991 and 2000. A similar pattern can be seen for females. Donnelly et al. (Reference Donnelly, Gavin and Comber2009) discuss cancer trends in Ireland and Northern Ireland between 1994 and 2004 and they attribute the higher death rate from cancer for males in Ireland to higher levels of prostate cancer. They also noted the geographic variations that exist for both cancer incidence and death rates with higher rates in urban areas in both Ireland and Northern Ireland. Donnelly & Gavin. (Reference Donnelly and Gavin2010) extend their analysis of cancer in Northern Ireland to 2007 and report that between “2003 and 2007 there was no statistically significant difference in deaths due to cancer between the two countries”. This is consistent with the relative improvement in “all-cause” mortality between Ireland and Northern Ireland in the 21st century discussed in section 3. Relative mortality due to external causes showed a dramatic increase between 1991 and 2000 while there was little change in the relative mortality risk for respiratory diseases in 1951 and 2000 for males though the risk fluctuated in the intervening years.
Table 5 presents the relative risk between Ireland and England and Wales over the same period. Irish females perform poorly relative to England and Wales in most categories in most of the years and this is consistent with table 5 which shows higher all-cause mortality for Irish females in these years. In particular the gap between female all-cause mortality in Ireland and England and Wales was greatest in 1951 (over 20%) and this coincides with the significantly higher death rate for infectious diseases for Irish females in that year. Irish males perform poorly in the primary cause of death category, circulatory diseases, from 1971 relative to England and Wales and this is consistent with table 3 which shows higher all-cause mortality in Ireland in the latter part of the 20th century. While the relative mortality risk due to cancer dis-improved over the 20th century based on the figures in table 5 it is not until the year 2000 that deaths due to cancer are higher in Ireland compared with England and Wales for males. The relative risk for deaths due to ill-defined causes is much higher for Ireland in 1951 indicating that deaths were much more likely to be attributed to a particular cause in England and Wales than in Ireland in 1951. The relative risk for ill-defined causes declines over the century so that by 2000 proportionally fewer deaths are classified as ill-defined in Ireland than in England and Wales though actual numbers of deaths in this group are very low by the end of the century.
5. Discussion
Ireland experienced significant improvements in mortality in the 20th century and in the early part of the 21st century. Females experienced greater improvements in mortality than males with an approximate 69% drop in the standardised death rate for males and an approximate 78% drop for females between 1901 and 2006. Improvements were most significant in the younger age groups with the directly standardised death rate for those aged under 15 falling by approximately 98% between 1901 and 2006.
The mortality experience of Irish males compared favourably with males in Northern Ireland and England and Wales for most of the 20th century. However towards the end of the 20th century Irish males experience increasingly worse relative mortality. In contrast the mortality experience of Irish females generally lagged behind that of their counterparts in Northern Ireland and England and Wales during the 20th century with the gap narrowing towards the end of the century. Ireland experienced more rapid improvements in mortality in the early years of the 21st century than either Northern Ireland or England and Wales. By 2006 the directly standardised death rate of Irish males was 0.94 and 1.03 times that of Northern Ireland and England and Wales respectively while females in Ireland experienced lower mortality than females in either Northern Ireland or England and Wales. As discussed in section 3 relative mortality risk varied by age group and gender around these overall trends. The significant improvements in Irish mortality at the start of the 21st century coincided with the so called “celtic tiger” years when the Irish economy experienced an unprecedented boom. Since 2007 the fortunes of the Irish economy have reversed and it will be interesting to see if the improvements in relative mortality continue.
Death rates were analysed by five broad categories of cause of death between 1926 and 2006 – infectious diseases, respiratory diseases, circulatory diseases, cancer and external causes. Males and females showed similar trends for each of the causes. The primary cause of death category changed over the 20th century from infectious diseases at the start of the 20th century to circulatory diseases and cancer by the start of the 21st century. The tendency to lump a large proportion of deaths over age 50 into the catch all group of “ill-defined” in the early years of the 20th century distorts mortality trends by cause of death category and it is necessary to analyse trends by broad age group. With the exception of deaths due to cancer for males and females and external causes for males, standardised death rates at “all ages” for the remaining cause of death categories were lower in 2006 compared with 1926. As before improvements varied by category and by age group. Improvements in the death rate due to infectious diseases had the greatest impact at younger ages while changes in death rates due to circulatory diseases and cancer had the greatest impact at older ages. The rapid drop in the standardised death rate in the early years of the 21st century was mainly due to the drop in the deaths due to circulatory causes. Layte et al. (Reference Layte, O'Hara and Bennett2010) attribute part of the drop in deaths due to circulatory causes to increased cardiovascular prescribing and improvements in access to healthcare for older people with the introduction of the medical card in 2001 which provided free healthcare to those aged 70 and over in Ireland. This illustrates the impact that social changes and government policy continue to have on population mortality. Mortality by cause of death category varies significantly by socio-economic status and a report by the Institute of Public Health in Ireland (Balanda & Wilde, Reference Balanda and Wilde2001) discuss the impact of social inequality in Ireland on mortality by cause of death over the period 1989 to 1998. According to the report social inequality had the greatest impact on deaths from respiratory diseases with a 200% difference in the mortality of those in the highest and lowest occupation groups. For circulatory diseases the difference was over 120%, for injuries and poisonings over 150% and for cancer over 100%. It should be noted that the grouping of deaths by cause of death category differs between the report of the Institute of Public Health in Ireland and this paper. If government policy can reduce the effect of social inequality on death rates for particular causes of death Ireland could expect to see further improvements in overall mortality and life expectancy.
Mortality by cause of death could only be compared with Northern Ireland and England and Wales until 2000 as the UK moved to the new ICD-10 codes in 2001. It should be remembered that the classification of deaths by cause changed over the 20th century and varied between Ireland and the UK so analysis of trends over time and between countries can only ever be approximate. Consistent with the higher “all-cause” death rates in Ireland towards the end of the 20th century the standardised death rates for the broad cause of death categories analysed were also generally higher for Ireland at the end of the 20th century relative to Northern Ireland and England and Wales.
This paper provided an overview of “all-cause” Irish mortality between 1901 and 2006 and by five broad categories of cause of death between 1926 and 2006. Trends were compared with Northern Ireland and England and Wales by age group, gender and cause of death category. Future work will involve extending the analysis to future years and analysing mortality trends by cohort (year of birth), by socio-economic class and by specific causes of death.
Acknowledgements
The author wishes to thank the Central Statistics Office, Ireland, for providing the Irish population and death data. The author also thanks the referee for their constructive comments which have substantially improved the paper.
Appendix
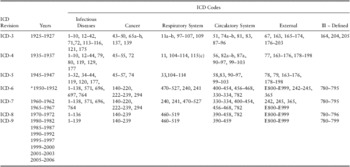
Broad Cause of Death Categories in Ireland by ICD code 1925 to 2006
The grouping of ICD codes by broad cause of death category is based on the codes used to examine trends by cause of death by Griffiths & Brock (Reference Griffiths and Brock2003) in the paper “Twentieth Century Mortality Trends in England and Wales”. The groups are not identical to those used by Griffiths & Brock, particularly in earlier years where the ICD codes have been amended in England and Wales to give finer classification of deaths. Consequently the ICD codes do not match exactly between the countries. When comparing the relative mortality risk by cause of death category between Ireland and Northern Ireland and England and Wales in section 4.1, deaths in Northern Ireland and England and Wales were grouped by the ICD codes in table 6 where possible. Where there was no exact match for a code either a reasonable alternative code or codes were used or no deaths were recorded for that code in Northern Ireland or England and Wales. The effect of this is mainly confined to the analysis of deaths in Northern Ireland in the 1950s and 1960s where deaths were grouped by “Intermediate List No.s” in the register general annual reports in those years.
ICD codes used to group deaths in Ireland by broad cause of death category from 1925 to 2006.