1 Introduction
1.1 Aims and objectives
Near-wall turbulence is responsible for significant drag penalties in many flows of engineering relevance, and because of that, many researchers are studying various ways to be able to properly control the flow (Choi, Moin & Kim Reference Choi, Moin and Kim1993; Dubief et al. Reference Dubief, White, Terrapon, Shaqfeh, Moin and Lele2004; Breugem, Boersma & Uittenbogaard Reference Breugem, Boersma and Uittenbogaard2006; Orlandi & Leonardi Reference Orlandi and Leonardi2008; García-Mayoral & Jiménez Reference García-Mayoral and Jiménez2011; Rosti, Cortelezzi & Quadrio Reference Rosti, Cortelezzi and Quadrio2015; Rosti, Brandt & Pinelli Reference Rosti, Brandt and Pinelli2018b ). Among the many control strategies, the use of polymers has been demonstrated to be very efficient to reduce drag in pipelines (Virk Reference Virk1971). While flows through axisymmetric geometry have been extensively studied (Virk et al. Reference Virk, Merrill, Mickley, Smith and Mollo-Christensen1967; Cho & Harnett Reference Cho and Harnett1982; Den Toonder et al. Reference Den Toonder, Hulsen, Kuiken and Nieuwstadt1997; Escudier, Presti & Smith Reference Escudier, Presti and Smith1999; Ptasinski et al. Reference Ptasinski, Boersma, Nieuwstadt, Hulsen, Van den Brule and Hunt2003; Resende et al. Reference Resende, Escudier, Presti, Pinho and Cruz2006), less attention has been given to more complex geometries, such as square ducts. In this context, the aim of this work is to explore and better understand the interactions between the turbulent flow in ducts with square section and polymer additives.
1.2 Duct flow
Turbulent flow in a plane channel has been extensively studied in the past (Kim, Moin & Moser Reference Kim, Moin and Moser1987), while the flow in a duct with a square cross-section has received much less attention (Uhlmann et al. Reference Uhlmann, Pinelli, Kawahara and Sekimoto2007; Pinelli et al. Reference Pinelli, Uhlmann, Sekimoto and Kawahara2010; Samanta et al. Reference Samanta, Vinuesa, Lashgari, Schlatter and Brandt2015; Vinuesa, Schlatter & Nagib Reference Vinuesa, Schlatter and Nagib2015; Owolabi, Poole & Dennis Reference Owolabi, Poole and Dennis2016), although its geometry is only mildly more complex. Peculiar features of the turbulent flow in a duct are that the mean velocity profile presents a non-uniform distribution of the skin friction coefficient along the edges, and the related appearance in the cross-sectional plane of secondary motions of the second kind, as classified by Prandtl (Reference Prandtl1926), which is a mean flow effect induced by gradients of turbulence fluctuations, e.g. a breaking of axisymmetry. The existence of such secondary mean motion in this geometrical configuration has been well known since the experiments by Nikuradse (Reference Nikuradse1926), which were followed by further experimental measurements (Brundrett & Baines Reference Brundrett and Baines1964; Gessner Reference Gessner1973; Melling & Whitelaw Reference Melling and Whitelaw1976) as well as direct numerical and large-eddy simulations (Madabhushi & Vanka Reference Madabhushi and Vanka1991; Gavrilakis Reference Gavrilakis1992; Uhlmann et al. Reference Uhlmann, Pinelli, Kawahara and Sekimoto2007; Pinelli et al. Reference Pinelli, Uhlmann, Sekimoto and Kawahara2010), all of which subsequently extended our knowledge of this flow. Uhlmann et al. (Reference Uhlmann, Pinelli, Kawahara and Sekimoto2007) simulated the case of the marginal Reynolds-number regime and showed that the buffer-layer coherent structures play a crucial role in the appearance of the secondary flow and in the deformation of the mean streamwise velocity profile. Indeed, they proposed that the deformation of the mean streamwise velocity profile is due to the presence of preferential positions of quasi-streamwise vortices and velocity streaks. Moreover, in such a marginal regime, short-time-averaged velocity fields are found to exhibit a four-vortex state instead of the usual eight-vortex secondary flow pattern found at higher Reynolds numbers. This feature was explained with the relation between coherent structures and secondary flow: if the dimension of the cross-section, in wall units, is below that needed to accommodate a complete minimal turbulent cycle on all four walls (Jimenez & Moin Reference Jimenez and Moin1991), then just two facing walls can alternately give rise to a complete turbulent regeneration mechanism, while the other two faces remain in a relative quiescent state. Such four-vortex states at marginal Reynolds number have also been observed experimentally (Owolabi et al. Reference Owolabi, Poole and Dennis2016). Pinelli et al. (Reference Pinelli, Uhlmann, Sekimoto and Kawahara2010) studied turbulent duct flows at higher Reynolds numbers, where the length of the edge of the square cross-section, expressed in viscous units, is larger, therefore allowing for the simultaneous presence of multiple pairs of high- and low-velocity streaks. These authors further proved the idea that the secondary flow is a footprint of the coherent motions embedded in the turbulent flow, and proposed a scenario in which the position of the centre of the mean secondary vortices is determined by the preferential positioning of the quasi-streamwise vortices.
1.3 Polymer additives
Polymer addition is a very efficient strategy employed for drag reduction in wall-bounded turbulent flows, since drag reduction up to 80 % has been achieved with concentrations of only a few parts per million. Two distinct regimes are usually identified (Warholic, Massah & Hanratty Reference Warholic, Massah and Hanratty1999), often called low and high drag reduction (LDR and HDR, respectively). The former (LDR) exhibits a log-law region of the mean velocity profile parallel to that of the Newtonian flow, but with an upward shift associated with the amount of drag reduction; streamwise fluctuations are increased while wall-normal and spanwise components are reduced, as well as the shear stress. The regime characterised by high drag reductions (HDR), more than 40 %, shows a strong increase in the slope of the log-law region and low levels of Reynolds shear stress (Ptasinski et al. Reference Ptasinski, Boersma, Nieuwstadt, Hulsen, Van den Brule and Hunt2003). The drag reduction is eventually bounded by a maximum drag reduction (MDR) (Virk, Mickley & Smith Reference Virk, Mickley and Smith1970). Several works (Warholic et al. Reference Warholic, Massah and Hanratty1999; Ptasinski et al. Reference Ptasinski, Boersma, Nieuwstadt, Hulsen, Van den Brule and Hunt2003) observed low-Reynolds shear stress and a consequent deficit in the stress balance equation, which has been interpreted as the input of energy from the polymers to the flow which ultimately sustains the asymptotic MDR.
The drag reduction mechanism is quite complex due to its multiscale nature (a small amount of microscopic polymer molecules is needed to achieve significant drag reduction in the bulk flow) and its full physical understanding is still incomplete. Several explanations have been proposed to gain further insight into the mechanism of polymer drag reduction: Dimitropoulos et al. (Reference Dimitropoulos, Sureshkumar, Beris and Handler2001) showed that streamwise enstrophy is inhibited by the extensional viscosity generated by polymers stretched by turbulence; Ptasinski et al. (Reference Ptasinski, Boersma, Nieuwstadt, Hulsen, Van den Brule and Hunt2003) found a shear sheltering effect in the near-wall region which decouples the outer- and inner-layer vortices; Min, Choi & Yoo (Reference Min, Choi and Yoo2003a ) and Min et al. (Reference Min, Yoo, Choi and Joseph2003b ) observed the transport of elastic energy from the viscous sublayer to the buffer and the log region, and proposed a criterion for the onset of drag reduction.
Dubief et al. (Reference Dubief, White, Terrapon, Shaqfeh, Moin and Lele2004, Reference Dubief, Terrapon, White, Shaqfeh, Moin and Lele2005) studied the intermittency of polymers in turbulent flows, showing that the action of polymers is as intermittent as the near-wall vortices, and that the drag-reducing property of polymers is closely related to coherent turbulent structures. Polymers dampen near-wall vortices but also enhance streamwise kinetic energy in near-wall streaks. The net balance of these two opposite actions leads to a self-sustained drag-reduced turbulent flow: the polymers reduce turbulence by opposing the downwash and upwash flows generated by near-wall vortices, while they enhance streamwise velocity fluctuations in the very near-wall region. Recent studies by Xi & Graham (Reference Xi and Graham2010, Reference Xi and Graham2012a ,Reference Xi and Graham b ) provided new insight into the mechanism by which polymer additives reduce the drag. These authors suggested that a turbulent flow is characterised by an alternate succession of strong and weak turbulence phases. The first are characterised by flow structures showing strong vortices and wavy streaks, the latter by weak streamwise vortices and almost streamwise-invariant streaks. In the Newtonian flow, the so-called active turbulence dominates; with increasing viscoelasticity, on the contrary, active intervals becomes shorter while the so-called hibernating intervals are unaffected. Also, it is shown that during these hibernating turbulence intervals, the turbulent dynamics resemble MDR turbulence in both Newtonian and viscoelastic flows (White, Somandepalli & Mungal Reference White, Somandepalli and Mungal2004; Li, Sureshkumar & Khomami Reference Li, Sureshkumar and Khomami2006).
Polymers can also alter flow instabilities and transition to turbulence. Indeed, Biancofiore, Brandt & Zaki (Reference Biancofiore, Brandt and Zaki2017) recently examined the secondary instability of streaks in a viscoelastic flow, showing that the streaks reach a lower average energy with increasing elasticity due to a resistive polymer torque that opposes the streamwise vorticity and, as a result, opposes the lift-up mechanism.
1.4 Polymer solutions in square duct flows
Extensive work has been done experimentally to try to characterise polymer solution behaviour in duct flows. In particular, Logan (Reference Logan1972) and Rudd (Reference Rudd1972) reported limited measurements of the mean-flow and turbulence structure for flow of drag-reducing polymers through square tubes, with sufficiently low polymer concentrations, and provided no information about the secondary flow. More recently, Gampert & Rensch (Reference Gampert and Rensch1996) have reported the results of a systematic study of the influence of polymer concentration on near-wall turbulence structure for the flow through a square duct, but again have provided no direct information on the secondary flow. Also, they argued that there are two flow regimes in which the properties of the polymer structure, and hence the turbulent flow field, differ significantly, depending on the polymer concentration. Escudier & Smith (Reference Escudier and Smith2001) presented both global data (friction factor versus Reynolds number) and detailed mean axial and secondary flow velocity and turbulence field data for fully developed flow through a square duct of various polymer solutions. They found a reduction in the intensity of turbulent velocity fluctuations transverse to the mean flow and a strong reduction in the secondary flow velocities. More recently, Escudier, Nickson & Poole (Reference Escudier, Nickson and Poole2009) provided a comprehensive database of previous experimental works (Rudd Reference Rudd1972; Gampert & Yong Reference Gampert and Yong1990; Escudier & Smith Reference Escudier and Smith2001; Gampert et al. Reference Gampert, Braemer, Eich and Dietmann2005); the authors pointed out that several of these studies have limited turbulence data, and consider mainly relatively low polymer concentrations. Escudier et al. (Reference Escudier, Nickson and Poole2009) placed special emphasis on the quantification of turbulence anisotropy and showed that, with polymer additives, the flow displays a tendency towards the axisymmetric turbulence limit. Also, there is a marked decrease in anisotropy with distance from the near-surface peak in all cases, but this tendency progressively reduces with increasing concentration/drag-reduction level. Recently, Owolabi, Dennis & Poole (Reference Owolabi, Dennis and Poole2017) have explored the relationship between drag reduction and fluid elasticity, and describe a technique for an a priori quantitative prediction of drag reduction from a knowledge of polymer relaxation time, flow rate and geometric length scale, based on a universal relationship between drag reduction and fluid elasticity. Although the previous discussion suggests a satisfactory situation from an engineering viewpoint, for polymer solutions a full understanding of the phenomena is still missing.
1.5 Outline
In this work, we present direct numerical simulations (DNS) of a turbulent duct flow with polymer additives at moderate Reynolds number. In the simulations, the viscoelastic fluid is modelled by the constitutive FENE-P (finite extensible nonlinear elasticity–Peterlin) closure. In § 2, we first discuss the flow configuration and governing equations, and then present the numerical methodology used. The features of the turbulent duct flow are documented in § 3, where we compare results with and without the polymer additives, to elucidate their effect on the secondary motion and on the flow in general at this moderate Reynolds number. First- and second-order statistics are analysed, together with energy and vorticity budgets. Finally, a summary of the main findings and some conclusions are drawn in § 4.
2 Formulation
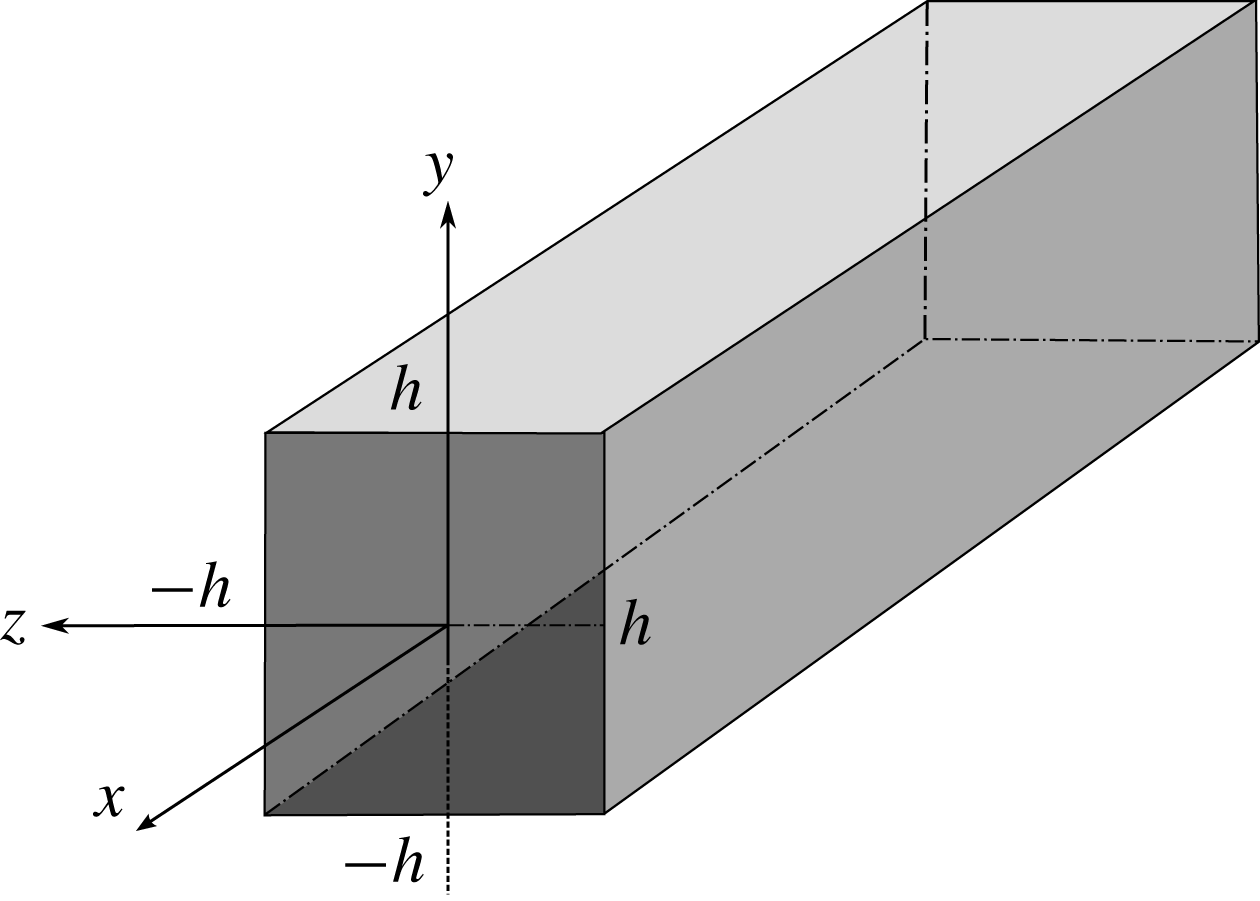
We consider the turbulent flow of an incompressible viscoelastic fluid through a square duct. Figure 1 shows a sketch of the geometry and the Cartesian coordinate system, where
 $x$
,
 $y$
and
 $z$
(
 $x_{1}$
,
 $x_{2}$
and
 $x_{3}$
) denote the streamwise, and the two cross-stream coordinates, while
 $u$
,
 $v$
and
 $w$
(
 $u_{1}$
,
 $u_{2}$
and
 $u_{3}$
) denote the respective components of the velocity vector field. The lower and upper walls are located at
 $y=\pm h$
, while the left and right walls are at
 $z=\pm h$
, where
 $h$
is the cross-section half-size. Moreover, we define
 $\widetilde{y}$
as the distance from the wall. The Reynolds number of the flow is defined as
 $Re=U_{b}h/\unicode[STIX]{x1D708}$
, where
 $h$
is chosen as characteristic length scale, the characteristic velocity is the bulk velocity
 $U_{b}$
, defined as the average value of the mean velocity computed across the whole domain, and
 $\unicode[STIX]{x1D708}$
is the total kinematic viscosity, i.e. the sum of the solvent and polymer viscosity. Hereafter, all the velocity components will be made non-dimensional with
 $U_{b}$
and lengths with
 $h$
, except where explicitly stated otherwise.
Sketch of the square duct geometry and coordinate system adopted with the walls located at
 $y=-h$
and
 $y=h$
, and at
 $z=-h$
and
 $z=h$
.

The fluid is governed by the incompressible Navier–Stokes equations:
 $$\begin{eqnarray}\displaystyle & \displaystyle \frac{\unicode[STIX]{x2202}u_{i}}{\unicode[STIX]{x2202}t}+\frac{\unicode[STIX]{x2202}u_{i}u_{j}}{\unicode[STIX]{x2202}x_{j}}=-\frac{\unicode[STIX]{x2202}p}{\unicode[STIX]{x2202}x_{i}}+\frac{\unicode[STIX]{x1D6FD}}{Re}\frac{\unicode[STIX]{x2202}^{2}u_{i}}{\unicode[STIX]{x2202}x_{j}\unicode[STIX]{x2202}x_{j}}+\frac{1-\unicode[STIX]{x1D6FD}}{Re}\frac{\unicode[STIX]{x2202}\unicode[STIX]{x1D70F}_{ij}}{\unicode[STIX]{x2202}x_{j}}, & \displaystyle\end{eqnarray}$$
 $$\begin{eqnarray}\displaystyle & \displaystyle \frac{\unicode[STIX]{x2202}u_{i}}{\unicode[STIX]{x2202}x_{i}}=0, & \displaystyle\end{eqnarray}$$
 $p$
is the pressure,
 $\unicode[STIX]{x1D6FD}$
the ratio of the solvent viscosity to the total fluid viscosity, and
 $\unicode[STIX]{x1D70F}_{ij}$
the extra stress tensor due to the polymers. Note that if
 $\unicode[STIX]{x1D6FD}$
equals 1, the standard Navier–Stokes equations are recovered. To model the additional stresses due to the presence of polymers in the flow, we use the FENE-P closure where the polymer stress tensor
 $\unicode[STIX]{x1D70F}_{ij}$
is written as a function of the configuration tensor
 $\unicode[STIX]{x1D60A}_{ij}$
as
 $$\begin{eqnarray}\unicode[STIX]{x1D70F}_{ij}=\frac{1}{Wi}\left(\frac{\unicode[STIX]{x1D60A}_{ij}}{1-{\displaystyle \frac{\unicode[STIX]{x1D60A}_{kk}}{L^{2}}}}-\unicode[STIX]{x1D6FF}_{ij}\right)\!.\end{eqnarray}$$
In the expression above,
 $L$
is the dumbbell extensibility,
 $\unicode[STIX]{x1D60A}_{kk}$
the trace of the configuration tensor, and
 $Wi$
the Weissenberg number defined as the ratio between the elastic and viscous forces (Dealy Reference Dealy2010; Poole Reference Poole2012), i.e.
 $Wi=\unicode[STIX]{x1D706}U_{b}/h$
with
 $\unicode[STIX]{x1D706}$
being the polymer relaxation time and
 $\unicode[STIX]{x1D6FF}_{ij}$
the Kronecker delta. The configuration tensor is a symmetric second-order tensor, which is found by solving the following dynamic equation:
 $$\begin{eqnarray}\frac{\unicode[STIX]{x2202}\unicode[STIX]{x1D60A}_{ij}}{\unicode[STIX]{x2202}t}+u_{k}\frac{\unicode[STIX]{x2202}\unicode[STIX]{x1D60A}_{ij}}{\unicode[STIX]{x2202}x_{k}}=\unicode[STIX]{x1D60A}_{kj}\frac{\unicode[STIX]{x2202}u_{i}}{\unicode[STIX]{x2202}x_{k}}+\unicode[STIX]{x1D60A}_{ik}\frac{\unicode[STIX]{x2202}u_{j}}{\unicode[STIX]{x2202}x_{k}}-\unicode[STIX]{x1D70F}_{ij}.\end{eqnarray}$$
The equation is a balance between the advection of the configuration tensor on the left-hand side, and the stretching and relaxation of the polymer, represented by the first two terms and the last one on the right-hand side, respectively.
2.1 Numerical implementation
The code for the numerical solution of the equations above is an extension of that described by Rosti & Brandt (Reference Rosti and Brandt2017, Reference Rosti and Brandt2018) and Rosti, Brandt & Mitra (Reference Rosti, Brandt and Mitra2018a
), with which it shares its general architecture. The time integration method used to solve the equations is based on an explicit fractional-step method (Kim & Moin Reference Kim and Moin1985), where all the terms are advanced with the third-order Runge–Kutta scheme, except the viscous stress contribution, which is advanced with Crank–Nicolson (Min, Yoo & Choi Reference Min, Yoo and Choi2001). In particular, to solve the system of governing equations, at every time step, we perform the following steps (see also Min et al.
Reference Min, Yoo and Choi2001; Dubief et al.
Reference Dubief, Terrapon, White, Shaqfeh, Moin and Lele2005): (i) the updated conformation tensor
 $\unicode[STIX]{x1D60A}_{ij}$
is found by solving (2.3) with the last term
 $\unicode[STIX]{x1D70F}_{ij}$
substituted by (2.2); (ii) the polymer stress tensor
 $\unicode[STIX]{x1D70F}_{ij}$
is computed by (2.2); and (iii) the Navier–Stokes equations (2.1) are advanced in time first by solving the momentum equation (prediction step), then by solving a Poisson equation for the projection variable, and finally by correcting the velocity and pressure to make the velocity field divergence free (correction step).
The numerical solution of (2.3) is cumbersome, and many researchers have shown that the numerical solution of a viscoelastic fluid is unstable, especially in the case of high Weissenberg numbers, since any disturbance amplifies over time (Dupret & Marchal Reference Dupret and Marchal1986; Sureshkumar & Beris Reference Sureshkumar and Beris1995; Min et al. Reference Min, Yoo and Choi2001). Indeed, equation (2.3) can easily diverge and lead to the numerical breakdown of the solution since it is an advection equation without any diffusion term (Dubief et al. Reference Dubief, Terrapon, White, Shaqfeh, Moin and Lele2005). One of the earliest solutions to this problem was to introduce an artificial diffusivity (AD) to the constitutive equations (Sureshkumar & Beris Reference Sureshkumar and Beris1995; Mompean & Deville Reference Mompean and Deville1997; Alves, Pinho & Oliveira Reference Alves, Pinho and Oliveira2000). Subsequently, global AD was replaced by local AD, a method that has been widely used. In the present work, we use global AD in the first transient part of the simulation of a viscoelastic flow, and then gradually remove it while approaching the final statistical steady-state regime, when it is completely removed. Also, we chose to use a fifth-order weighted essentially non-oscillatory (WENO) scheme (Jiang & Shu Reference Jiang and Shu1996) for the advection terms in (2.3). Apart from that, the governing differential equations are solved on a staggered grid using a second-order central finite-difference scheme. This methodology has been proved to work properly by Sugiyama et al. (Reference Sugiyama, Ii, Takeuchi, Takagi and Matsumoto2011) and also successfully used by Rosti & Brandt (Reference Rosti and Brandt2017) for viscoelastic solid-like materials. A comprehensive review on the properties of different numerical schemes for the advection term is reported by Min et al. (Reference Min, Yoo and Choi2001).
2.2 Numerical details
For all the turbulent flows considered hereafter, the equations of motion are discretised by using
 $448\times 448\times 448$
grid points on a computational domain of
 $12h\times 2h\times 2h$
in the streamwise, wall-normal and spanwise directions, respectively. The spatial resolution has been chosen in order to properly resolve the wall turbulence, satisfying the constraint
 $\unicode[STIX]{x0394}y^{+}=\unicode[STIX]{x0394}z^{+}\approx 0.8$
and
 $\unicode[STIX]{x0394}x^{+}\approx 5$
in the Newtonian case.
Viscous units, used above to express spatial resolution, will often be employed in the following; they are indicated by the superscript
 $^{+}$
, and are built using the friction velocity
 $u_{\unicode[STIX]{x1D70F}}$
as velocity scale and the viscous length
 $\unicode[STIX]{x1D6FF}_{\unicode[STIX]{x1D708}}=\unicode[STIX]{x1D708}/u_{\unicode[STIX]{x1D70F}}$
as length scale. For a turbulent Newtonian duct flow, the friction velocity is defined as
 $$\begin{eqnarray}u_{\unicode[STIX]{x1D70F}}=\sqrt{\unicode[STIX]{x1D708}\frac{\unicode[STIX]{x2202}u^{\ast }}{\unicode[STIX]{x2202}y^{\ast }}},\end{eqnarray}$$
where
 $\unicode[STIX]{x1D708}$
is the kinematic viscosity,
 $u^{\ast }$
and
 $y^{\ast }$
denote the dimensional values of velocity and distance from the wall, and the derivative is taken at the wall (note that the equation is written for the top and bottom walls, but a similar one can be written for the left and right walls by changing
 $y$
to
 $z$
). When the flow is viscoelastic, the definition (2.4) must be modified to account for the polymeric stress, which is in general non-zero at the wall. Thus, we define
 $$\begin{eqnarray}u_{\unicode[STIX]{x1D70F}}=\sqrt{\unicode[STIX]{x1D6FD}\unicode[STIX]{x1D708}\frac{\text{d}u^{\ast }}{\text{d}{\tilde{y}}^{\ast }}+\left(\frac{1-\unicode[STIX]{x1D6FD}}{\unicode[STIX]{x1D70C}}\right){\unicode[STIX]{x1D70F}_{12}}^{\ast }},\end{eqnarray}$$
with
 ${\unicode[STIX]{x1D70F}_{12}}^{\ast }$
being the dimensional polymeric stress. All the simulations are performed at constant flow rate consistent with choosing
 $U_{b}$
as the characteristic velocity; the flow Reynolds number based on the bulk velocity is fixed at 2800, i.e.
 $Re=U_{b}h/\unicode[STIX]{x1D708}=2800$
, where the bulk velocity is the average value of the mean velocity computed across the whole domain occupied by the fluid phase. This choice facilitates the comparison between the Newtonian and viscoelastic flows. Since we are enforcing the constant-flow-rate condition, the appropriate instantaneous value of the streamwise pressure gradient is determined at every time step.
All the simulations are started from a fully developed turbulent duct flow without polymer additives. After the flow has reached statistical steady state, the calculations are continued for an interval of
 $400h/U_{b}$
time units, during which 400 full flow fields are stored for further statistical analysis. To verify the convergence of the statistics, we have computed them using different numbers of samples and verified that the differences are negligible.
2.3 Code validation
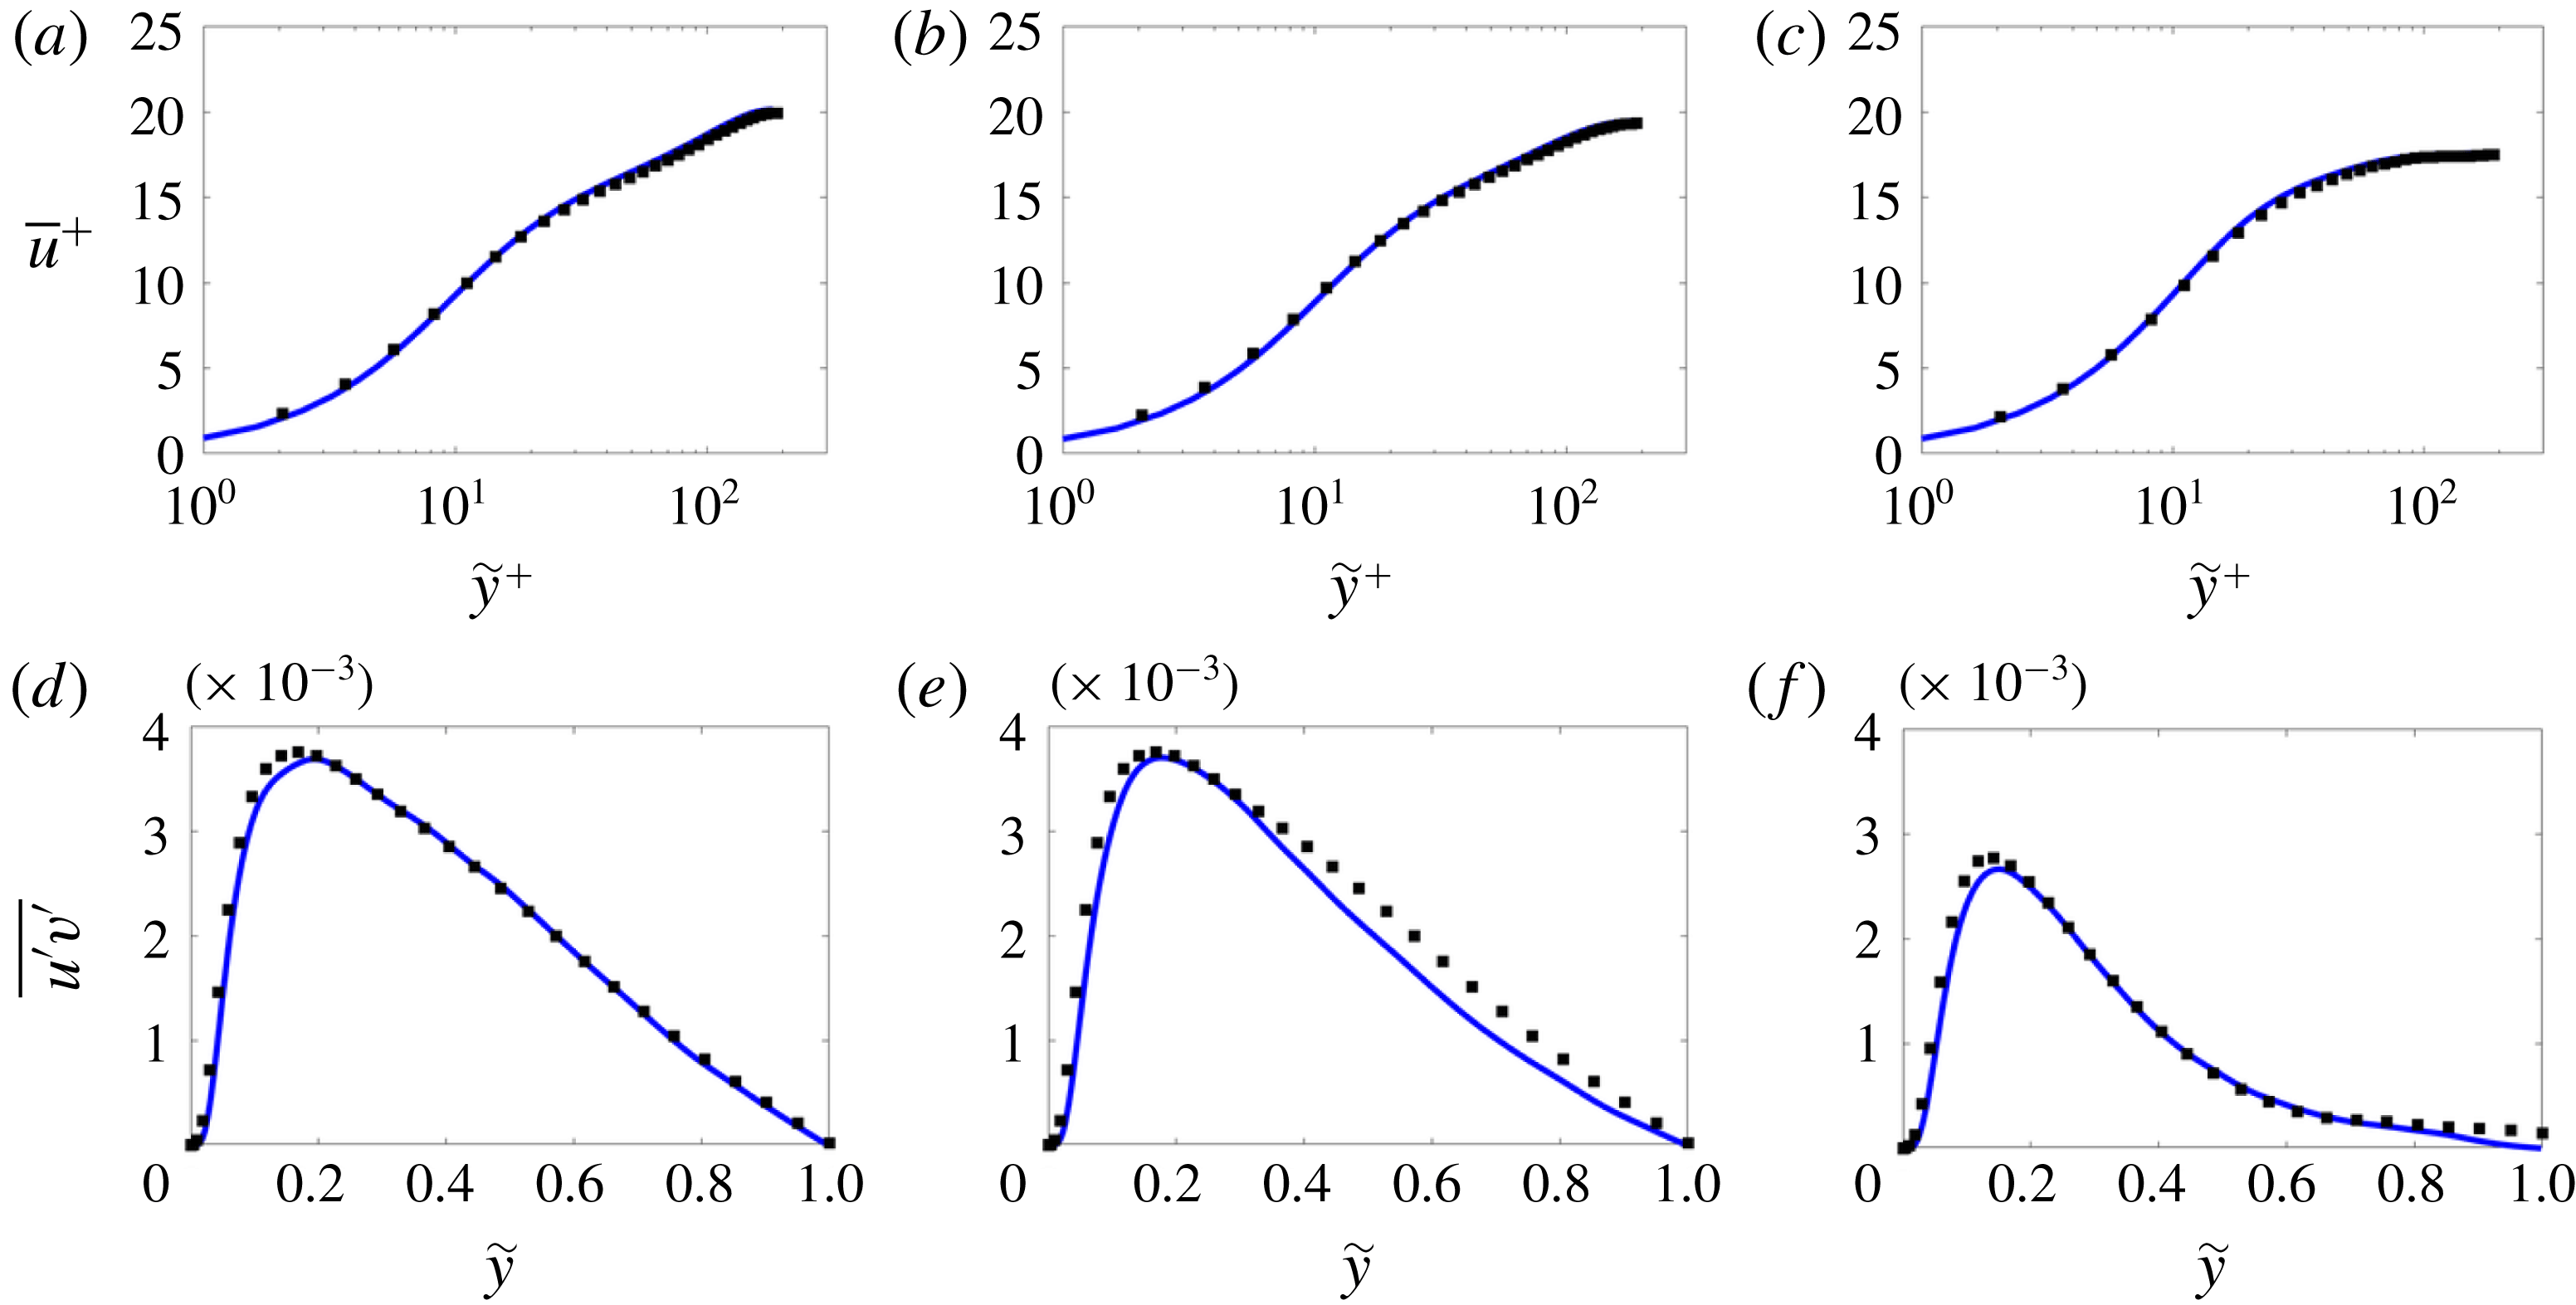
The code has been extensively validated in the past for turbulent flow simulations (Rosti & Brandt Reference Rosti and Brandt2017). Here, we provide one more comparison with literature results for the case of a turbulent duct flow. We compare our results of a Newtonian turbulent duct flow at
 $Re=2800$
with those reported by Uhlmann et al. (Reference Uhlmann, Pinelli, Kawahara and Sekimoto2007) and Pinelli et al. (Reference Pinelli, Uhlmann, Sekimoto and Kawahara2010) at a slightly higher Reynolds number,
 $Re=2900$
. Figure 2(a–c) shows the mean velocity profile in logarithmic scale and figure 2(d–f) shows the cross-term of the Reynolds stress tensor
 $u^{\prime }v^{\prime }$
as a function of the distance from the wall,
 ${\tilde{y}}$
. Three different sections are considered: the centreline
 $z=0$
, and
 $z=0.3h$
and
 $z=0.6h$
. Overall good agreement between the literature (shown with the black dots) and our results (shown with the blue solid line) is evident.
(a–c) Mean streamwise velocity component
 $u$
as a function of the wall-normal distance, indicated with
 ${\tilde{y}}$
, for the case of a Newtonian turbulent duct flow. (d–f) Mean
 $u^{\prime }v^{\prime }$
component of the Reynolds stress tensor profile in bulk units. Panels (a,d), (b,e) and (c,f) correspond to the sections
 $z=0$
,
 $0.3h$
and
 $0.6h$
, respectively. Blue solid lines are used for our numerical results, while the black dots are the results from Uhlmann et al. (Reference Uhlmann, Pinelli, Kawahara and Sekimoto2007) and Pinelli et al. (Reference Pinelli, Uhlmann, Sekimoto and Kawahara2010).

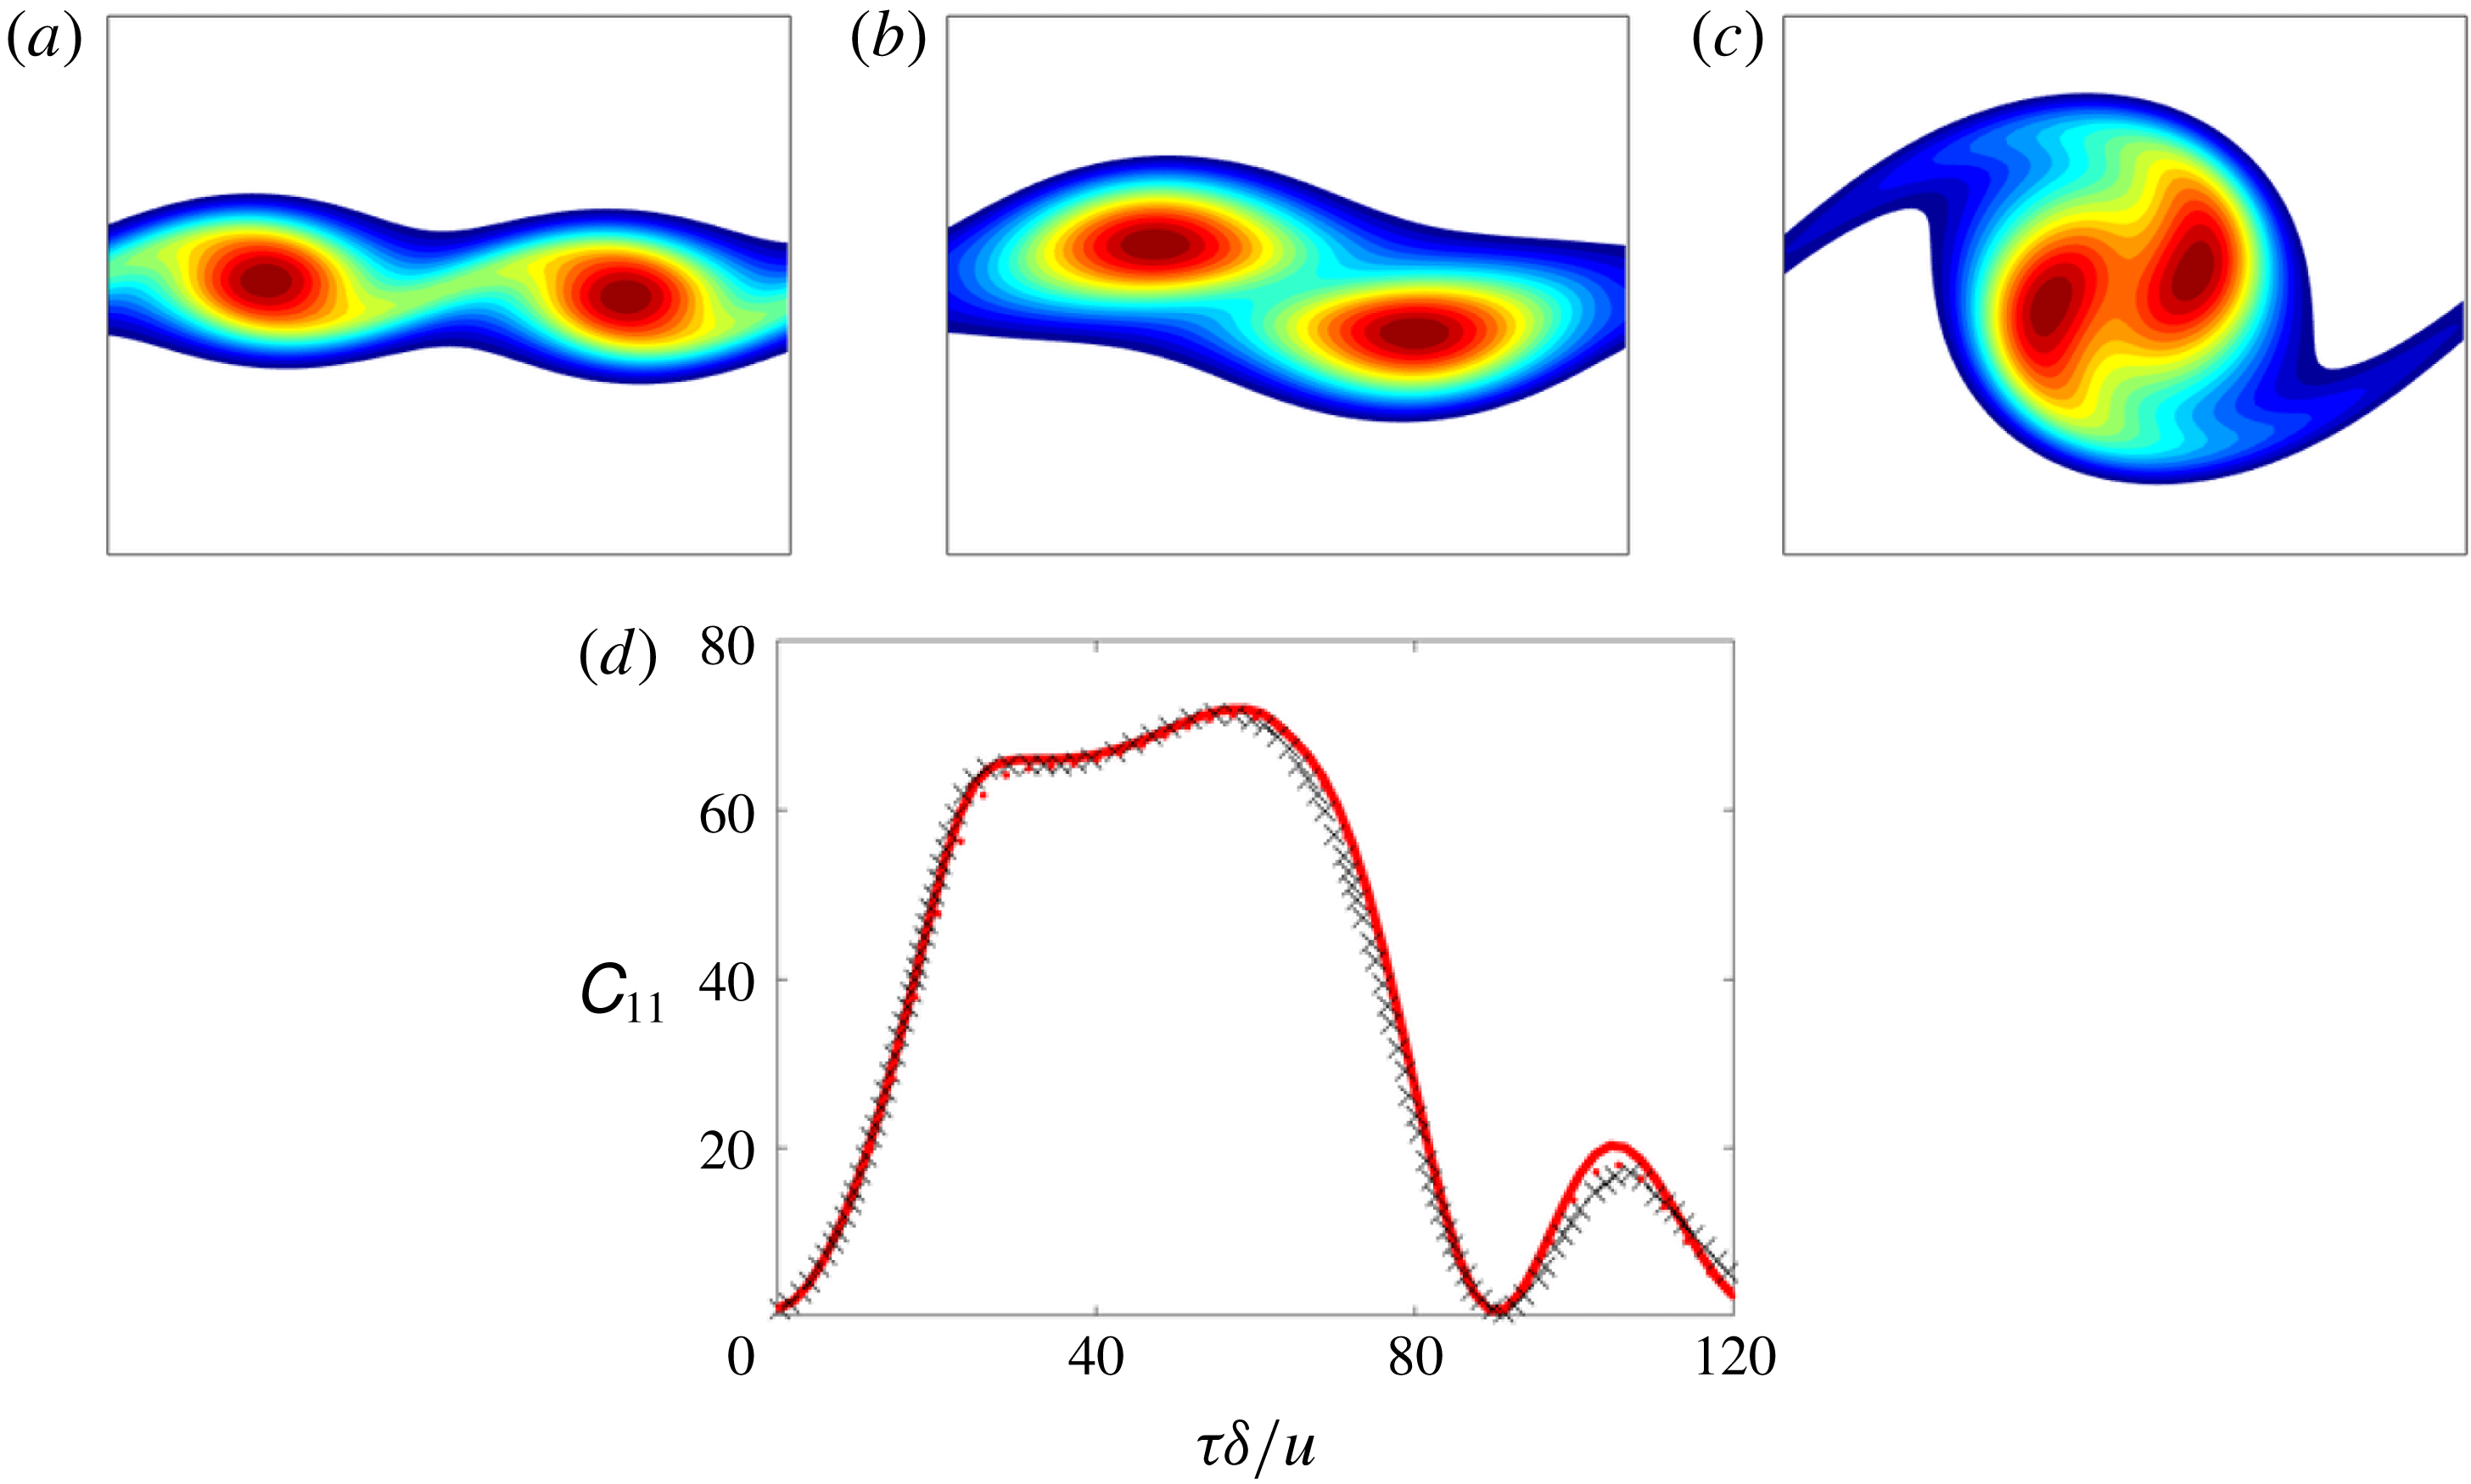
(a–c) Instantaneous contours of the absolute value of vorticity at times
 $t\approx 20\unicode[STIX]{x1D6FF}/\unicode[STIX]{x0394}u$
,
 $60\unicode[STIX]{x1D6FF}/\unicode[STIX]{x0394}u$
and
 $100\unicode[STIX]{x1D6FF}/\unicode[STIX]{x0394}u$
, respectively. The colour scale from blue to red ranges from 0.05 to 0.4 in (a), from 0.05 to 0.3 in (b) and from 0.05 to 0.25 in (c). (d) Time evolution of the
 $\unicode[STIX]{x1D60A}_{11}$
component of the polymer conformation tensor. The solid red line displays our numerical results, while the crosses are those by Min et al. (Reference Min, Yoo and Choi2001).

The FENE-P model implementation has been validated by simulating a viscoelastic temporally evolving mixing layer flow and by comparing our results with those provided by Min et al. (Reference Min, Yoo and Choi2001). We consider an initial velocity field defined as
 $u=0.5\tanh y$
, and trigger the roll-up of the shear layer with a small two-dimensional perturbation. The characteristic velocity and length scales are
 $\unicode[STIX]{x0394}u=u_{max}-u_{min}$
and
 $\unicode[STIX]{x1D6FF}=\unicode[STIX]{x0394}u/(\text{d}u/\text{d}y)_{max}$
, respectively. The Reynolds number is fixed at
 $Re=\unicode[STIX]{x1D6FF}\unicode[STIX]{x0394}u/\unicode[STIX]{x1D708}=50$
(
 $\unicode[STIX]{x1D708}$
being the total kinematic viscosity) and the Weissenberg number
 $Wi=\unicode[STIX]{x1D706}\unicode[STIX]{x0394}u/\unicode[STIX]{x1D6FF}=25$
; moreover, the extensibility
 $L^{2}$
is set to 100, and the ratio of polymeric and solvent viscosity is set to 0.1. The two-dimensional numerical domain has size
 $30\unicode[STIX]{x1D6FF}\times 100\unicode[STIX]{x1D6FF}$
, discretised by
 $128\times 384$
grid points. Note that the flow configuration and domain are the same as used by Min et al. (Reference Min, Yoo and Choi2001). Figure 3(a–c) shows instantaneous vorticity contours for the flow, where we can observe that the initial perturbation grows in time and generates two vortices (panel (a),
 $t\approx 20\unicode[STIX]{x1D6FF}/\unicode[STIX]{x0394}u$
), which roll up (panel (b),
 $t\approx 60\unicode[STIX]{x1D6FF}/\unicode[STIX]{x0394}u$
) and eventually merge into one large vortex (panel (c),
 $t\approx 100\unicode[STIX]{x1D6FF}/\unicode[STIX]{x0394}u$
). The quantitative validation is shown in figure 3(d), where we plot the time history of
 $\unicode[STIX]{x1D60A}_{xx}$
in the centre of the domain: crosses are used for the literature results, whereas the red solid line indicates our numerical data. As shown by Min et al. (Reference Min, Yoo and Choi2001), different numerical schemes provide slightly different amplitudes of the maxima of
 $\unicode[STIX]{x1D60A}_{11}$
, with lower values for highly dissipating schemes or with the inclusion of artificial numerical dissipation; in our simulation, we use the high-order WENO scheme for the advection of the conformation tensor and neglect any artificial dissipation, and we find good agreement of the deformation time history over the whole vortex merging process (Rosti & Brandt Reference Rosti and Brandt2017; De Vita et al.
Reference De Vita, Rosti, Izbassarov, Duffo, Tammisola, Hormozi and Brandt2018; Izbassarov et al.
Reference Izbassarov, Rosti, Niazi Ardekani, Sarabian, Hormozi, Brandt and Tammisola2018; Rosti et al.
Reference Rosti, Izbassarov, Tammisola, Hormozi and Brandt2018c
).
3 Results
We study turbulent duct flows with polymers and start our analysis by considering two cases at
 $Re=2800$
(based on the bulk velocity
 $U_{b}$
, duct half-height
 $h$
and total kinematic viscosity
 $\unicode[STIX]{x1D708}$
), Newtonian fluid and viscoelastic fluid consisting of a suspension of polymers as introduced in the previous section. The chosen polymer solution is characterised by the following parameters:
 $\unicode[STIX]{x1D6FD}=0.9$
,
 $L^{2}=3600$
and
 $Wi=1.5$
(
 $Wi_{\unicode[STIX]{x1D70F}_{0}}=\unicode[STIX]{x1D706}u_{\unicode[STIX]{x1D70F}_{0}}^{2}/\unicode[STIX]{x1D708}=18$
, with
 $u_{\unicode[STIX]{x1D70F}_{0}}$
being the friction velocity of the Newtonian simulation). Using the previous set of parameters, the Newtonian case has an average friction Reynolds number
 $Re_{\unicode[STIX]{x1D70F}}$
equal to 183, while the polymer one provides a value of 155, which corresponds to a drag reduction
 $DR$
of approximately 29 %, computed as
 $DR=-\unicode[STIX]{x0394}\unicode[STIX]{x1D70F}_{w}/\unicode[STIX]{x1D70F}_{w0}$
, where
 $\unicode[STIX]{x0394}\unicode[STIX]{x1D70F}_{w}=\unicode[STIX]{x1D70F}_{w}-\unicode[STIX]{x1D70F}_{w0}$
, with
 $\unicode[STIX]{x1D70F}_{w}$
being the total shear stress at the wall (as in the computation of the friction velocity), averaged over all four sides, and
 $\unicode[STIX]{x1D70F}_{w0}$
the value for the Newtonian case. The Newtonian results will be represented hereafter in blue and the polymer ones in red.
3.1 Flow statistics
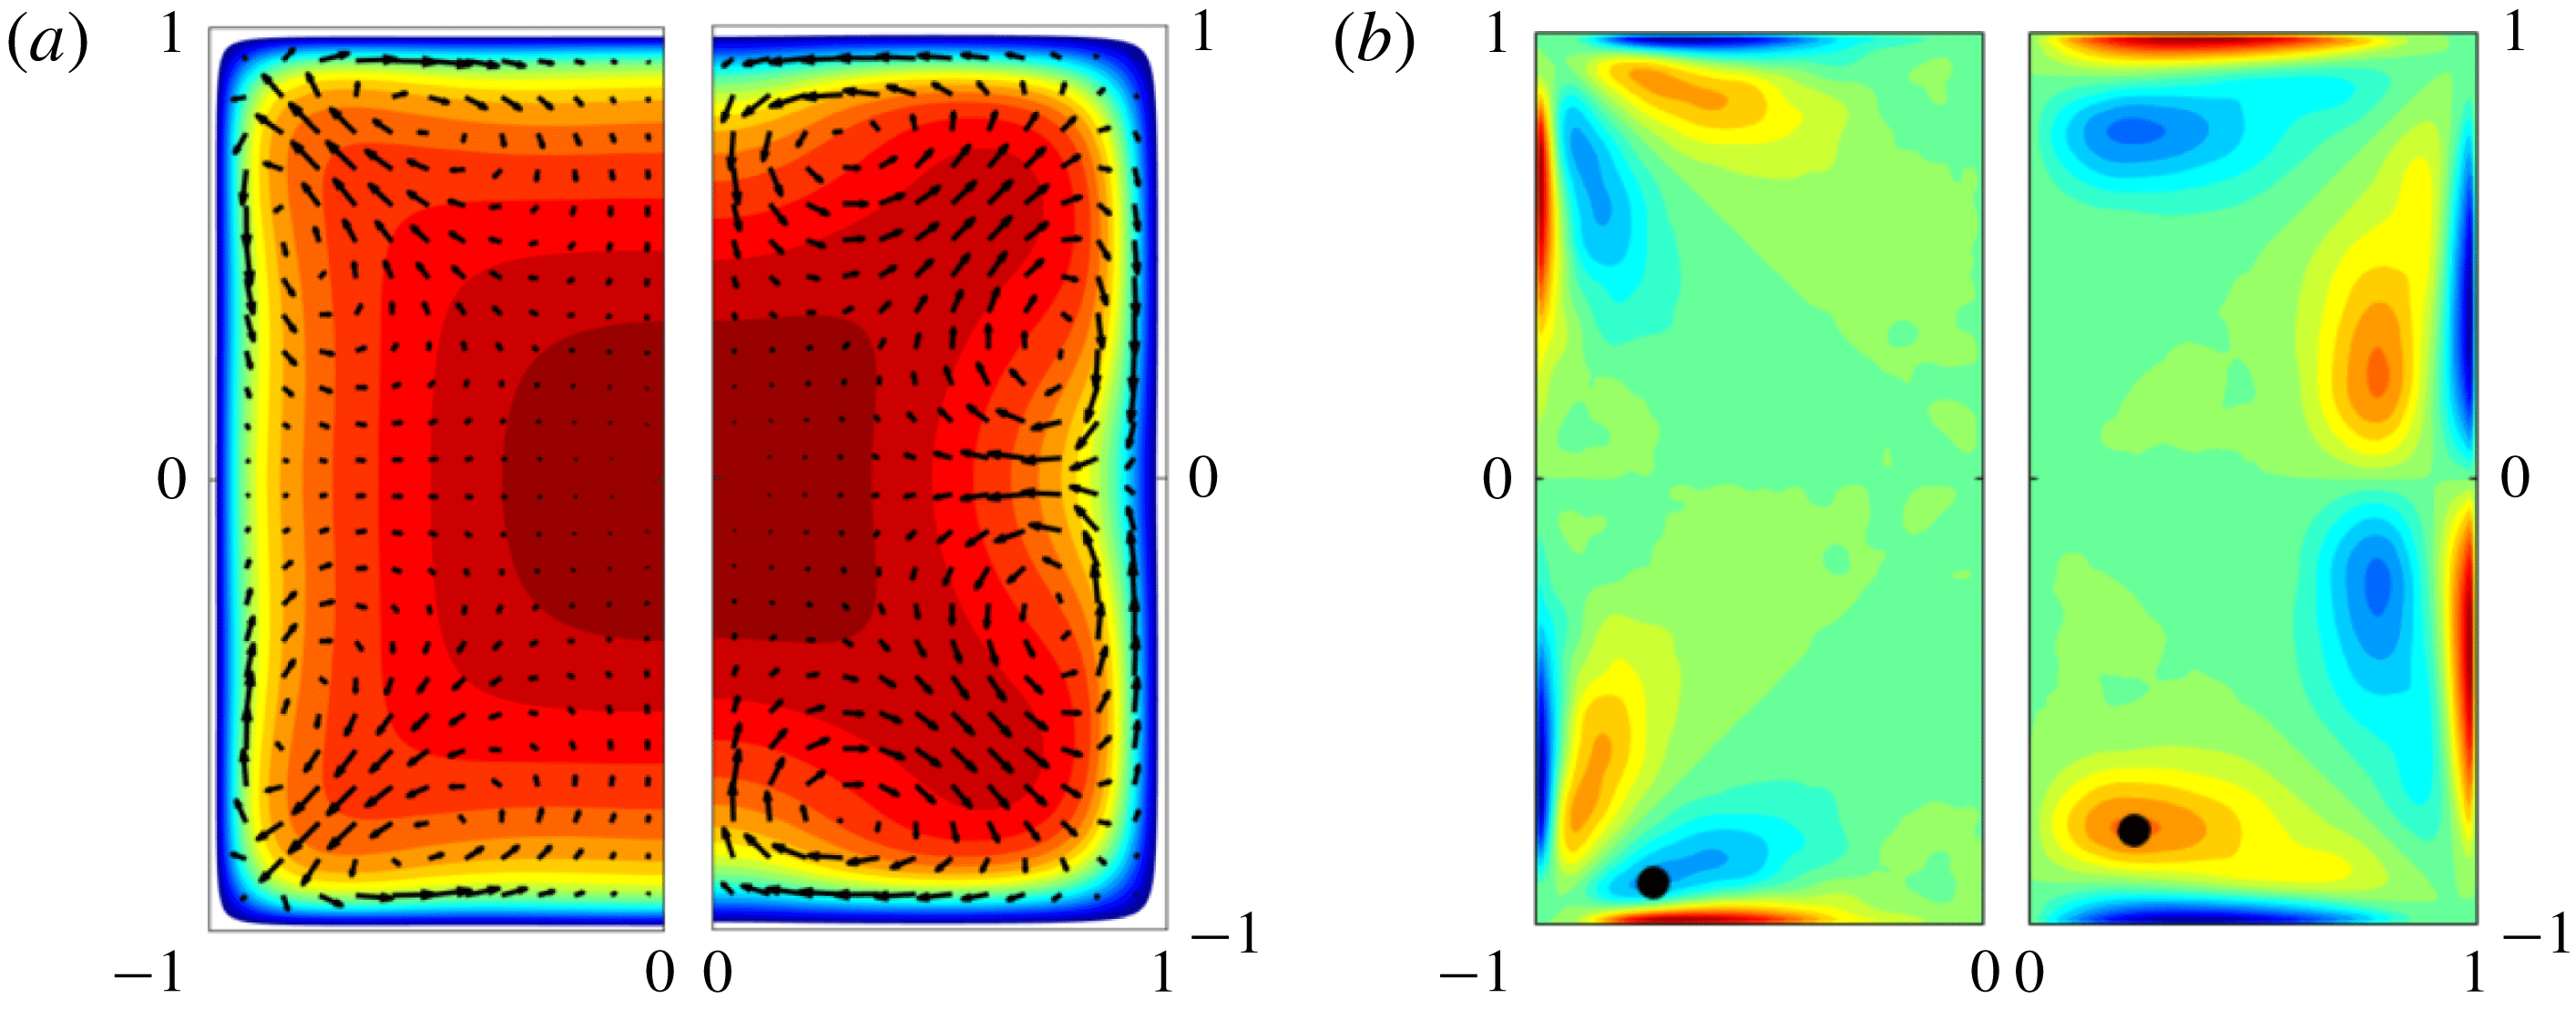
Contours of the mean streamwise component of (a) velocity
 $\overline{u}$
and (b) vorticity
 $\overline{\unicode[STIX]{x1D714}}_{x}$
. In each panel, the left (right) half of the duct is used for the Newtonian (viscoelastic) fluid, respectively. The colour scale ranges from 0 (blue) to
 $1.4U_{b}$
(red) in (a), and from
 $-0.5U_{b}/h$
(blue) to
 $0.5U_{b}/h$
(red) in (b). Panel (a) also reports the in-plane mean velocity with arrows.

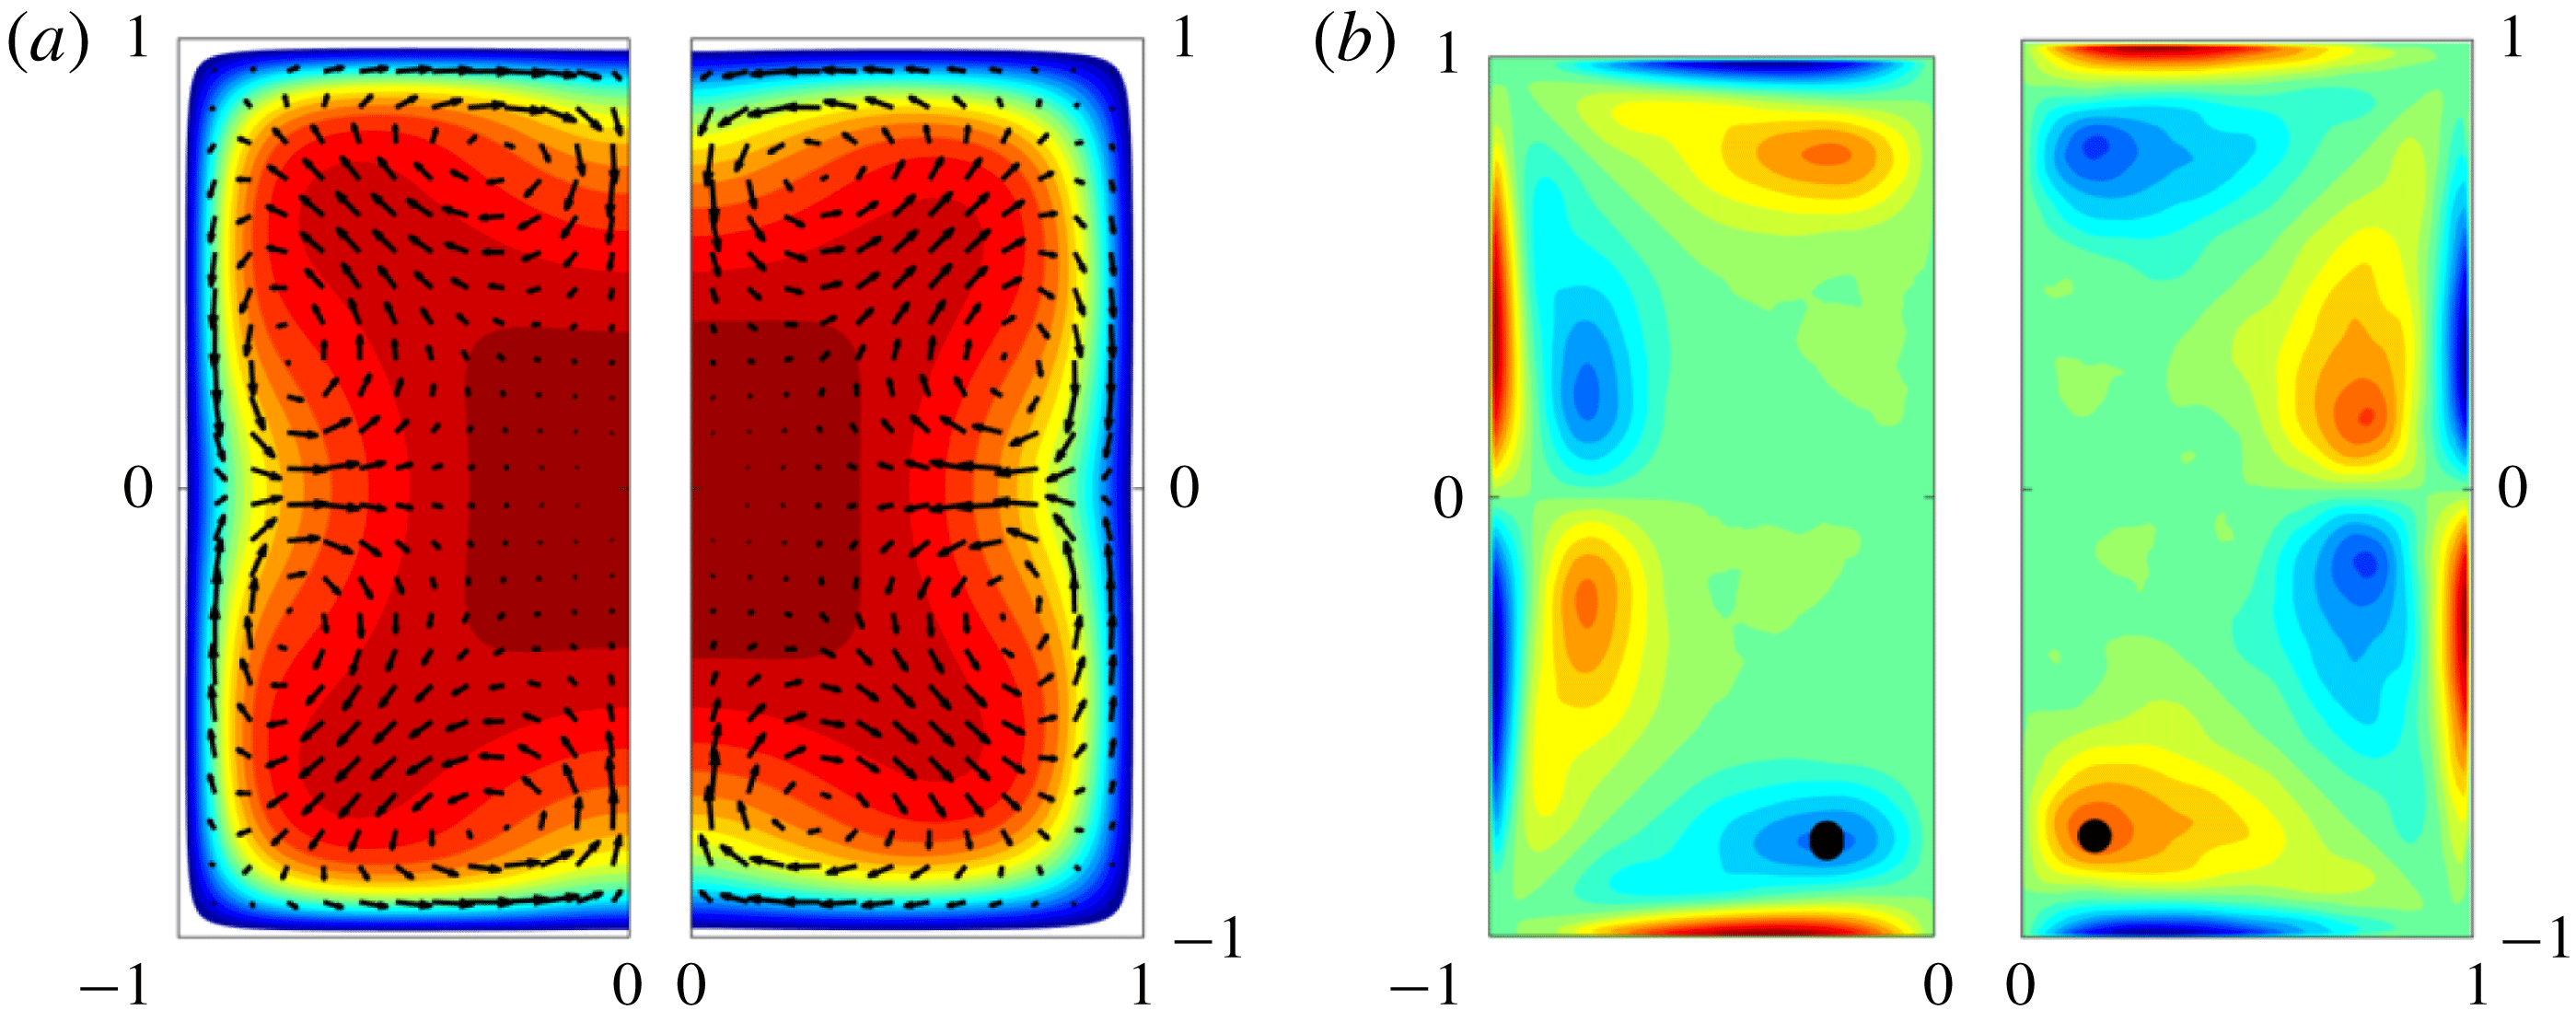
Figure 4 shows the contours of (a) the mean streamwise velocity component
 $\overline{u}$
and (b) the mean streamwise vorticity component
 $\overline{\unicode[STIX]{x1D714}}_{x}$
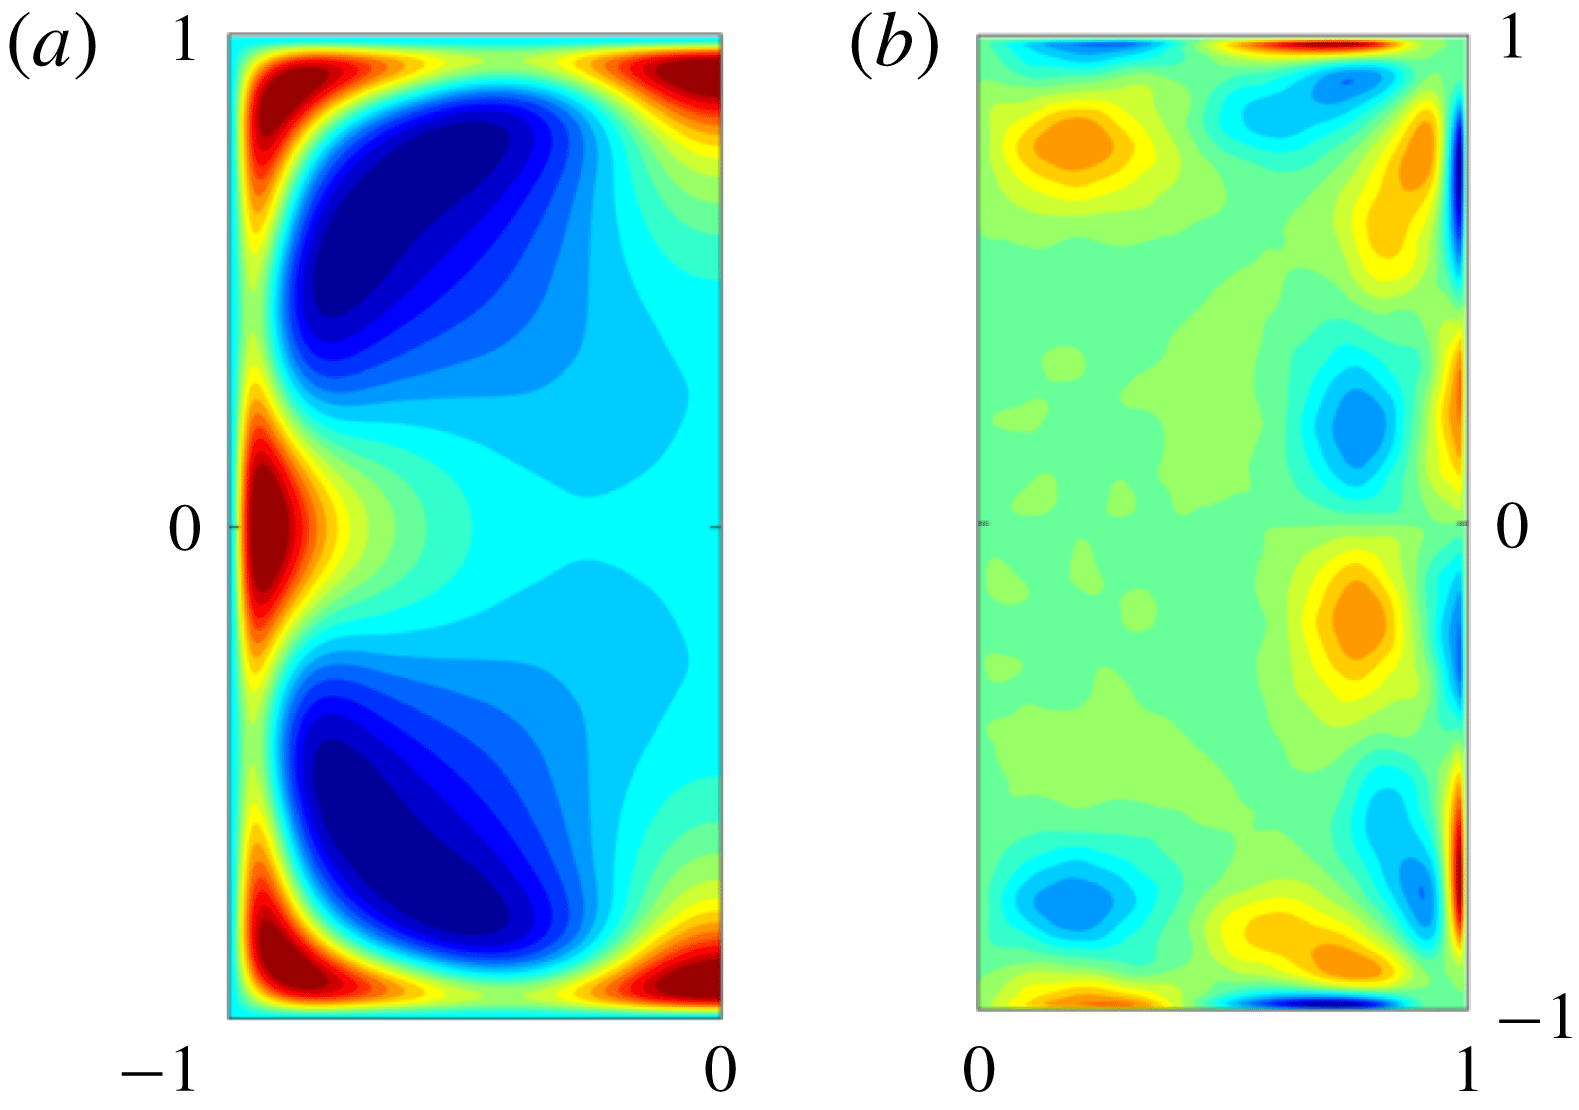
, where, in each panel, the left half of the duct reports the data for the Newtonian flow, whereas the right half is for the viscoelastic counterpart. For more clarity, figure 5 shows the difference between the Newtonian and viscoelastic flows. The Newtonian case shows the streamwise velocity contour typical of a duct flow, characterised by the symmetry inherited from the considered geometry. The maximum streamwise velocity is located at the centre of the duct and equals
 $1.3U_{b}$
. The streamwise vorticity displays the in-plane secondary flow typical of turbulent duct flows: eight regions (four in the half-section shown) can be easily identified with alternate sign of vorticity, located symmetrically with respect to the horizontal and vertical lines passing through the centre and with the two diagonals. In particular, in figure 4 we mark with a filled black circle the location of one of the maxima of the vorticity, which we find at
 $y=-0.74h$
,
 $z=-0.9h$
in the Newtonian case. In the polymeric flows, the streamwise velocity and vorticity components are altered (see figure 5): indeed, the two flows differ mainly in the near-wall region, with strong differences in the streamwise velocity close to the corners. The difference in the streamwise vorticity component is mostly concentrated along the edges. In particular, the streamwise velocity contour exhibits higher values close to the corners and, at the same time, the secondary flow is modified, with the locations of the maximum vorticity moving towards the centre, i.e. they are displaced away from the walls. In fact, the coordinates of the selected maximum vorticity become
 $y=0.23h$
,
 $z=0.78h$
. The magnitude of the vorticity maxima are also modified, reducing by 20 % from
 $0.29U_{b}/h$
in the Newtonian fluid to
 $0.23U_{b}/h$
in the presence of polymers, while the overall integral of the vorticity in each of the eight sectors increases by 17 % from
 $0.023U_{b}/h$
in the Newtonian flow to
 $0.027U_{b}/h$
in the viscoelastic one. Thus, although the peak value of the in-plane vorticity is reduced, overall it is enhanced by the polymer addition due to an enlargement of the area with non-zero vorticity. The modification of the secondary flow is further analysed by the maximum of the magnitude of
 $\overline{v}$
in the domain; indeed, this slightly decreases from approximately
 $0.019U_{b}$
in the Newtonian flow to
 $0.018U_{b}$
in the polymer solution.
Contours of the difference of the mean streamwise component of (a) the velocity
 $\overline{u}$
and (b) the vorticity
 $\overline{\unicode[STIX]{x1D714}}_{x}$
between the Newtonian and viscoelastic fluids. The colour scale ranges from
 $-0.2$
(blue) to
 $0.2U_{b}$
(red) in (a) and from
 $-0.5U_{b}/h$
(blue) to
 $0.5U_{b}/h$
(red) in (b).

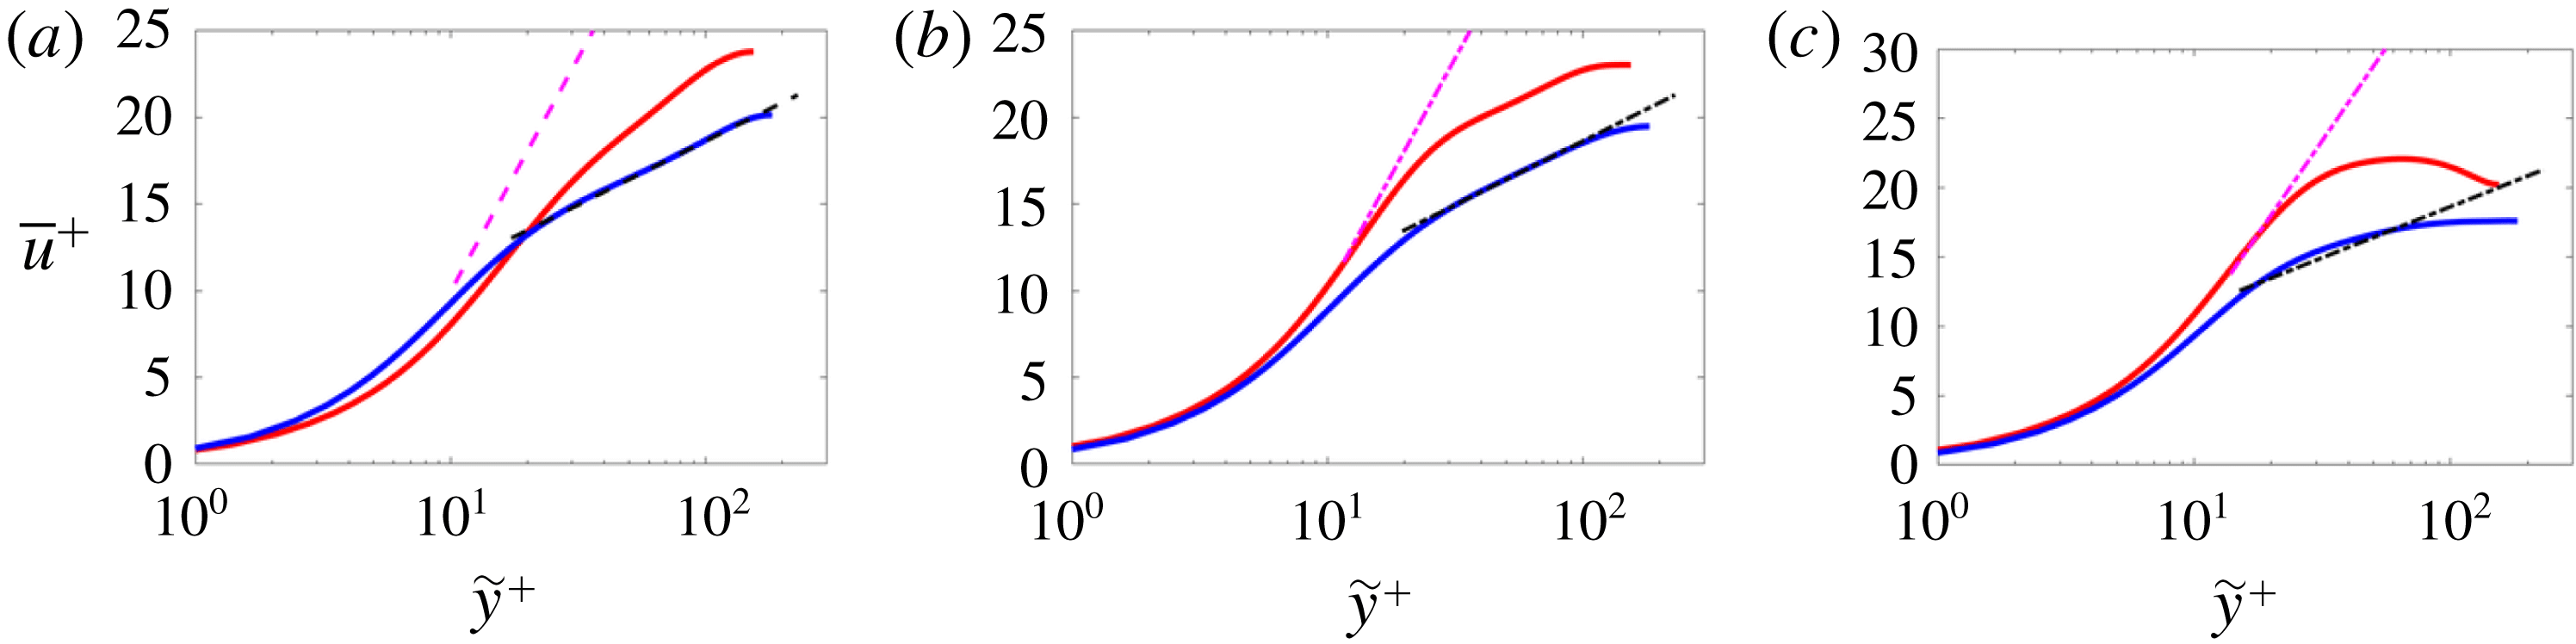
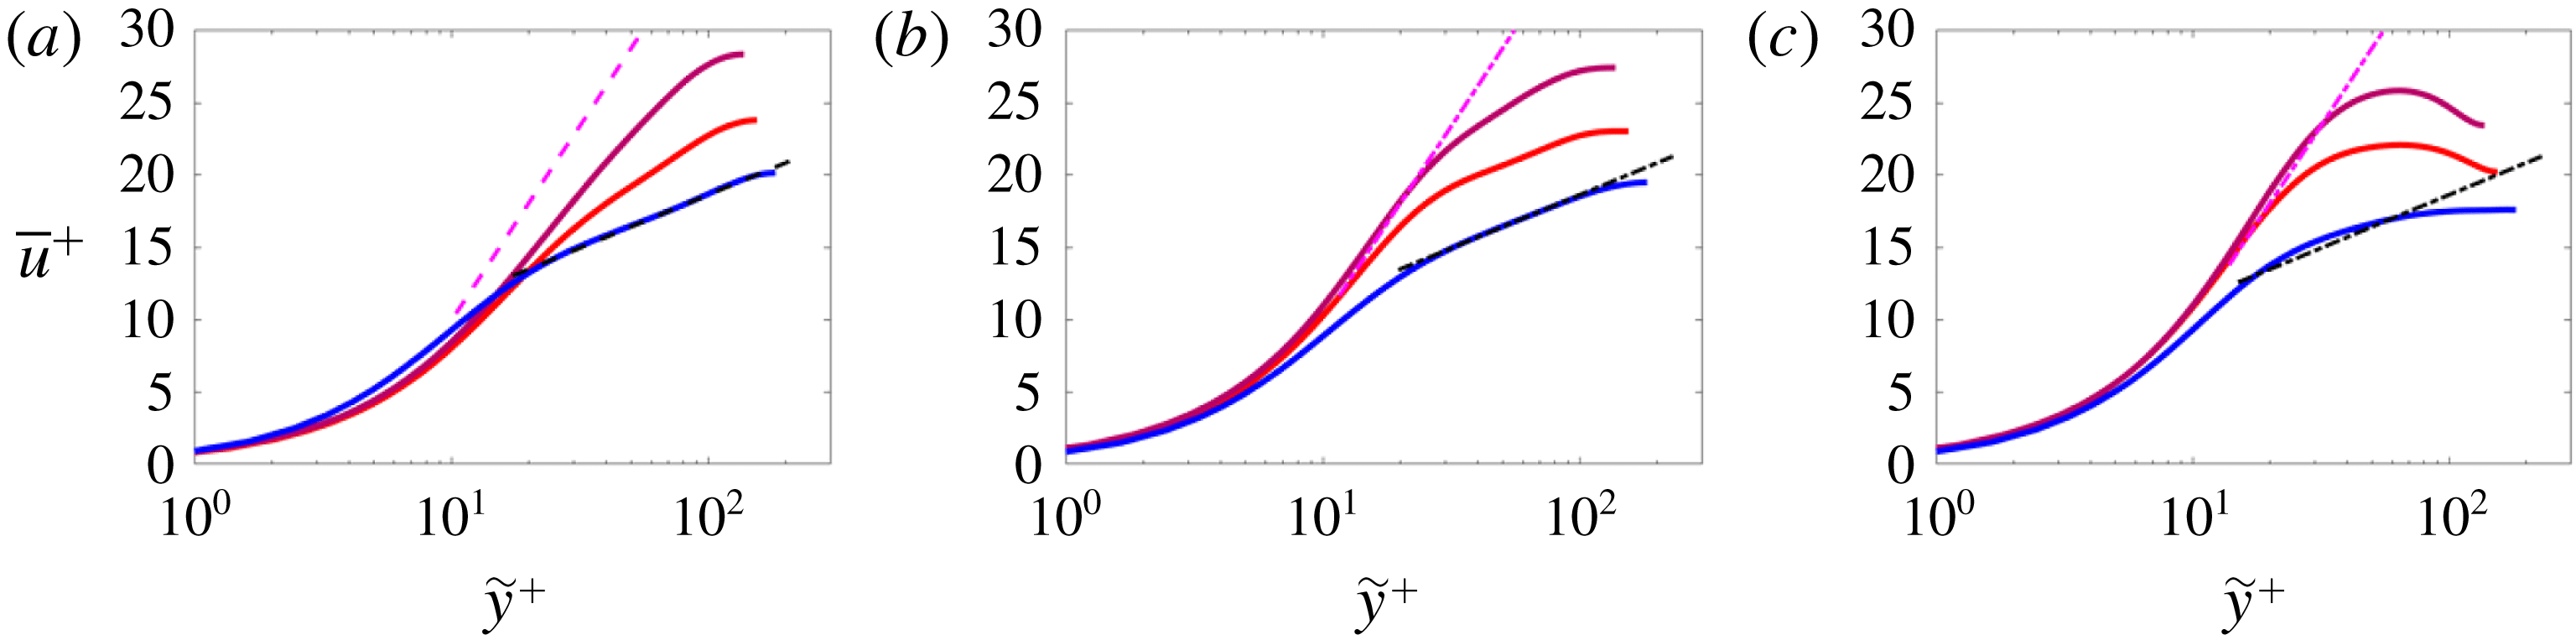
Mean streamwise velocity as a function of the wall-normal distance in logarithmic scale and wall units. The blue and red lines are used for the numerical results without and with polymers. The magenta dashed line is the polymer maximum drag reduction (Virk Reference Virk1975; Lvov et al.
Reference Lvov, Pomyalov, Procaccia and Tiberkevich2004) while the black dashed line is the Newtonian log law. The panels correspond to different sections: (a)
 $z=0$
, (b)
 $z=0.3h$
and (c)
 $z=0.6h$
.

Figure 6 shows the mean streamwise velocity component
 $\overline{u}$
as a function of the wall-normal distance
 $\widetilde{y}$
(both in wall units). Figure 6 shows (a) the mean velocity profile in the midplane (
 $z=0$
), (b) the velocity at
 $z=0.3h$
and (c) the velocity at
 $z=0.6h$
. In the midplane, where the secondary flow is weak, we can identify three regions in the velocity profile of the Newtonian fluid (figure 6
a) similarly to what is found for a turbulent channel flow: first, the viscous sublayer for
 $\widetilde{y}^{+}<5$
where the variation of
 $\overline{u}^{+}$
with
 $\widetilde{y}^{+}$
is approximately linear; then, the so-called log-law region,
 $\widetilde{y}^{+}>30$
, where the variation of
 $\overline{u}^{+}$
versus
 $\widetilde{y}^{+}$
is logarithmic; finally, the region between 5 and 30 wall units is called the buffer layer and neither laws hold. As we approach the sidewalls,
 $x=0.3h$
and
 $0.6h$
, the range of the equilibrium layer where the velocity profile is logarithmic reduces (figure 6
b), eventually disappearing (figure 6
c). The profiles have similar trends for the viscoelastic fluid, in which case, however, the inertial range has an upward shift, consistent with the observed drag reduction (Warholic et al.
Reference Warholic, Massah and Hanratty1999). Note that all the data stay below the MDR curve (Virk Reference Virk1975; Lvov et al.
Reference Lvov, Pomyalov, Procaccia and Tiberkevich2004), a limit curve approached only in the case of very high
 $Wi$
, shown as the magenta dashed line in figure 6.
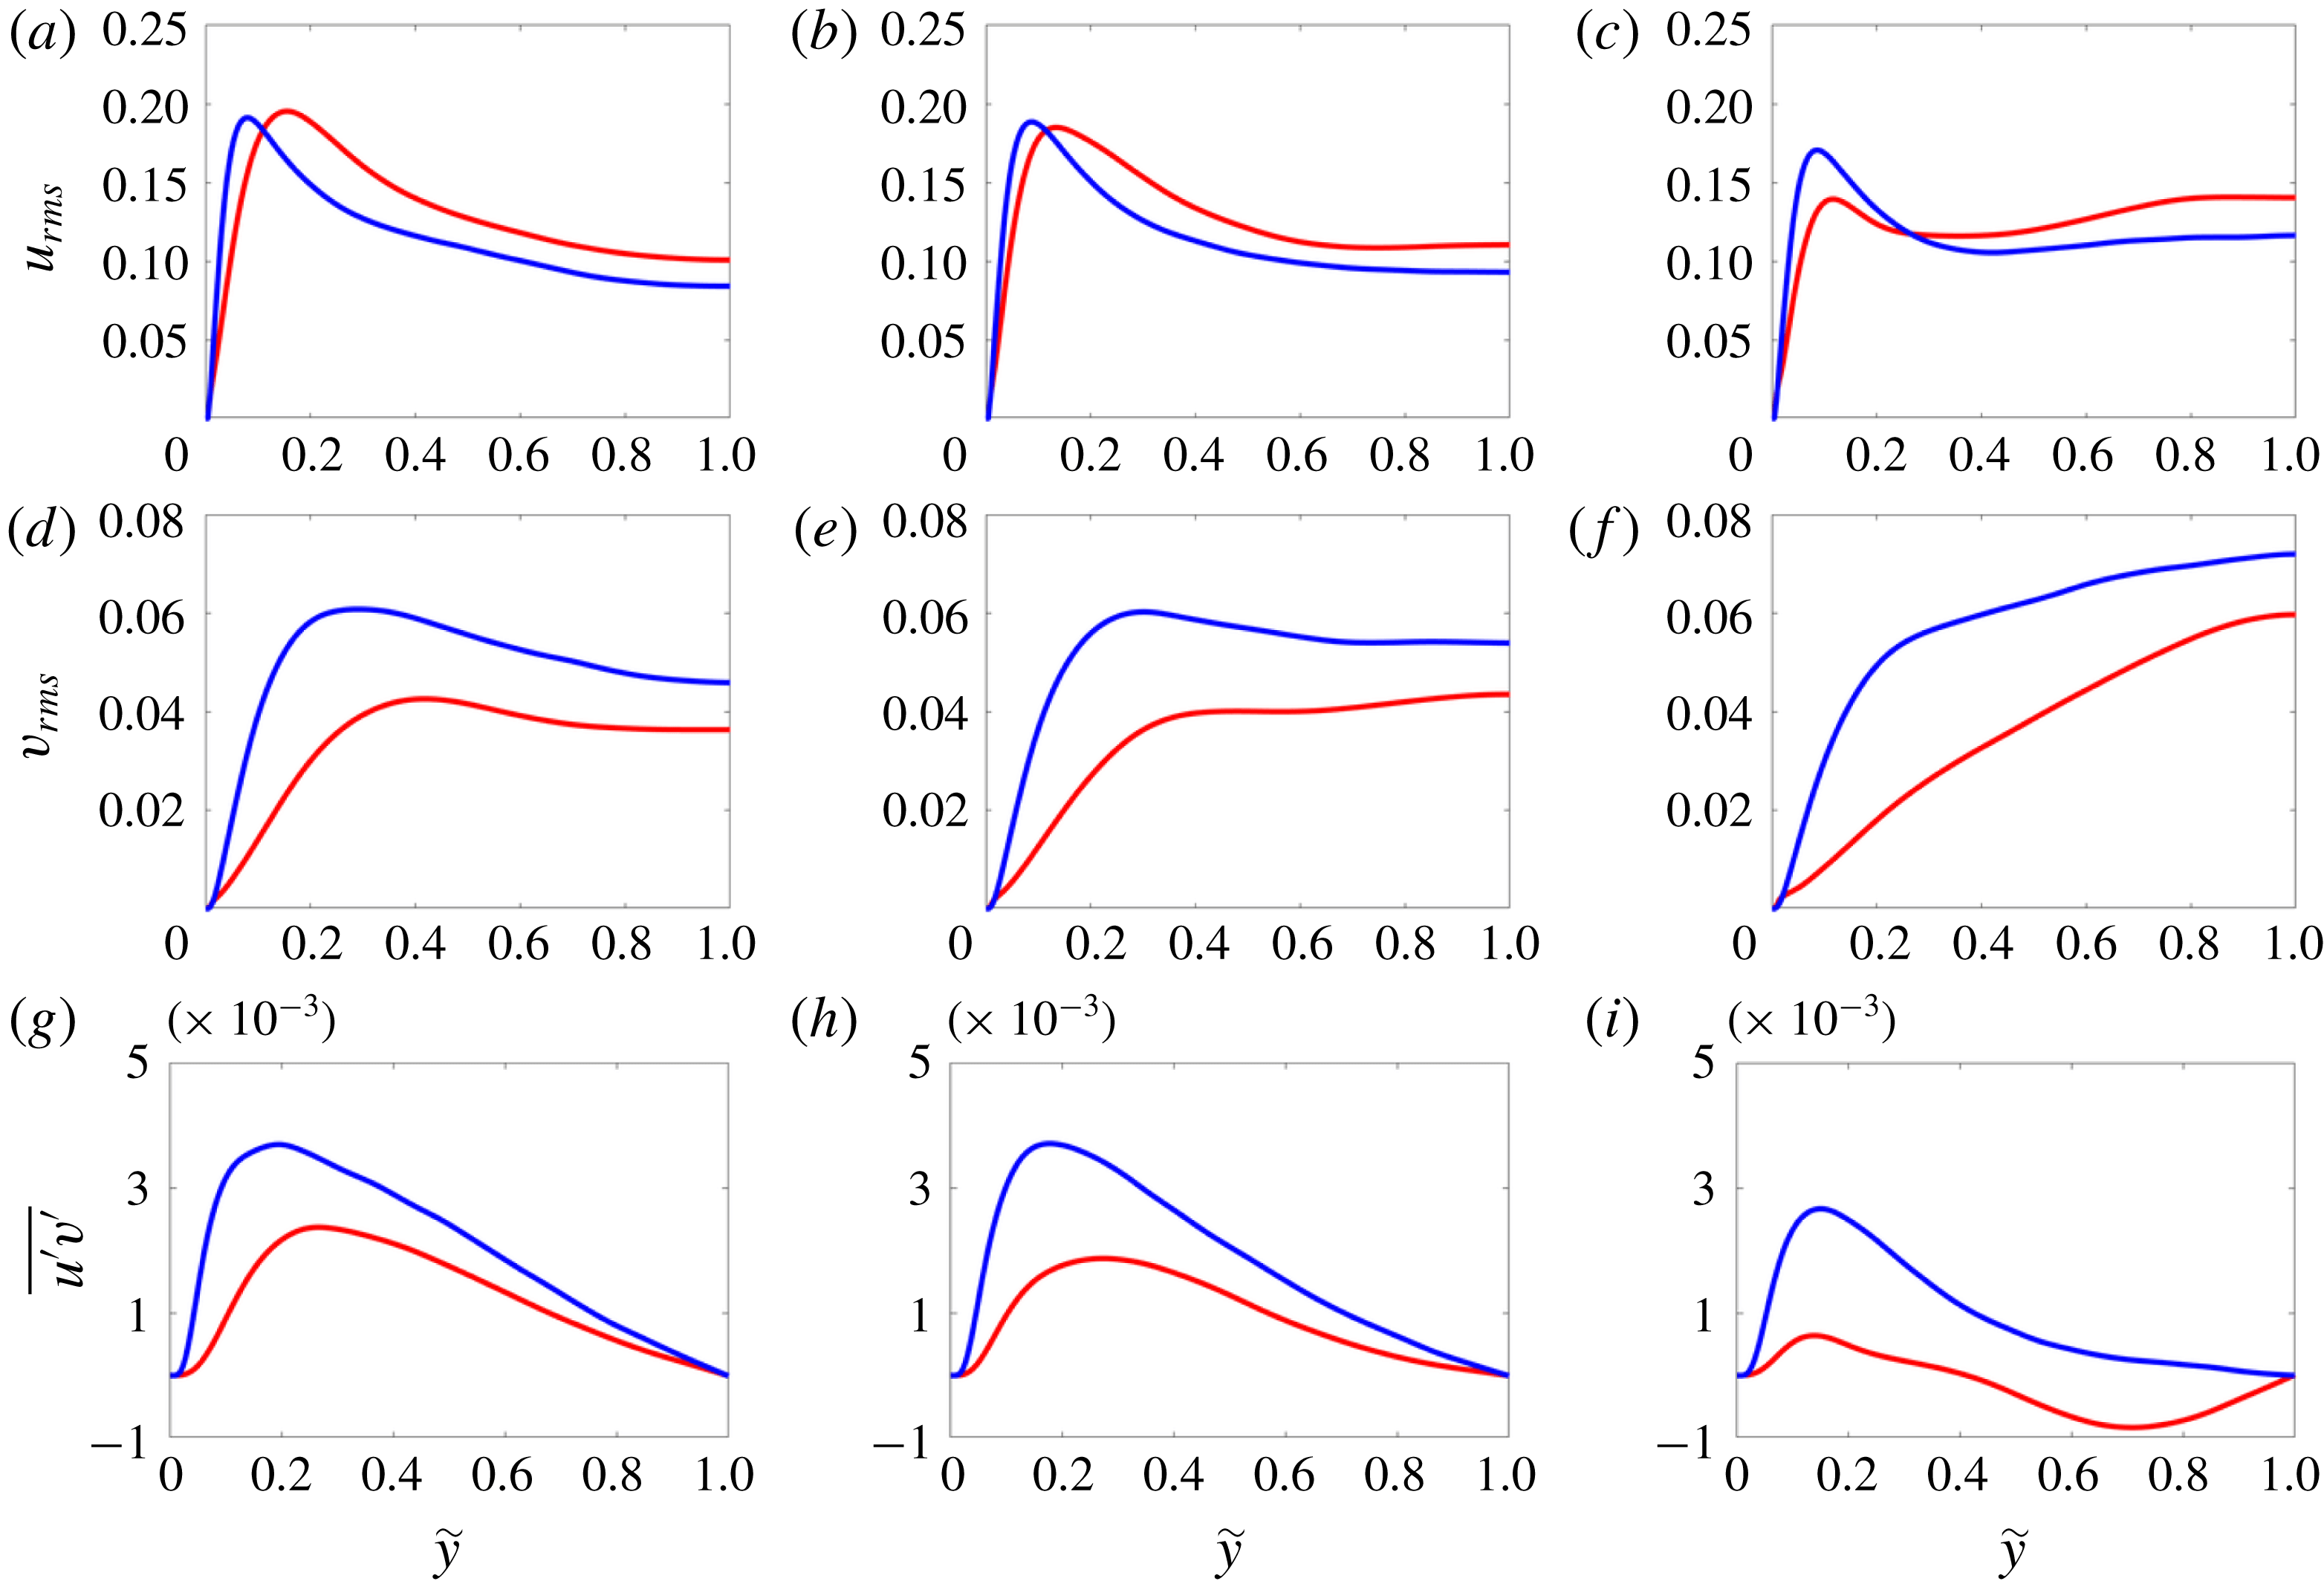
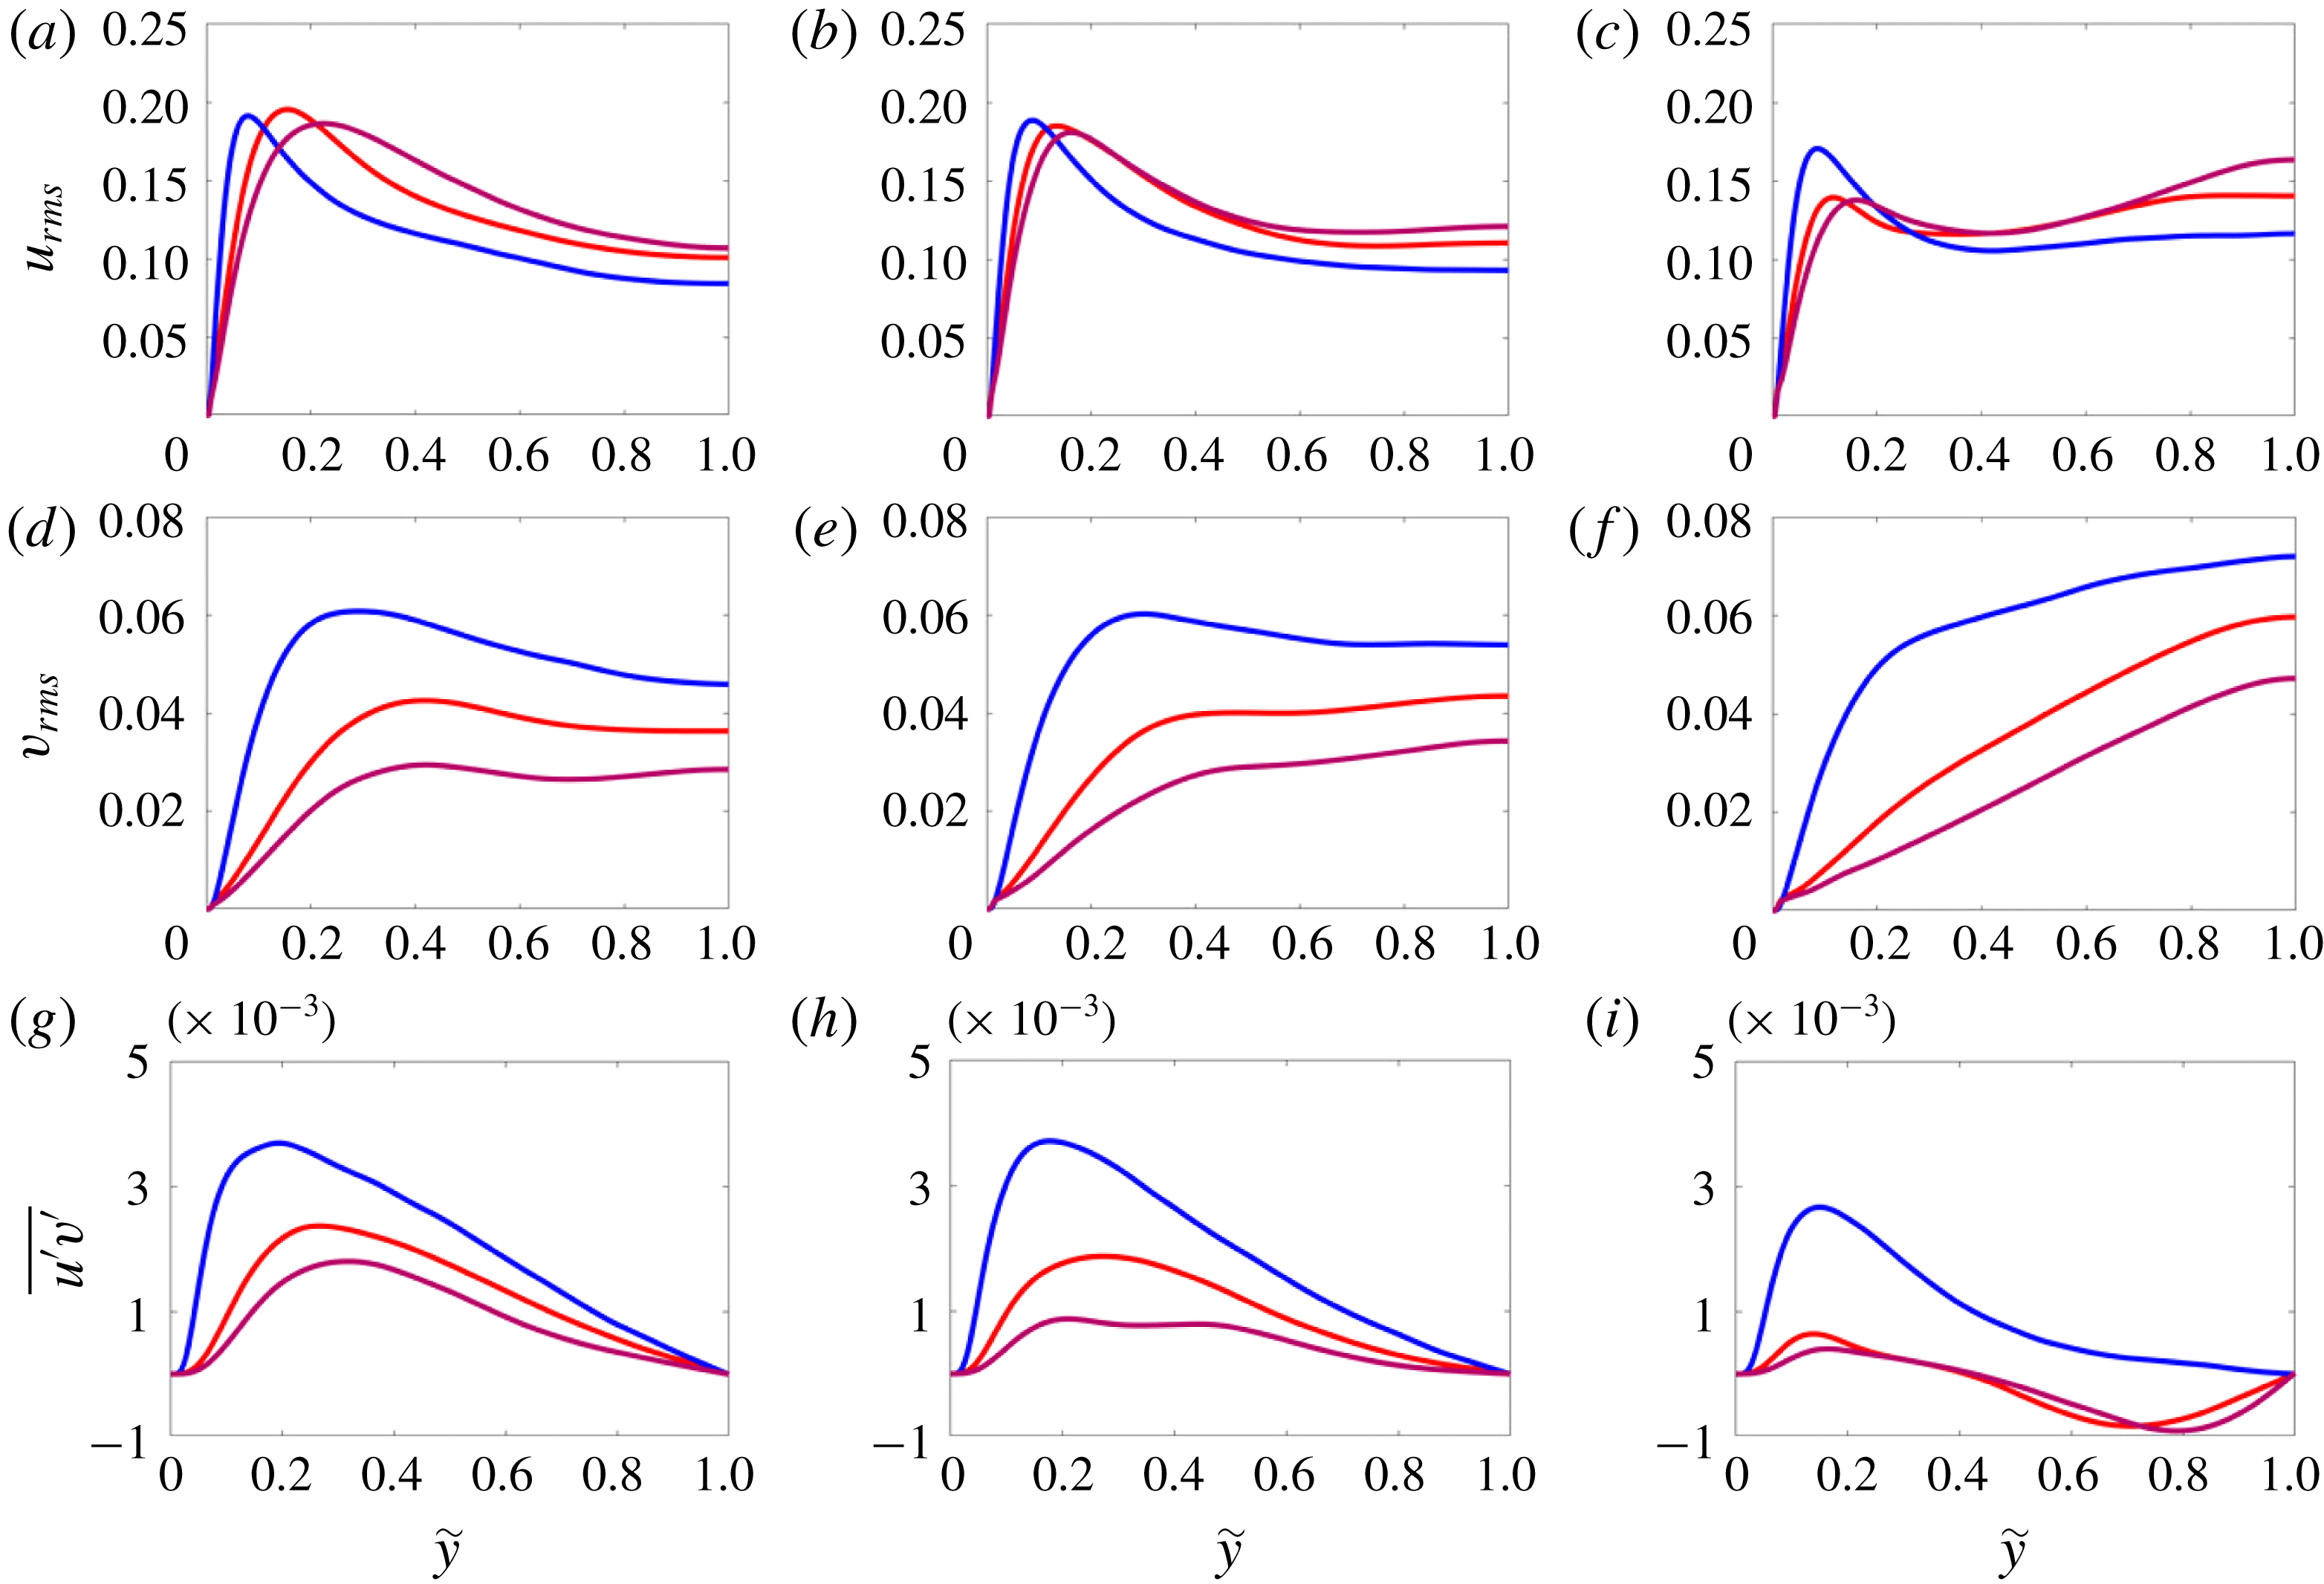
Wall-normal mean profile of (a–c) the streamwise r.m.s. velocity fluctuation, (d–f) the wall-normal r.m.s. velocity fluctuation, and (g–i) the cross-term of the Reynolds stress tensor
 $u^{\prime }v^{\prime }$
. The columns correspond to different sections: (a,d,g)
 $z=0$
, (b,e,h)
 $z=0.3h$
and (c,f,i)
 $z=0.6h$
. The line and colour style is the same as in figure 6.

Figure 7 displays the velocity fluctuation profile as a function of the wall-normal distance
 $\widetilde{y}$
. In particular, figure 7(a–c) reports the root mean square (r.m.s.) of the streamwise component of the velocity fluctuations
 $u_{rms}$
, figure 7(d–f) shows the r.m.s. of one of the wall-normal components
 $v_{rms}$
, and figure 7(g–i) displays the cross-term of the Reynolds stress tensor,
 $u^{\prime }v^{\prime }$
. The Newtonian case shows a peak of
 $u_{rms}$
close to the wall, with slightly different values in the three sections, decreasing when moving from the midplane towards the sidewalls. Away from the wall, the streamwise velocity fluctuations reach a plateau with a local minimum whose amplitude is approximately half the peak value in the centreline. On the other hand, the wall-normal velocity fluctuations have a weak maximum close to the wall in the centreline, which then decreases at
 $z=0.3h$
, and eventually disappears at
 $z=0.6h$
, when approaching the corners. The flow with polymers displays similar r.m.s. profiles; however, the peaks of both
 $u_{rms}$
and
 $v_{rms}$
are located further away from the wall; also, a strong decrease in the wall-normal fluctuation
 $v_{rms}$
is observed in all sections, whereas an increase in the streamwise component is evident only close to the centreline, as observed in-plane channels. Finally, we consider the cross-term of the Reynolds stress tensor
 $u^{\prime }v^{\prime }$
; the profiles show a peak close to the wall and a value approaching zero towards the centreline due to symmetry. The profile at
 $z=0.3h$
has a lower peak, and still decreases monotonically after its maximum value; on the other hand, the Reynolds stress
 $u^{\prime }v^{\prime }$
closer to the sidewalls,
 $z=0.6h$
, goes to zero rapidly and remains approximately zero until
 ${\tilde{y}}=h$
. In the cases with polymers, the Reynolds shear stress is much weaker than in the Newtonian cases; it even becomes negative away from the wall in the section at
 $z=0.6h$
. This is due to the transverse shear near the walls leading to additional vorticity (figure 4); this effect is more pronounced in the viscoelastic case than in the Newtonian flow, due to the enhancement of the near-wall vorticity, as shown in figure 5(b). Overall, the velocity fluctuation data indicate that the polymer solution has enhanced streamwise velocity fluctuations, and strongly reduced in-plane components and shear stresses, in good agreement with many previous studies in the literature (see e.g. the collection of data from numerous authors in Escudier et al. (Reference Escudier, Nickson and Poole2009)).
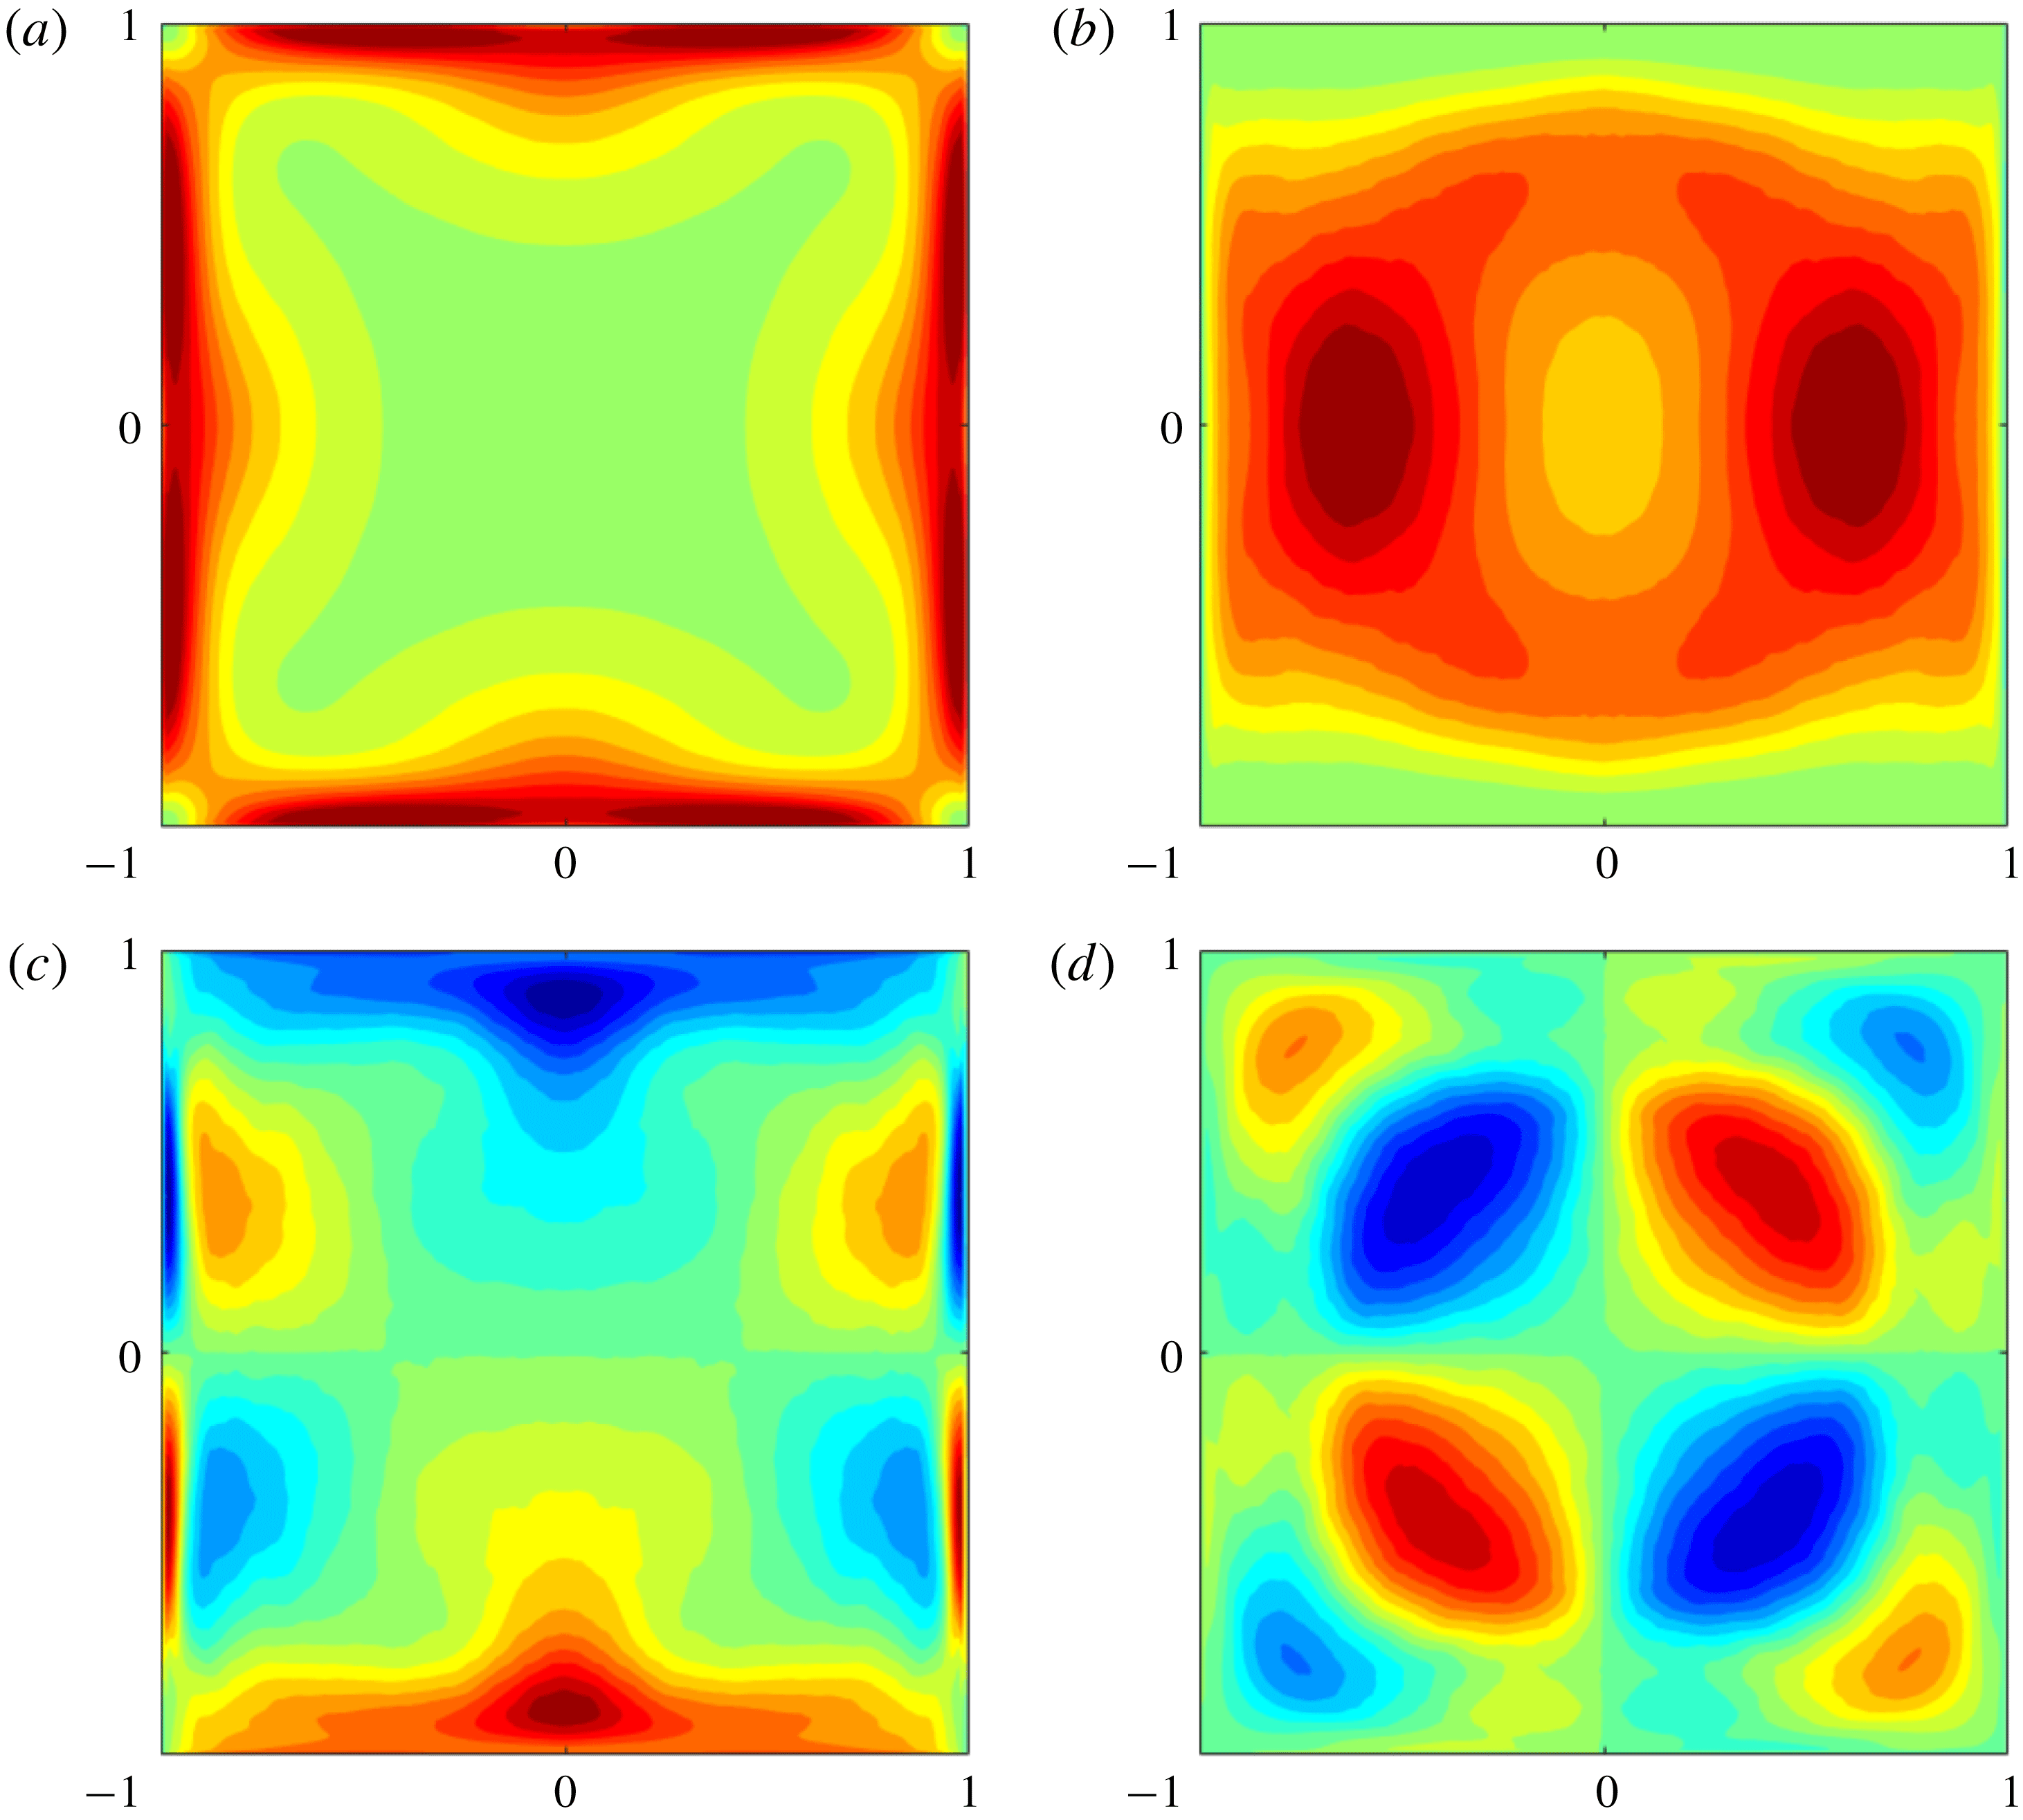
Contours of four components of the conformation tensor
 $\unicode[STIX]{x1D60A}_{ij}$
: (a)
 $\unicode[STIX]{x1D60A}_{11}$
, (b)
 $\unicode[STIX]{x1D60A}_{22}$
, (c)
 $\unicode[STIX]{x1D60A}_{12}$
and (d)
 $\unicode[STIX]{x1D60A}_{23}$
. Colour scales range from 30 (green) to 800 (red), from 5 (blue) to 50 (red), from
 $-30$
(blue) to 30 (red), and from
 $-10$
(blue) to 10 (red), for panels (a) to (d), respectively.

We conclude the analysis of the main flow statistics by showing in figure 8 four components of the conformation tensor
 $\unicode[STIX]{x1D60A}_{ij}$
. Note that the conformation tensor is strongly related to the added stress term due to the polymers (see (2.2)). In particular, in figure 8 we show the streamwise diagonal component
 $\unicode[STIX]{x1D60A}_{11}$
, one of the two diagonal in-plane components
 $\unicode[STIX]{x1D60A}_{22}$
, the corresponding off-diagonal term
 $\unicode[STIX]{x1D60A}_{12}$
, and the in-plane off-diagonal term
 $\unicode[STIX]{x1D60A}_{23}$
. The other components can be deduced from symmetry arguments: in particular,
 $\unicode[STIX]{x1D60A}_{33}$
and
 $\unicode[STIX]{x1D60A}_{13}$
can be obtained from
 $\unicode[STIX]{x1D60A}_{22}$
and
 $\unicode[STIX]{x1D60A}_{12}$
by symmetry around the bisection of the quadrants I and III. As expected, the streamwise component is the dominant one, with strong peak values located close to the wall, while, interestingly, in the four corners and in the centre of the duct
 $\unicode[STIX]{x1D60A}_{11}$
reaches its minimum value. Also,
 $\unicode[STIX]{x1D60A}_{11}$
is the only diagonal component of the conformation tensor showing the full eight symmetries; indeed,
 $\unicode[STIX]{x1D60A}_{22}$
presents only horizontal and vertical symmetries, with the diagonal ones recovered through the combination with the other component
 $\unicode[STIX]{x1D60A}_{33}$
(not shown here). In particular, the in-plane diagonal component
 $\unicode[STIX]{x1D60A}_{22}$
is minimum at the wall, and acts mainly on the horizontal centreline. The cross-term
 $\unicode[STIX]{x1D60A}_{12}$
has its peak located at the walls, while the component
 $\unicode[STIX]{x1D60A}_{23}$
has its peaks on the two diagonals. The in-plane shear component
 $\unicode[STIX]{x1D60A}_{23}$
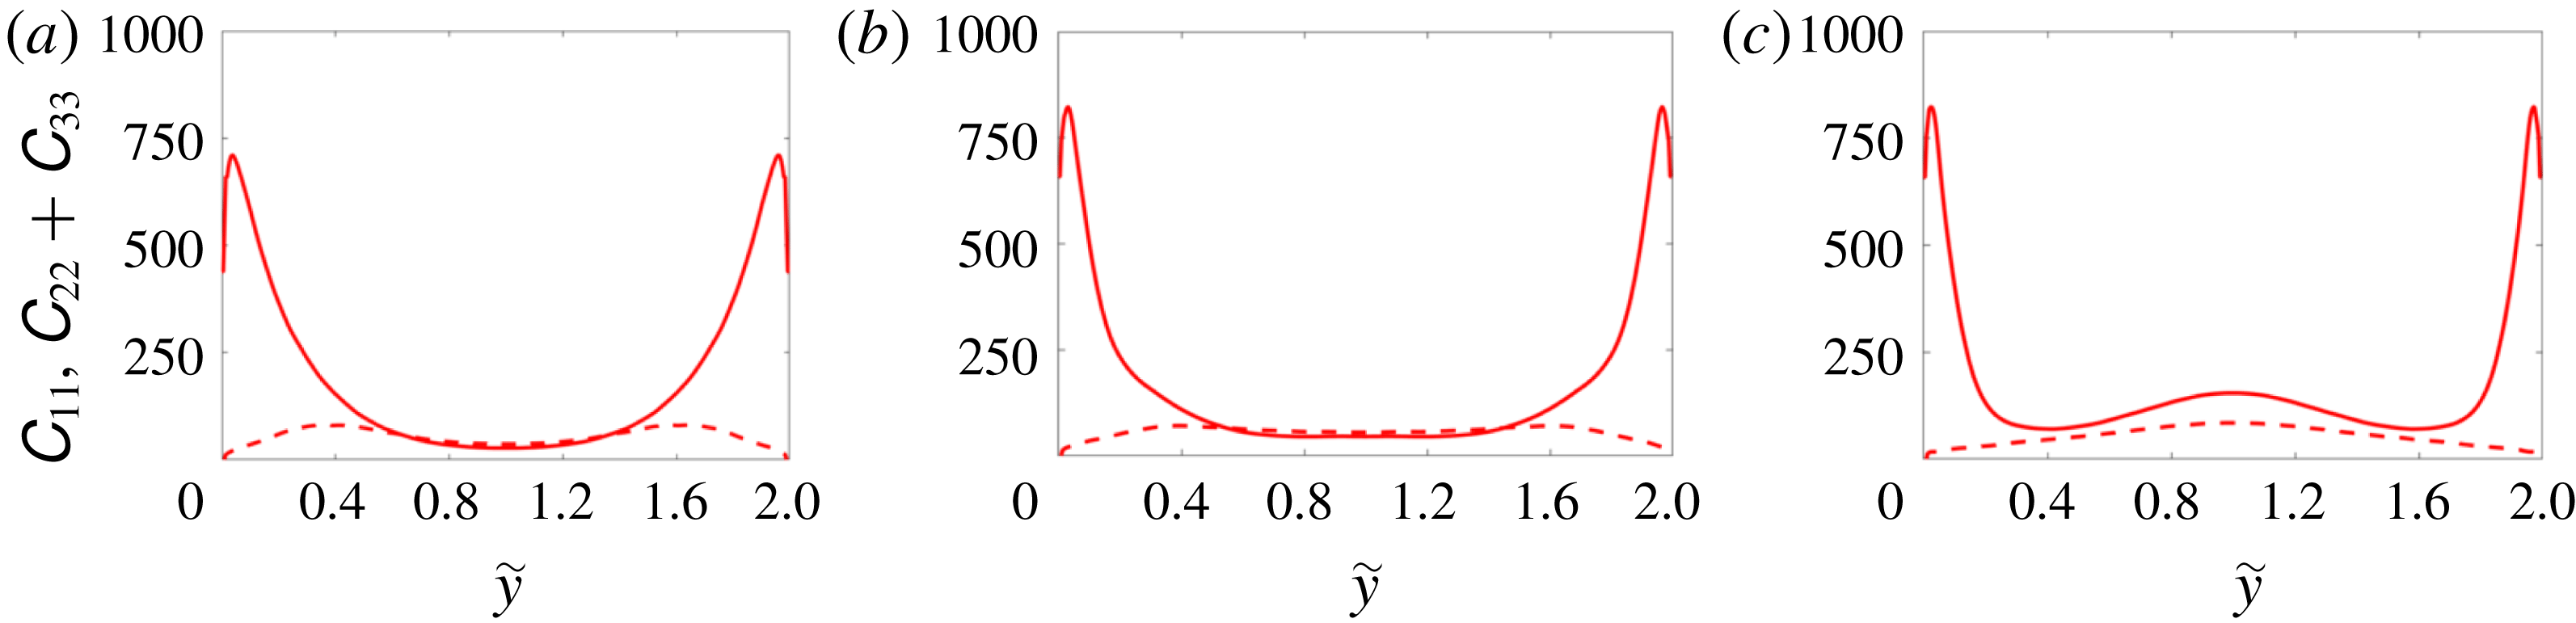
is not zero close to the corners, and over the two diagonals, where it shows a series of alternating maxima and minima, in a similar fashion to the shear Reynolds stress, which exhibits alternate signs moving from one wall to the other (figure 7). Figures 9(a), 9(b) and 9(c) show the wall-normal profiles of
 $\unicode[STIX]{x1D60A}_{11}$
(solid line) and
 $\unicode[STIX]{x1D60A}_{22}+\unicode[STIX]{x1D60A}_{33}$
(dashed line) in the midplane of the duct (
 $z=0$
), at
 $z=0.3h$
and at
 $z=0.6h$
, respectively. Note that
 $\unicode[STIX]{x1D60A}_{22}+\unicode[STIX]{x1D60A}_{33}$
is a measure of the in-plane stretching of the polymers, while its sum with
 $\unicode[STIX]{x1D60A}_{11}$
is the trace of the conformation tensor. We observe that
 $\unicode[STIX]{x1D60A}_{11}$
(and the trace) has a peak close to the wall and then decreases to its minimum value in the centre of the duct. Also, the peak value increases moving from the midplane towards the sidewalls;
 $\unicode[STIX]{x1D60A}_{11}$
starts increasing for all
 ${\tilde{y}}$
close to the sidewalls (
 $z=0.6h$
) as we are approaching the sidewall peaks (see figure 8
a). The in-plane stretching (
 $\unicode[STIX]{x1D60A}_{22}+\unicode[STIX]{x1D60A}_{33}$
) is more moderate than the streamwise one, and the profiles show minimum values at the wall. Also, the peak values of
 $\unicode[STIX]{x1D60A}_{22}+\unicode[STIX]{x1D60A}_{33}$
are located around
 $h/2$
in the midplane and move towards
 ${\tilde{y}}=1$
when approaching the sidewalls (see figure 8
b). Figures 8 and 9 show that the polymers mainly elongate in the streamwise direction in the near-wall region and away from the corners; however, in-plane elongation originating from the secondary cross-flow is present as well, especially at a distance from the walls of approximately
 $h/2$
.
Mean profile of the streamwise
 $\unicode[STIX]{x1D60A}_{11}$
(solid line) and in-plane component
 $\unicode[STIX]{x1D60A}_{22}+\unicode[STIX]{x1D60A}_{33}$
(dashed line) of the conformation tensor
 $\unicode[STIX]{x1D60A}_{ij}$
. The panels correspond to different sections: (a)
 $z=0$
, (b)
 $z=0.3h$
and (c)
 $z=0.6h$
.

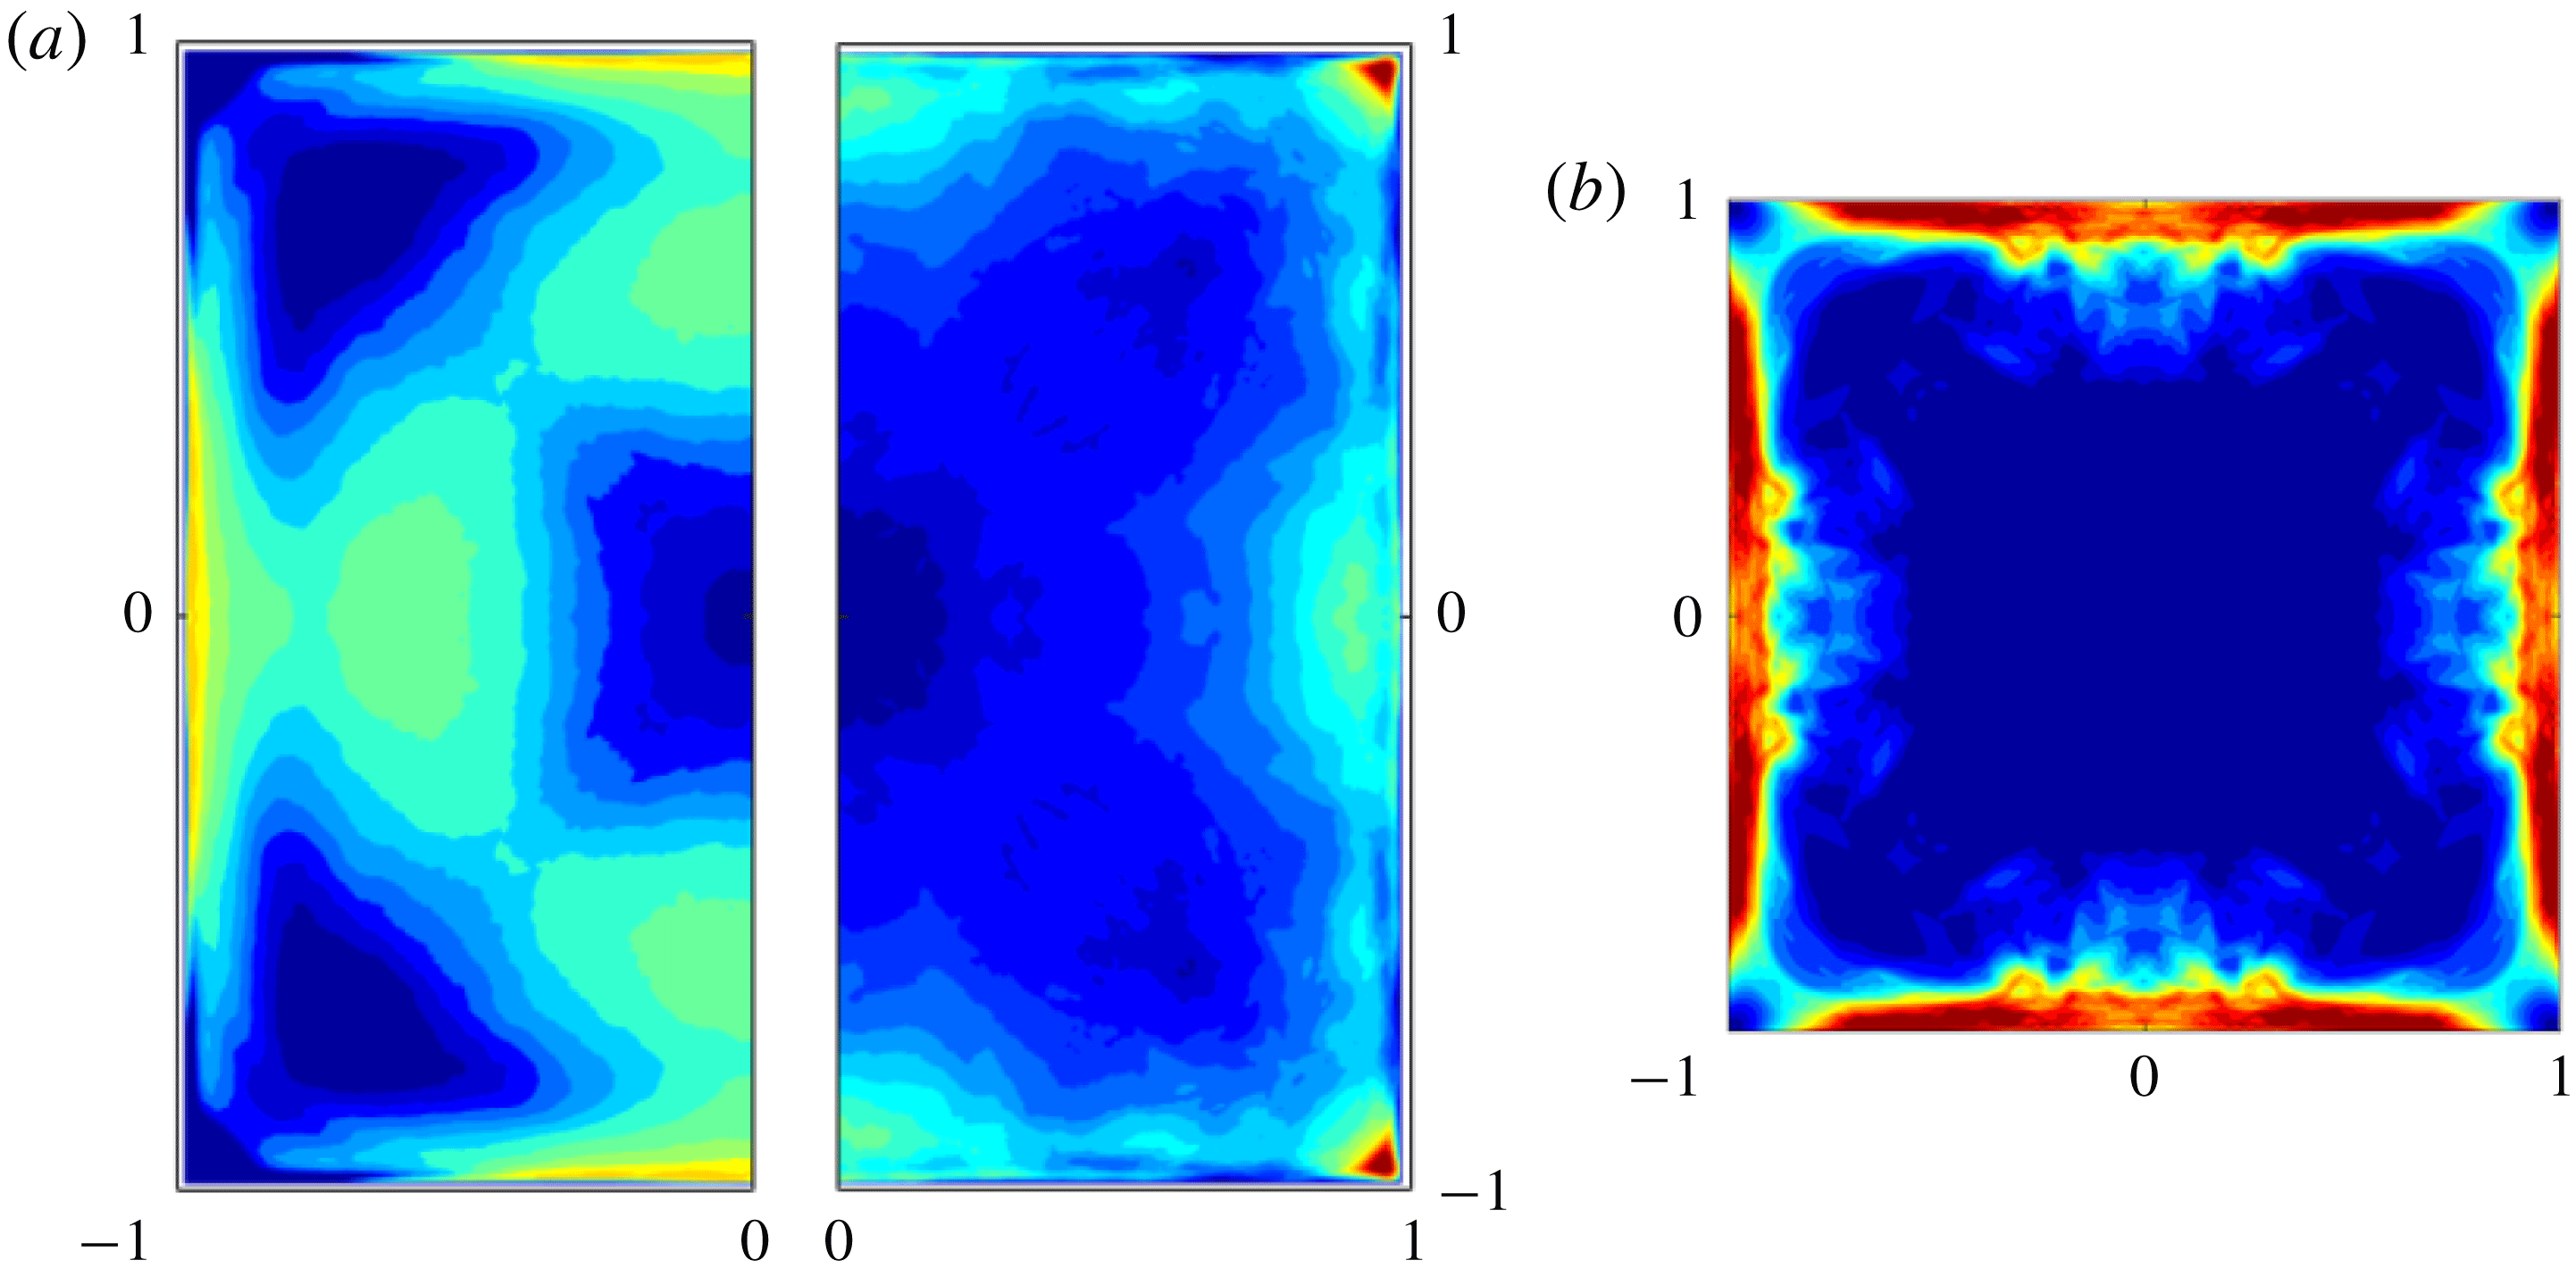
(a) Cross-correlations of the streamwise (left half) and wall-normal (right half) velocities and polymer force, defined in (3.1). Colour scales range from
 $-1$
to 1, and from
 $-0.25$
to 0.25, in the left and right halves, respectively. (b) Contours of the mean first normal difference
 ${\mathcal{N}}_{1}$
, with the colour scale ranging from 0 (blue) to 0.35 (red).

Next, figure 10(a) shows the cross-correlation
 $\unicode[STIX]{x1D70C}_{i}$
defined as
 $$\begin{eqnarray}\unicode[STIX]{x1D70C}_{i}={\displaystyle \frac{\overline{u_{i}\,f_{i}}}{{u_{i}}_{rms}\,{f_{i}}_{rms}}},\end{eqnarray}$$
where
 $f_{i}$
is the polymer volume force, i.e. the contribution to the Navier–Stokes equation of the polymeric stress tensor
 $f_{i}=(1-\unicode[STIX]{x1D6FD})/Re\,\unicode[STIX]{x2202}\unicode[STIX]{x1D70F}_{ij}/\unicode[STIX]{x2202}x_{j}$
. The left half of figure 10(a) shows the streamwise component
 $\unicode[STIX]{x1D70C}_{1}$
, while the right half shows the two identical wall-normal ones
 $\unicode[STIX]{x1D70C}_{2}=\unicode[STIX]{x1D70C}_{3}$
. In the streamwise direction (
 $\unicode[STIX]{x1D70C}_{1}$
), the polymer contribution is correlated with the corresponding velocity component in the near-wall region of the midplane far from the corners, thus enhancing fluctuations in this particular region. On the contrary, the streamwise polymer body force and velocity become anticorrelated in the bulk of the flow away from the walls, where the polymer contribution opposes the turbulent fluctuations. This is similar to what was found by Dubief et al. (Reference Dubief, Terrapon, White, Shaqfeh, Moin and Lele2005) for a turbulent plane channel flow. However, as the corners are approached, the behaviour drastically changes and the two streamwise components are strongly anticorrelated everywhere, even in the near-wall region, thus indicating that the addition of polymers tends to suppress fluctuation in the corners, as also shown in figure 7(c,f,i). The wall-normal component of the cross-correlation
 $\unicode[STIX]{x1D70C}_{2,3}$
shows a different behaviour; the wall-normal velocity and polymer force are anticorrelated almost everywhere, especially in the bulk of the flow, while they are strongly correlated in the four corners, where the polymer in-plane stress is acting to enhance the turbulent fluctuations.
Finally, we analyse the mean first normal stress difference
 ${\mathcal{N}}_{1}=\unicode[STIX]{x1D70E}_{11}-\unicode[STIX]{x1D70E}_{22}$
, with
 $\unicode[STIX]{x1D70E}_{11}$
and
 $\unicode[STIX]{x1D70E}_{22}$
being the mean streamwise and wall-normal total stresses, i.e. the sum of the solvent and polymer stresses. The first normal stress difference
 ${\mathcal{N}}_{1}$
averaged over the whole domain is positive whereas the second one
 ${\mathcal{N}}_{2}$
is slightly negative, with
 $|{\mathcal{N}}_{1}/{\mathcal{N}}_{2}|\gg 1$
. The spatial distribution of
 ${\mathcal{N}}_{1}$
is shown in figure 10(b);
 ${\mathcal{N}}_{1}$
is greater than zero in the whole domain and its peaks are located at the wall, around
 $0.5h$
from the sidewalls. Also, the first normal stress difference is close to zero at the centreline and in the four corners. Note that, as expected, the described spatial distribution of
 ${\mathcal{N}}_{1}$
closely follows that of
 $\unicode[STIX]{x1D60A}_{11}$
previously discussed in figure 8.
3.2 Flow structures
To further characterise the flow, we study the mean local wall stress along one edge in wall coordinates normalised by the average over the whole wall, similarly to what was proposed by Pinelli et al. (Reference Pinelli, Uhlmann, Sekimoto and Kawahara2010). These authors suggested that an upper bound for the number of wall velocity streaks over one of the four walls can be estimated from the dimension of the square expressed in wall units, since the average distance between streaks of different velocity sign is of the order of
 $50^{+}$
(Kim et al.
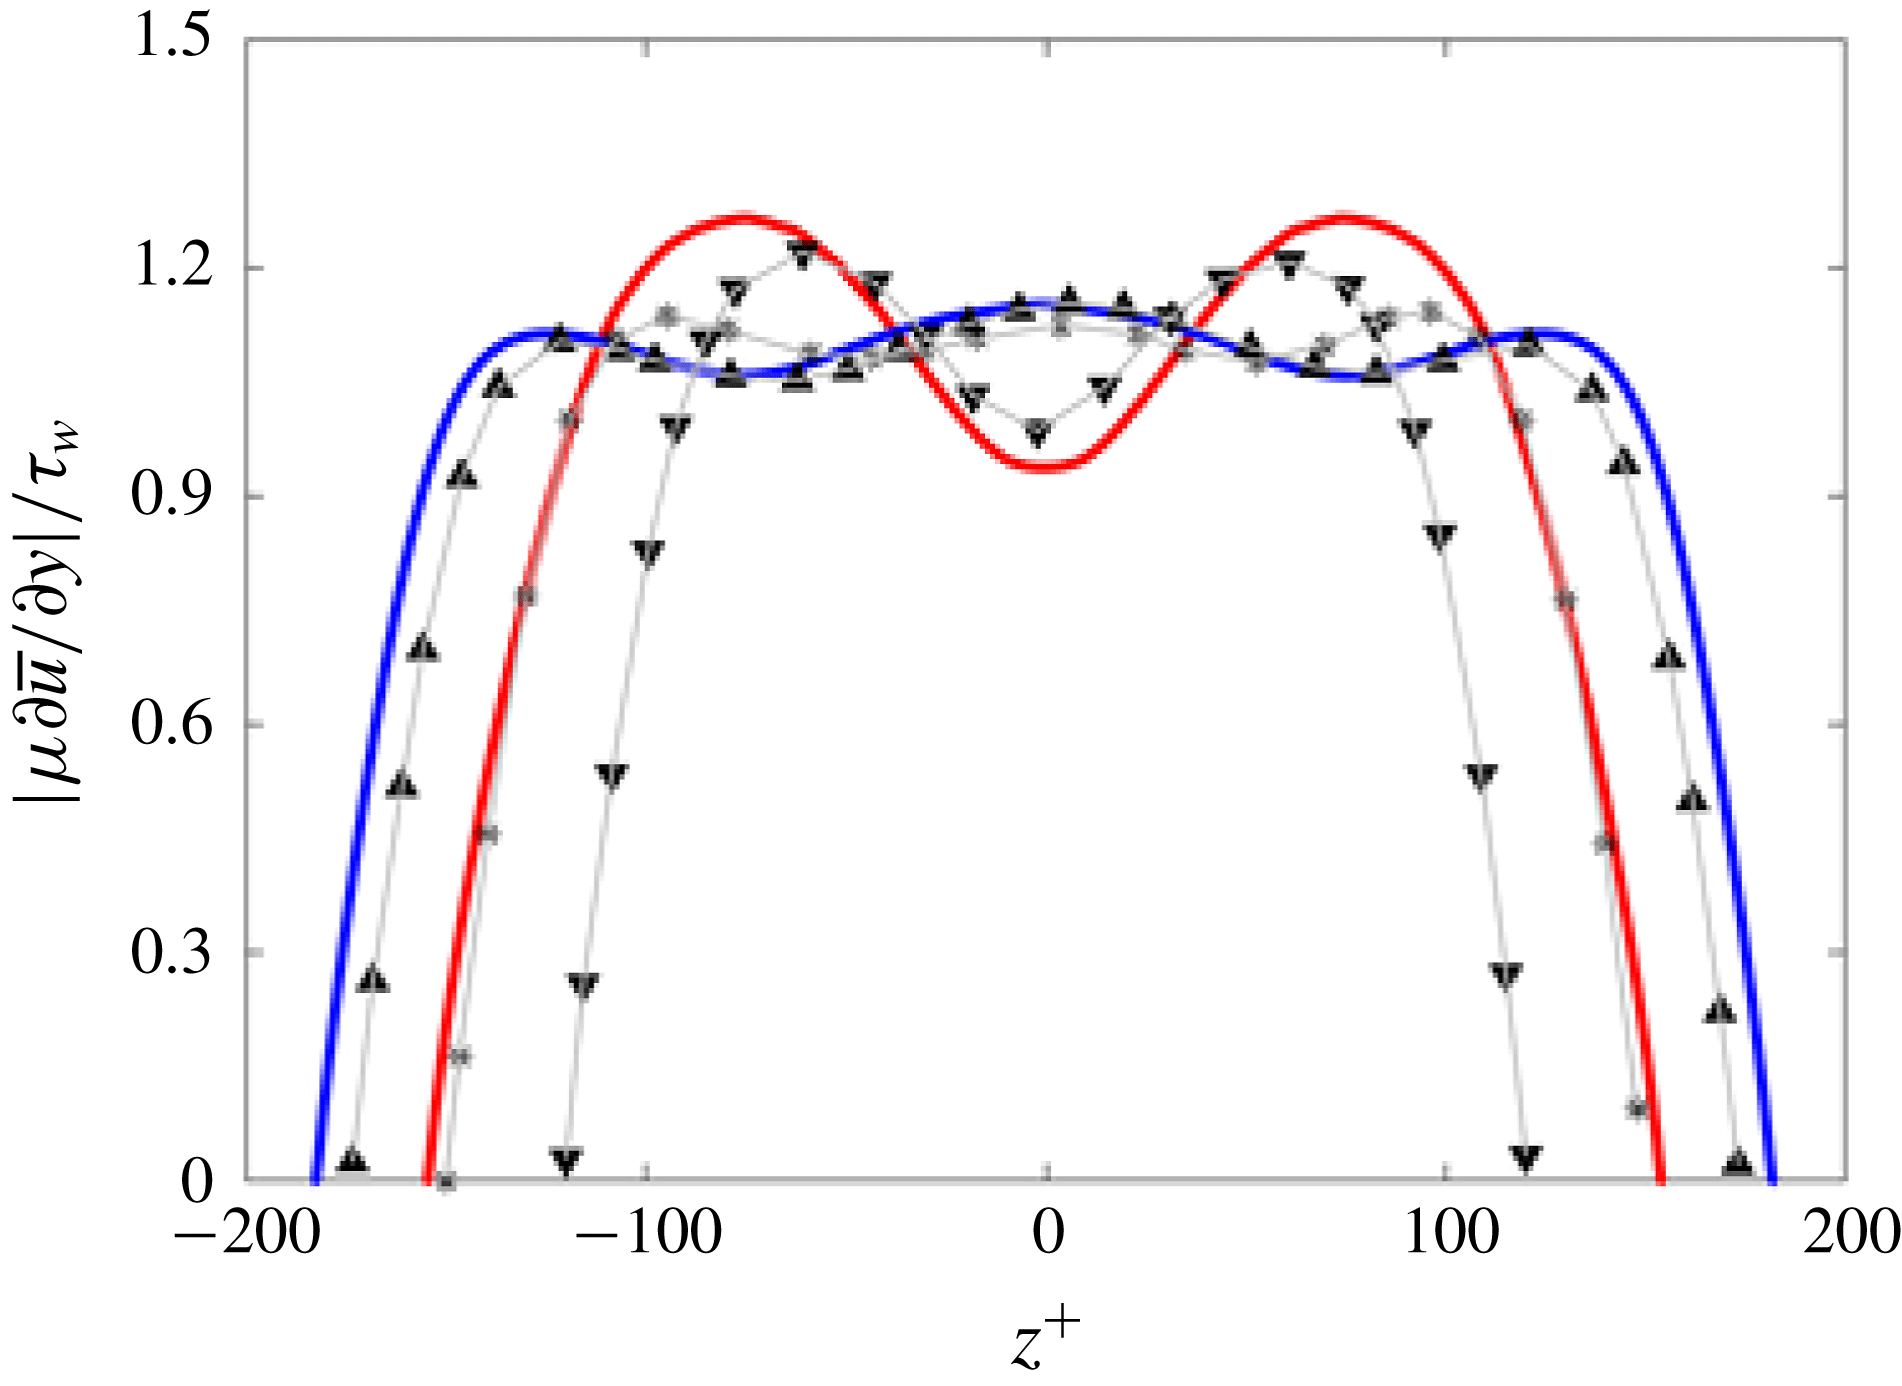
Reference Kim, Moin and Moser1987). In our case, we can expect more streaks in the Newtonian case than in the viscoelastic flow with polymers since increasing streak spacing is a well-known effect of polymer drag reduction that has been observed in both experiment and numerical works (e.g. De Angelis, Casciola & Piva Reference De Angelis, Casciola and Piva2002). Indeed, this argument is confirmed by figure 11, which shows that in the Newtonian case each edge of the duct hosts up to five streaks, with two high-velocity streaks close to the sidewalls and one in the centre, and two low-velocity streaks in between, represented in figure 11 by the three maxima and two minima in the wall stress profile. In the drag-reduced case with polymers, the profile presents only two maxima and one minimum, indicating that two high-velocity streaks are close to the sidewalls and one low-velocity streak is located between them at the centre of the edge; also, the two peaks are closer to the centreline than in the Newtonian case. In figure 11, we also report with symbols three curves pertaining to the results by Pinelli et al. (Reference Pinelli, Uhlmann, Sekimoto and Kawahara2010) for a Newtonian duct flow at
 $Re_{\unicode[STIX]{x1D70F}}=178$
(▴), 150 (
 $\ast$
) and 120 (▾): the first is used as reference, showing the good agreement between our Newtonian results and those from the literature, while the other two are included to provide further insight into the polymeric flow. Indeed, the Newtonian case at
 $Re_{\unicode[STIX]{x1D70F}}=150$
has approximately the same Reynolds number as our polymeric flow (155), but still shows a local maximum at the centreline, while the Newtonian case at
 $Re_{\unicode[STIX]{x1D70F}}=120$
exhibits a pattern of minima and maxima similar to the one obtained by our simulation with polymers, even if with different (lower) Reynolds number. Thus, even at a similar friction Reynolds number, the shear stress profile does not resemble that of a Newtonian flow due to the drag-reducing effect of polymers.
Mean local wall stress along one edge in wall coordinates normalised by the average over the whole wall
 $\unicode[STIX]{x1D70F}_{w}$
. The blue and red lines are used to show our numerical results of the Newtonian and polymeric flows, respectively, while the grey lines with symbols are the data taken from the work of Pinelli et al. (Reference Pinelli, Uhlmann, Sekimoto and Kawahara2010) for three Newtonian flows with different Reynolds numbers:
 $Re_{\unicode[STIX]{x1D70F}}=178$
(▴), 150 (
 $\ast$
) and 120 (▾).

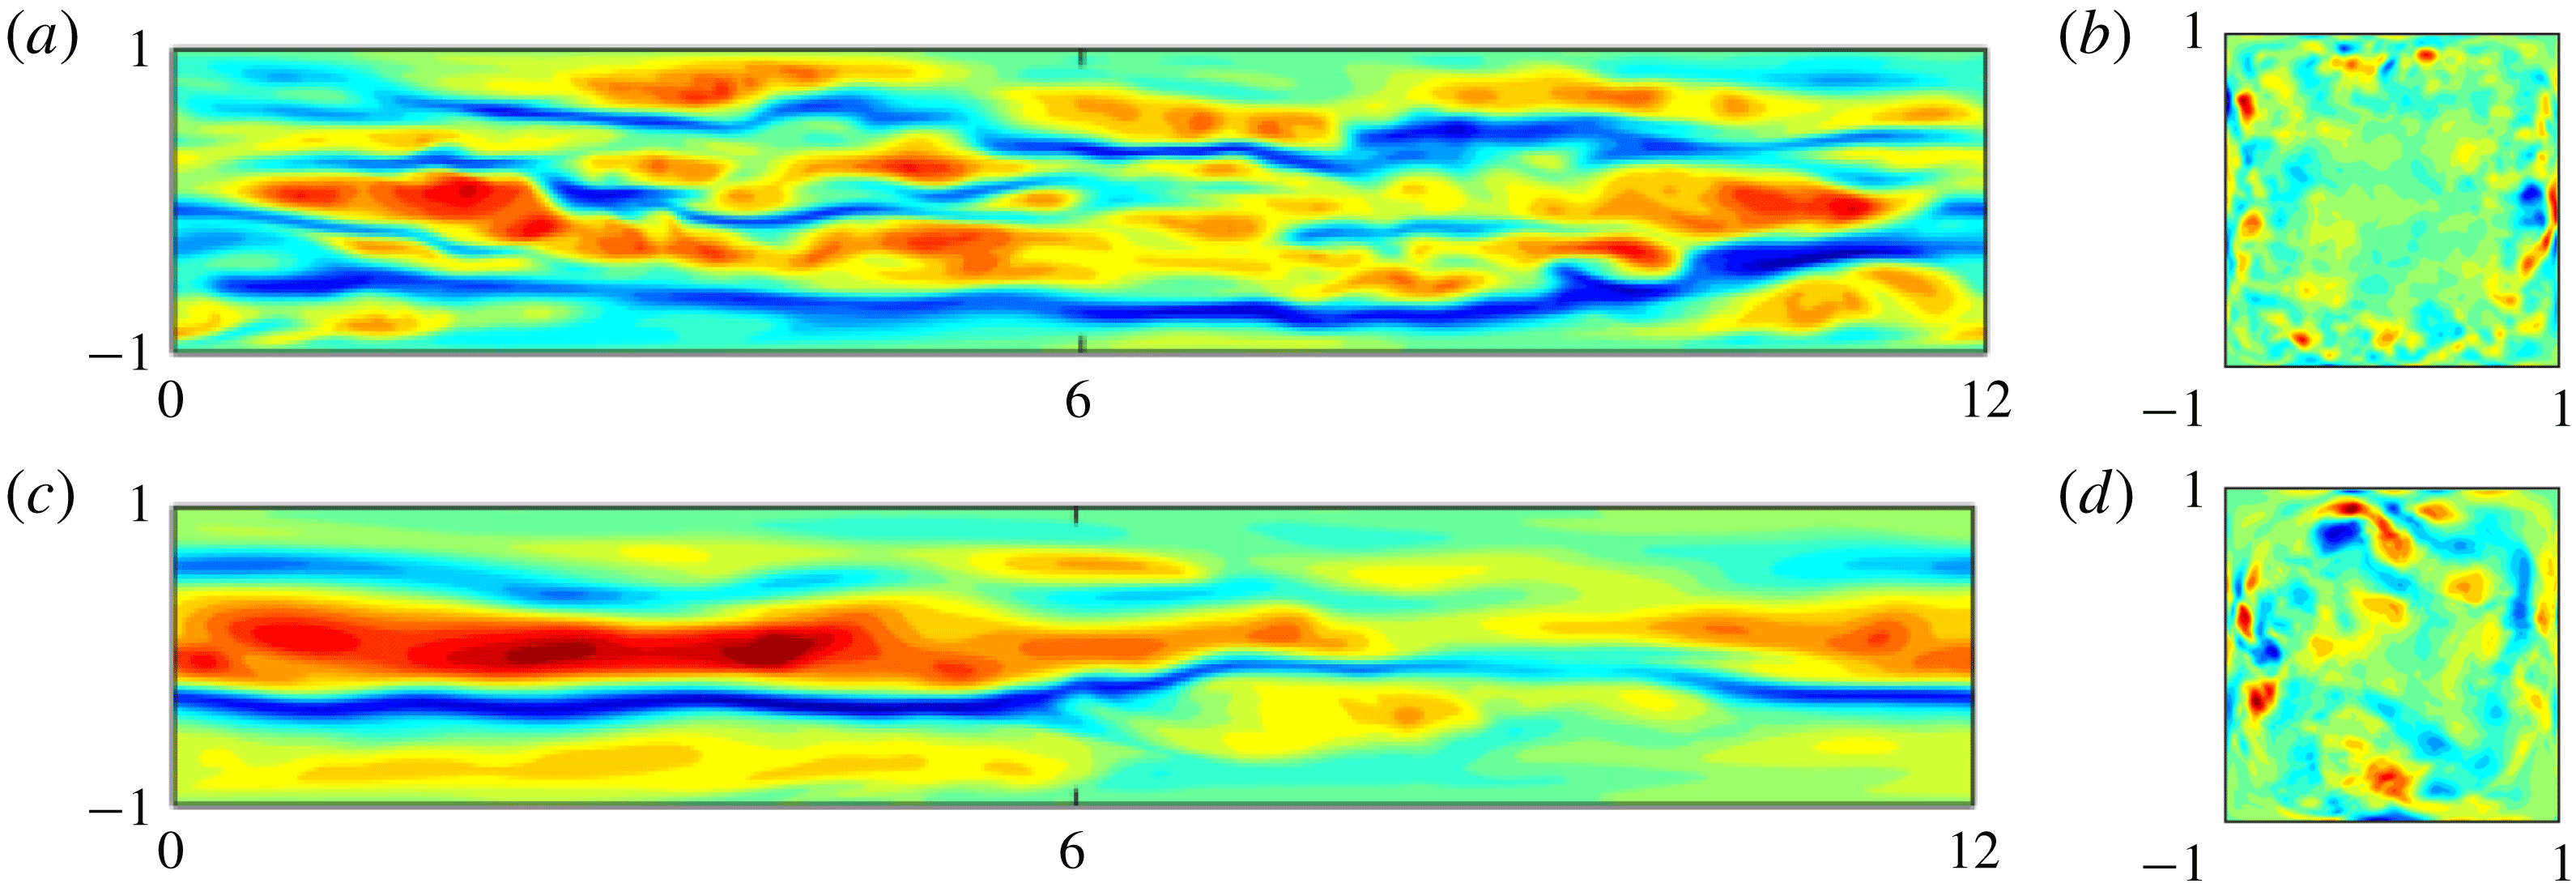
Contours of the instantaneous (a,c) streamwise velocity fluctuation component
 $u^{\prime }$
in the
 $x{-}z$
plane located at
 $\widetilde{y}\approx 18^{+}$
from the wall and of (b,d) streamwise vorticity
 $\unicode[STIX]{x1D714}_{x}$
in the
 $x{-}y$
plane. Panels show the Newtonian (a,b) and polymer (c,d) flows, respectively. The colour scale ranges from
 $-0.5U_{b}$
(blue) to
 $0.5U_{b}$
(red).

The previous result is confirmed by figure 12(a), which reports contours of the instantaneous streamwise velocity fluctuation
 $u^{\prime }$
in an
 $x{-}z$
section located at a distance
 $\widetilde{y}\approx 18^{+}$
from one wall. Figure 12(a) clearly shows the instantaneous footprints of the near-wall low- and high-speed streaks. Even from an instantaneous picture of the flow, the difference between the Newtonian and polymeric flows appears evident; indeed, the former shows two long low-speed streaks and more than two high-speed streaks, which are shorter and wider than the low-speed ones, whereas the viscoelastic flow presents just one low-speed streak close to the centreline, bounded by two high-speed streaks. Further, both the low- and high speed streaks are stronger and correlated over longer distances in the streamwise direction in the presence of polymers (Warholic et al.
Reference Warholic, Massah and Hanratty1999; Escudier et al.
Reference Escudier, Nickson and Poole2009). Pinelli et al. (Reference Pinelli, Uhlmann, Sekimoto and Kawahara2010) showed that the mean streamwise vorticity (secondary flow) strongly depends upon the statistically preferred location of the quasi-streamwise vortices associated with the pair of fast/slow streaks closest to the corner. As just shown in figures 11 and 12, the inclusion of the polymers in the flow strongly modifies these structures, by enhancing the streamwise coherence of the flow and by increasing the size of the near-wall structures (see figure 12
c), thus moving the quasi-streamwise vortices away from the bottom wall and sidewalls: therefore, the secondary motion is characterised by large structures close to the centre of the duct, due to the constraint imposed by the size of the domain.
3.3 Vorticity budget
Gavrilakis (Reference Gavrilakis1992) explains the origins of the mean secondary flow using an equation for the mean streamwise vorticity
 $\overline{\unicode[STIX]{x1D714}}_{x}$
, which we here modify for a fully developed duct flow with polymers and whose derivation has been reported in appendix A. The equation for the streamwise vorticity reads
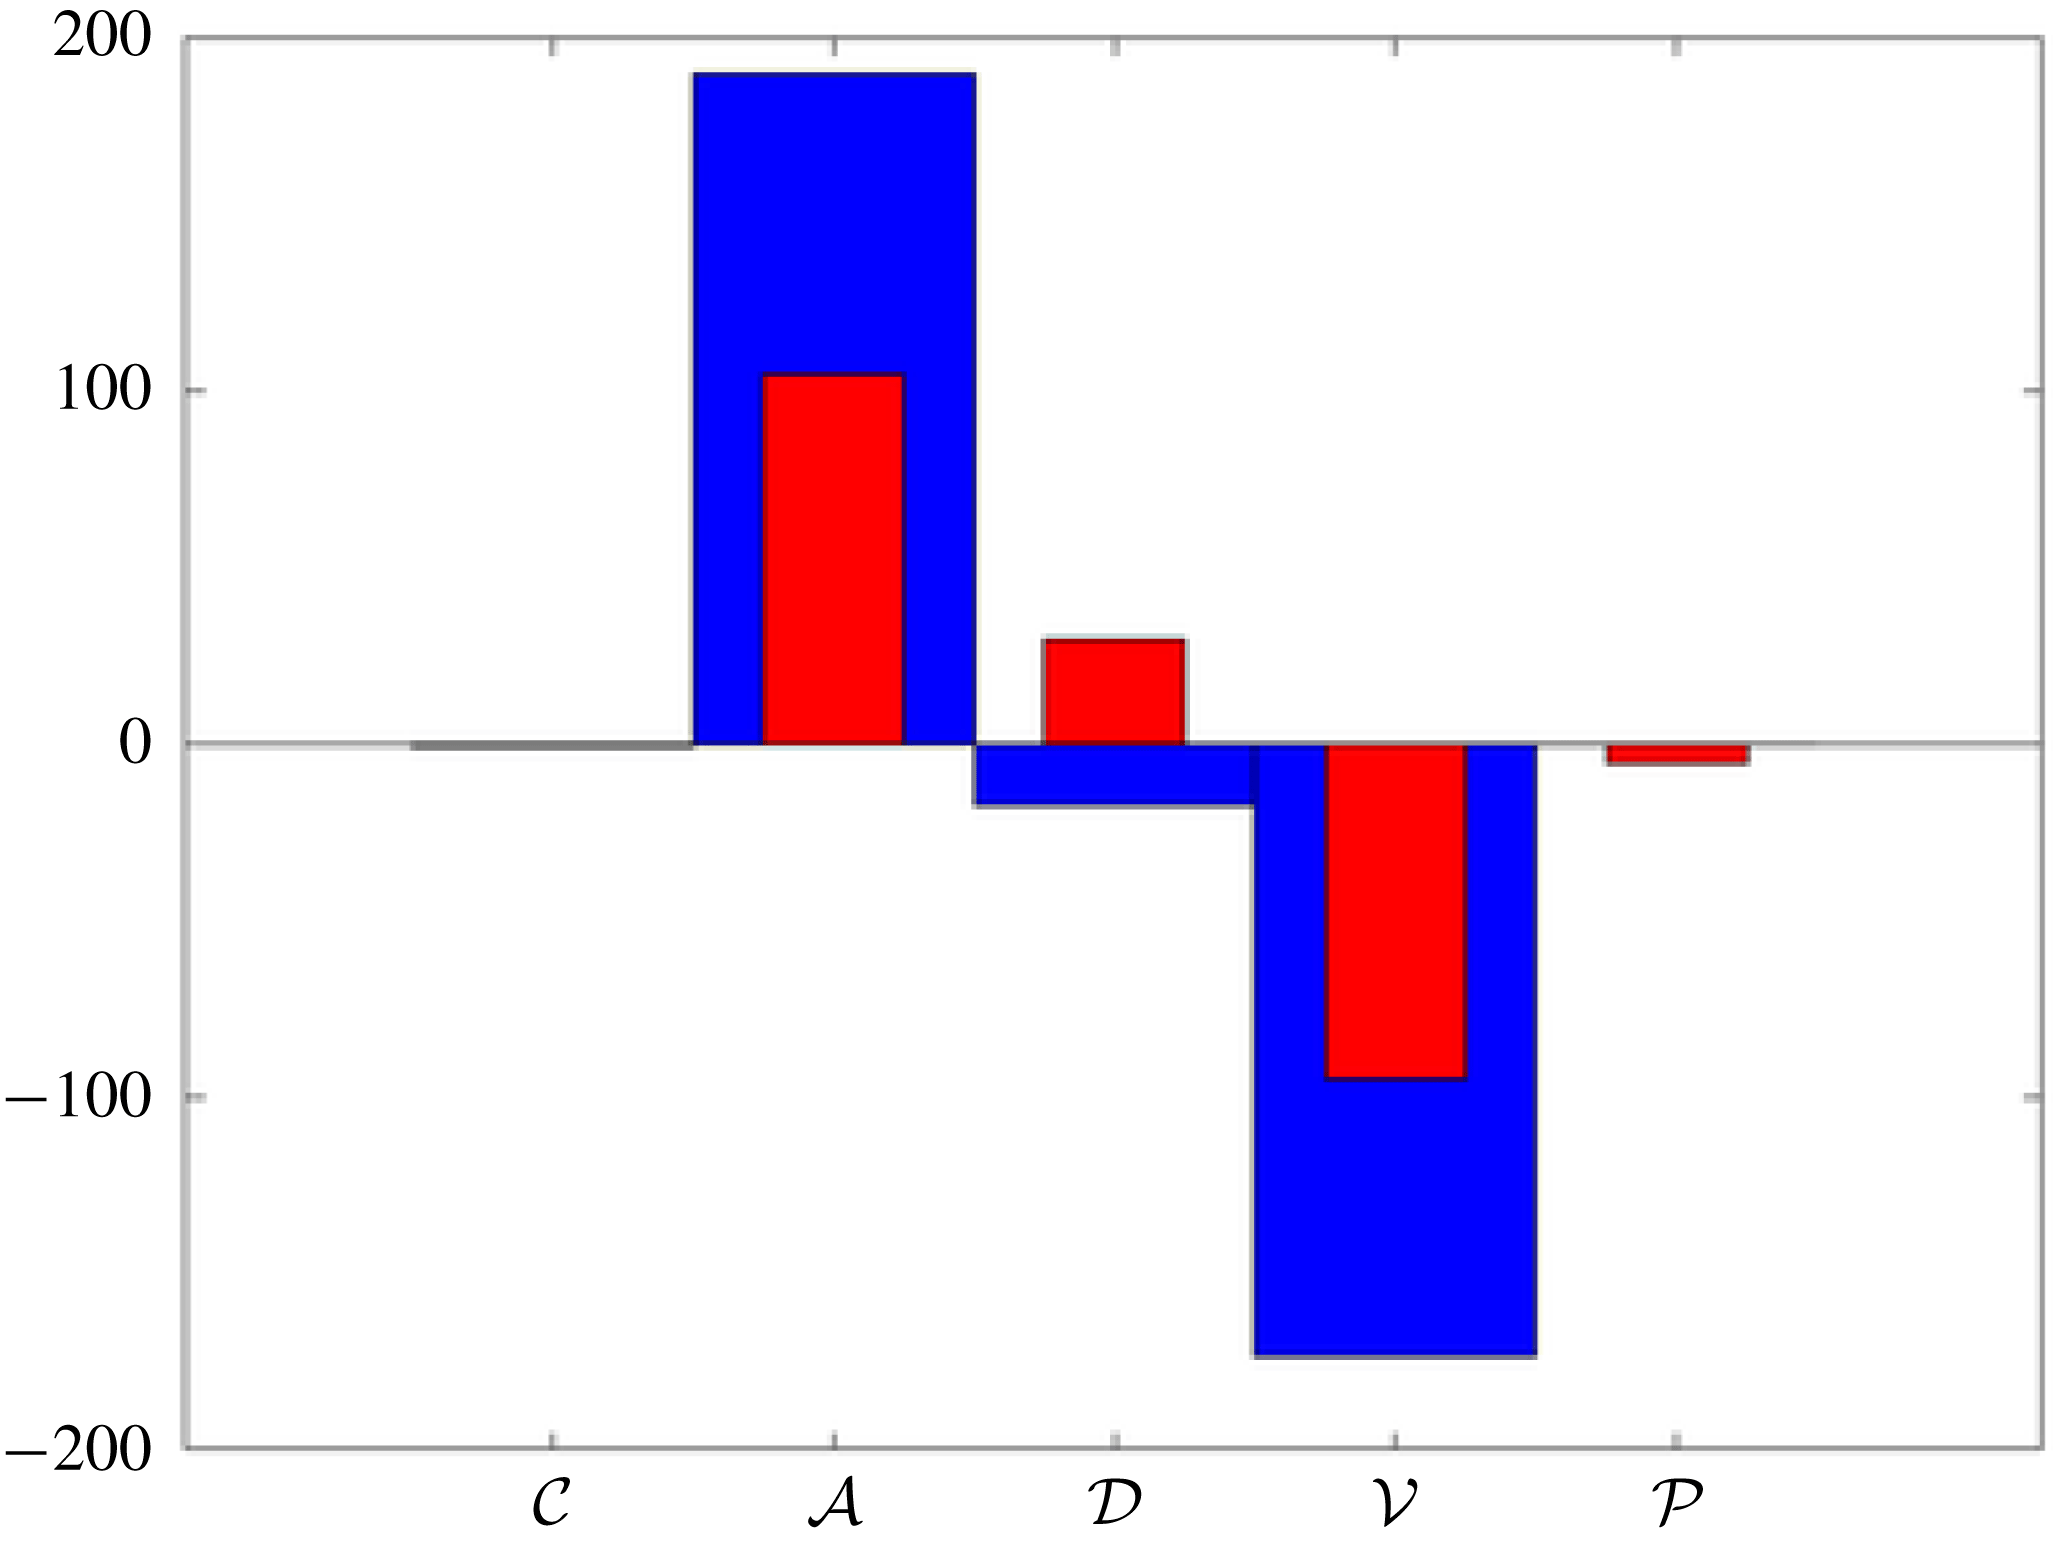
 $$\begin{eqnarray}\displaystyle \frac{\unicode[STIX]{x2202}\overline{\unicode[STIX]{x1D714}}_{x}}{\unicode[STIX]{x2202}t} & = & \displaystyle \underbrace{\overline{v}\frac{\unicode[STIX]{x2202}\overline{\unicode[STIX]{x1D714}}_{x}}{\unicode[STIX]{x2202}y}+\overline{w}\frac{\unicode[STIX]{x2202}\overline{\unicode[STIX]{x1D714}}_{x}}{\unicode[STIX]{x2202}z}}_{{\mathcal{C}}}+\underbrace{\frac{\unicode[STIX]{x2202}^{2}}{\unicode[STIX]{x2202}y\unicode[STIX]{x2202}z}(\overline{w^{\prime }w^{\prime }}-\overline{v^{\prime }v^{\prime }})}_{{\mathcal{A}}}+\underbrace{\left(\frac{\unicode[STIX]{x2202}^{2}}{\unicode[STIX]{x2202}y^{2}}-\frac{\unicode[STIX]{x2202}^{2}}{\unicode[STIX]{x2202}z^{2}}\right)\overline{v^{\prime }w^{\prime }}}_{{\mathcal{D}}}\nonumber\\ \displaystyle & & \displaystyle \underbrace{-\frac{\unicode[STIX]{x1D6FD}}{Re}\left(\frac{\unicode[STIX]{x2202}^{2}}{\unicode[STIX]{x2202}y^{2}}+\frac{\unicode[STIX]{x2202}^{2}}{\unicode[STIX]{x2202}z^{2}}\right)\overline{\unicode[STIX]{x1D714}}_{x}}_{{\mathcal{V}}}\;\underbrace{-\frac{1-\unicode[STIX]{x1D6FD}}{Re}\left(\frac{\unicode[STIX]{x2202}^{2}\overline{\unicode[STIX]{x1D70F}}_{32}}{\unicode[STIX]{x2202}y^{2}}+\frac{\unicode[STIX]{x2202}^{2}\overline{\unicode[STIX]{x1D70F}}_{33}}{\unicode[STIX]{x2202}z\unicode[STIX]{x2202}y}-\frac{\unicode[STIX]{x2202}^{2}\overline{\unicode[STIX]{x1D70F}}_{22}}{\unicode[STIX]{x2202}y\unicode[STIX]{x2202}z}-\frac{\unicode[STIX]{x2202}^{2}\overline{\unicode[STIX]{x1D70F}}_{23}}{\unicode[STIX]{x2202}z^{2}}\right)}_{{\mathcal{P}}}=0.\nonumber\\ \displaystyle & & \displaystyle\end{eqnarray}$$
The first two terms in the equation (denoted as
 ${\mathcal{C}}$
) are the convection of the mean vorticity by the secondary flow itself, while the last two terms are a sink of streamwise vorticity due to the viscosity (
 ${\mathcal{V}}$
) and the polymer contribution (
 ${\mathcal{P}}$
), which we found to be a sink as well. The two remaining terms involve the Reynolds stresses: the first is a production term associated with the anisotropy of the in-plane normal stresses (
 ${\mathcal{A}}$
), while the second (
 ${\mathcal{D}}$
) can be both a production and dissipation term due to the cross-Reynolds-stress component
 $\overline{v^{\prime }w^{\prime }}$
. Figure 13 shows the contribution of the five terms highlighted in (3.2), i.e.
 ${\mathcal{C}}$
,
 ${\mathcal{A}}$
,
 ${\mathcal{D}}$
,
 ${\mathcal{V}}$
and
 ${\mathcal{P}}$
, in one of the eight sectors and averaged among all the sectors. Blue and red colours are used for the Newtonian and polymeric flows, respectively. The only positive contribution in the Newtonian case is provided by the anisotropic terms, while all the others are negative. With polymers, the polymeric contribution
 ${\mathcal{P}}$
is found to be a sink of vorticity, the anisotropic and viscous terms decrease in magnitude compared to the Newtonian flow, while
 ${\mathcal{D}}$
changes sign and increases in magnitude, changing from dissipation for the Newtonian flow to production for the flow with polymers. Finally, the convection term
 ${\mathcal{C}}$
is null for both cases. The budget analysis suggests that, although the polymeric stress is small in amplitude, its presence modifies the flow itself, by reducing the anisotropy of the in-plane velocity fluctuations.
Contributions to the budget of the mean streamwise vorticity
 $\overline{\unicode[STIX]{x1D714}}_{x}$
: convection
 ${\mathcal{C}}$
, production due to anisotropy of the Reynolds stress
 ${\mathcal{A}}$
, production/dissipation source term
 ${\mathcal{D}}$
, viscous dissipation
 ${\mathcal{V}}$
, and polymeric contribution
 ${\mathcal{P}}$
. Blue and red colours are used for the Newtonian and viscoelastic flows, respectively.

Contributions to the streamwise Reynolds-stress tensor
 $\overline{u^{\prime }u^{\prime }}$
equation for the Newtonian (a,c) and viscoelastic case with polymers (b,d). On each side (a,c) and (b,d), the contours represent the terms
 ${\mathcal{A}}_{ij}$
,
 ${\mathcal{Q}}_{ij}$
,
 ${\mathcal{R}}_{ij}$
,
 ${\mathcal{P}}_{ij}$
,
 ${\mathcal{D}}_{ij}$
,
 $\unicode[STIX]{x1D716}_{ij}$
,
 ${\mathcal{W}}_{ij}$
and the total balance (see (3.3)) in order from top left to bottom right. The ranges of the colour scales are
 $\pm 0.002$
,
 $\pm 0.008$
,
 $\pm 0.005$
,
 $\pm 0.025$
,
 $\pm 0.01$
,
 $\pm 0.02$
,
 $\pm 0.003$
and
 $\pm 0.001$
, respectively, from top left to bottom right, with colours going from blue (negative values) to red (positive value) and with the zero coloured in green.

3.4 Energy budget
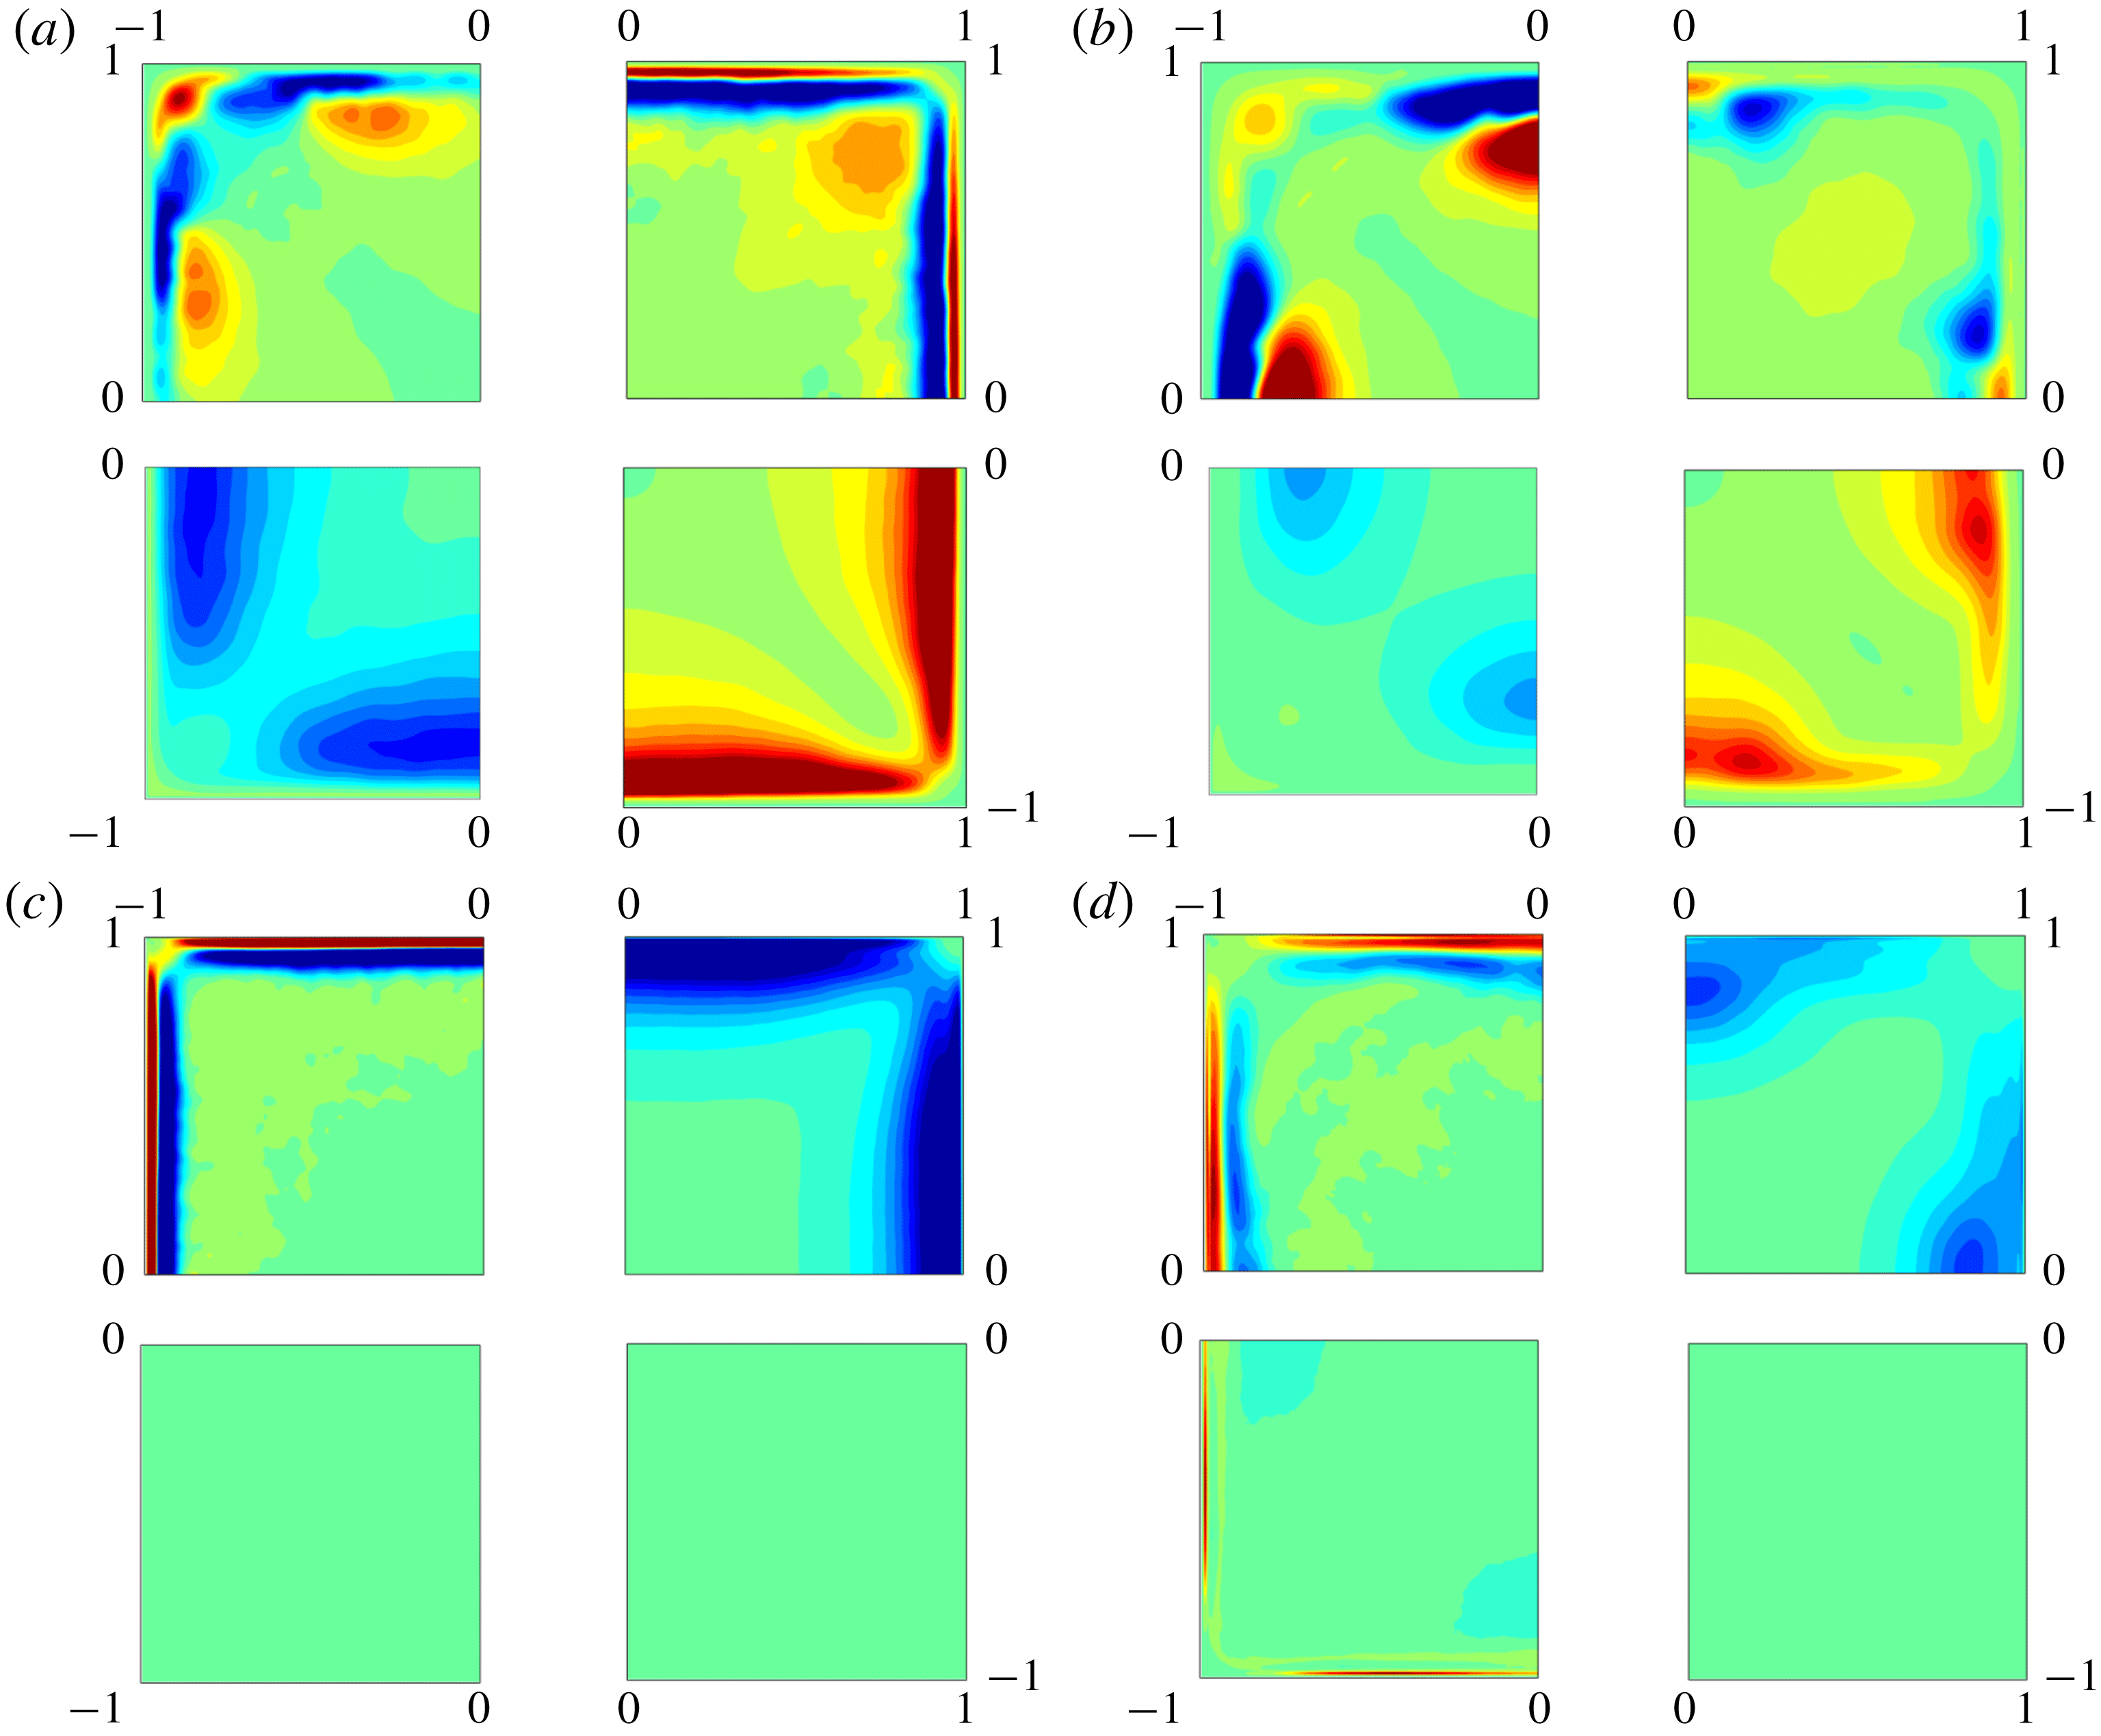
To better understand the effect of polymers on the streamwise velocity fluctuations
 $\overline{u^{\prime }u^{\prime }}$
, which are related to streaks, we consider the perturbation energy budget. The transport equation for the Reynolds stress in a viscoelastic flow is given by
 $$\begin{eqnarray}\displaystyle \frac{\unicode[STIX]{x2202}\overline{u_{i}^{\prime }u_{j}^{\prime }}}{\unicode[STIX]{x2202}t} & = & \displaystyle \underbrace{-\overline{u}_{k}\frac{\unicode[STIX]{x2202}\overline{u_{i}^{\prime }u_{j}^{\prime }}}{\unicode[STIX]{x2202}x_{k}}}_{{\mathcal{A}}_{ij}}\underbrace{-\overline{u}_{k}\frac{\unicode[STIX]{x2202}\overline{u_{i}^{\prime }u_{j}^{\prime }u_{k}^{\prime }}}{\unicode[STIX]{x2202}x_{k}}}_{{\mathcal{Q}}_{ij}}\underbrace{-\left(\overline{u_{j}^{\prime }\frac{\unicode[STIX]{x2202}p^{\prime }}{\unicode[STIX]{x2202}x_{i}}}+\overline{u_{i}^{\prime }\frac{\unicode[STIX]{x2202}p^{\prime }}{\unicode[STIX]{x2202}x_{j}}}\right)}_{{\mathcal{R}}_{ij}}\underbrace{-\left(\overline{u_{j}^{\prime }u_{k}^{\prime }}\frac{\unicode[STIX]{x2202}\overline{u}_{i}}{\unicode[STIX]{x2202}x_{k}}+\overline{u_{i}^{\prime }u_{k}^{\prime }}\frac{\unicode[STIX]{x2202}\overline{u}_{j}}{\unicode[STIX]{x2202}x_{k}}\right)}_{{\mathcal{P}}_{ij}}\nonumber\\ \displaystyle & & \displaystyle +\,\underbrace{\frac{\unicode[STIX]{x1D6FD}}{Re}\frac{\unicode[STIX]{x2202}^{2}\overline{u_{i}^{\prime }u_{j}^{\prime }}}{\unicode[STIX]{x2202}x_{k}^{2}}}_{{\mathcal{D}}_{ij}}\underbrace{-\frac{2\unicode[STIX]{x1D6FD}}{Re}\overline{\frac{\unicode[STIX]{x2202}u_{i}^{\prime }}{\unicode[STIX]{x2202}x_{k}}\frac{u_{j}^{\prime }}{\unicode[STIX]{x2202}x_{k}}}}_{\unicode[STIX]{x1D716}_{ij}}+\underbrace{\frac{1-\unicode[STIX]{x1D6FD}}{Re}\left(\overline{u_{j}^{\prime }\frac{\unicode[STIX]{x2202}\unicode[STIX]{x1D70F}_{ik}^{\prime }}{\unicode[STIX]{x2202}x_{k}}}+\overline{u_{i}^{\prime }\frac{\unicode[STIX]{x2202}\unicode[STIX]{x1D70F}_{jk}^{\prime }}{\unicode[STIX]{x2202}x_{k}}}\right)}_{{\mathcal{W}}_{ij}}=0,\end{eqnarray}$$
where
 ${\mathcal{A}}_{ij}$
is the advection by the mean flow,
 ${\mathcal{Q}}_{ij}$
the transport by the velocity fluctuations,
 ${\mathcal{R}}_{ij}$
the pressure term,
 ${\mathcal{P}}_{ij}$
the production against the mean shear,
 ${\mathcal{D}}_{ij}$
the viscous diffusion,
 $\unicode[STIX]{x1D716}_{ij}$
the dissipation, and
 ${\mathcal{W}}_{ij}$
the polymer work. The evolution equation for the perturbation energy is obtained by setting
 $i=j$
, and in particular we consider here the streamwise component
 $i=j=1$
. Figure 14 shows the contours of these seven contributions, and their sum, for the Newtonian (a,c) and polymeric flow (b,d). First, we note that, as expected, the sum of all the contribution is in both cases almost zero (up to
 $10^{-3}$
), since the mean Reynolds stress
 $\overline{u^{\prime }u^{\prime }}$
has reached steady state.
We first discuss the Newtonian flow, reported in figure 14(a,c); the advection
 ${\mathcal{A}}_{ij}$
and transport
 ${\mathcal{Q}}_{ij}$
terms display strong gradients close to the walls. In particular, the distribution of
 ${\mathcal{A}}_{ij}$
reveals that the maximum advection occurs in regions close to the maximum in-plane mean vorticity, i.e. where the secondary flow is maximum (see figure 4). On the other hand, the turbulent transport,
 ${\mathcal{Q}}_{ij}$
, is observed to be approximately uniform along the edges; in particular, it is zero at the wall, reaches a positive peak value in the near-wall region, followed by a minimum, and finally goes back to zero away from the wall, thus indicating that the largest gradients of the high-order statistics are located mainly in the near-wall region, all along the edges. The pressure and production terms,
 ${\mathcal{R}}_{ij}$
and
 ${\mathcal{P}}_{ij}$
, exhibit opposite behaviour: the former is always negative and the latter always positive, reaching a minimum/maximum and then approaching zero again in the bulk of the duct. The viscous diffusion
 ${\mathcal{D}}_{ij}$
displays a strong peak at the wall and then decreases to zero, while the dissipation term
 $\unicode[STIX]{x1D716}_{ij}$
has a minimum at the wall, and then increases to its maximum value in the centre of the duct. Figure 14(a,c) shows that all the contributions have an almost uniform distribution along the edges, with only a weak dependence on the distance from the corners, except for the advection
 ${\mathcal{A}}_{ij}$
and transport
 ${\mathcal{Q}}_{ij}$
terms.
The behaviour of the various terms in the kinetic energy budget is different for the viscoelastic flow, as shown in figure 14(b,d). In this case, all the terms are not uniform along the edge and strongly depend on the distance from the sidewalls; this is related to the reduced friction Reynolds number of the flow and the consequent increase in size of the near-wall structures previously discussed. In particular, the positive and negative peaks of the advection
 ${\mathcal{A}}_{ij}$
term are found close to the centreline far from the corners, similarly to the transport term
 ${\mathcal{Q}}_{ij}$
, which exhibits strong negative and positive peaks in the same region. Also, the pressure
 ${\mathcal{R}}_{ij}$
, production
 ${\mathcal{P}}_{ij}$
and dissipation
 $\unicode[STIX]{x1D716}_{ij}$
terms exhibit a similar trend, with maxima and minima located away from the corner. Finally, the polymer contribution (
 ${\mathcal{W}}_{ij}$
) is not null, but its amplitude is small compared to the other terms, and its distribution across the whole duct is almost uniform. These results clearly indicate that the polymers strongly modify the flow; in particular, their presence induces a less uniform flow in the duct, with most of the streamwise flow fluctuations displaced towards the centreline and away from the corner, as we have already noticed in figure 10. The location where on average the low- and high-speed streaks are present, as previously shown in figures 11 and 12, coincides with the location of major activity of the flow where strong peaks of advection, transport, production and dissipation are present.
3.5 Elasticity effect
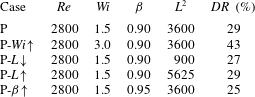
We now assess the effect of the parameters defining the viscoelastic behaviour of the fluid. Table 1 reports all the different simulations that we have performed and the drag reduction
 $DR$
obtained in each case. In particular, starting from the reference polymeric case discussed before (P), we have varied independently the Weissenberg number
 $Wi$
(P-
 $Wi\uparrow$
), the dumbbell extensibility
 $L$
(P-
 $L\downarrow$
and P-
 $L\uparrow$
) and the viscosity ratio
 $\unicode[STIX]{x1D6FD}$
(P-
 $\unicode[STIX]{x1D6FD}\uparrow$
). From table 1 we can observe that, starting from the drag reduction reported for the reference polymeric case (29 %), a relevant reduction or increase of
 $L$
brings about only small variations in the overall drag reduction (27 % and 29 %), while even smaller variations of
 $\unicode[STIX]{x1D6FD}$
are sufficient to alter the solution, as demonstrated by a drag reduction of 25 % for the case with higher viscosity ratio P-
 $\unicode[STIX]{x1D6FD}\uparrow$
. However, the parameter that has the greatest effect on the solution appears to be the Weissenberg number
 $Wi$
. Indeed, when
 $Wi=3$
(P-
 $Wi\uparrow$
) the drag reduction increases to 43 %. We will now analyse in more detail this polymeric case with
 $Wi=3$
and compare the flow with the one discussed above, i.e. the Newtonian and the polymeric with
 $Wi=1.5$
.
Summary of all the DNS performed at a fixed bulk Reynolds number equal to
 $Re=2800$
and with different viscoelastic fluids.

Figure 15 shows the contours of the mean streamwise components of the velocity
 $\overline{u}$
and vorticity
 $\overline{\unicode[STIX]{x1D714}}_{x}$
for the two different Weissenberg numbers considered. As
 $Wi$
increases, the maximum streamwise velocity is only slightly affected, while the maximum vorticity strongly decreases by 40 %. However, the integral of the vorticity keeps increasing, thus confirming a progressive increase of the in-plane motion with the Weissenberg number
 $Wi$
. The location of maximum vorticity, marked with a black dot in figure 15, moves further away from the walls, displacing towards the centre; however, this displacement is smaller than what was previously observed when comparing the Newtonian case with the polymeric one with
 $Wi=1.5$
(see figure 4
b), thus indicating a nonlinear trend with
 $Wi$
.
Contours of the mean streamwise component of (a) velocity
 $\overline{u}$
and (b) vorticity
 $\overline{\unicode[STIX]{x1D714}}_{x}$
. In each panel, the left (right) half of the duct is used for the polymeric cases with
 $Wi=1.5$
(
 $Wi=3$
), respectively. The colour scale ranges from 0 (blue) to
 $1.4U_{b}$
(red) in (a), and from
 $-0.5U_{b}/h$
(blue) to
 $0.5U_{b}/h$
(red) in (b). Panel (a) also reports the in-plane mean velocity with arrows.

Mean streamwise velocity as a function of the wall-normal distance in logarithmic scale and wall units. The blue, red and brown lines are used for the numerical results without and with polymers with
 $Wi=1.5$
and 3, respectively. The magenta dashed line is the polymer maximum drag reduction (Virk Reference Virk1975; Lvov et al.
Reference Lvov, Pomyalov, Procaccia and Tiberkevich2004) while the black dashed line indicates the Newtonian log law. The panels correspond to different sections: (a)
 $z=0$
, (b)
 $z=0.3h$
and (c)
 $z=0.6h$
.

Next, we study the mean streamwise velocity profiles in wall units reported in figure 16. Here, we compare the profiles of the Newtonian fluid and the two viscoelastic cases with different Weissenberg number
 $Wi$
. In all the considered sections, we observe a progressive departure from the Newtonian velocity profile as
 $Wi$
increases, with the slope of the inertial range of scales growing with
 $Wi$
; the curves for
 $Wi=3$
approach the maximum drag reduction limit.
Wall-normal mean profile of (a–c) the streamwise r.m.s. velocity fluctuation, (d–f) the wall-normal r.m.s. velocity fluctuation, and (g–i) the cross-term of the Reynolds stress tensor
 $u^{\prime }v^{\prime }$
. The columns correspond to different sections: (a,d,g)
 $z=0$
, (b,e,h)
 $z=0.3h$
and (c,f,i)
 $z=0.6h$
. The line and colour style is the same as in figure 16.

Figure 17 shows the profiles of the r.m.s. of the velocity fluctuations and of the Reynolds shear stress component as a function of the wall-normal distance
 ${\tilde{y}}$
. We observe that the streamwise velocity fluctuation
 $u_{rms}$
is only slightly altered by the increase of
 $Wi$
, except its peak value, which displaces further away from the wall. On the other hand, both the in-plane fluctuation
 $v_{rms}$
and the shear Reynolds stress component
 $\overline{u^{\prime }v^{\prime }}$
are strongly affected by the increase of
 $Wi$
. In particular, both
 $v_{rms}$
and
 $\overline{u^{\prime }v^{\prime }}$
are reduced across the whole domain, as already found for the turbulent channel flows with polymers (Ptasinski et al.
Reference Ptasinski, Boersma, Nieuwstadt, Hulsen, Van den Brule and Hunt2003; Dubief et al.
Reference Dubief, White, Terrapon, Shaqfeh, Moin and Lele2004).
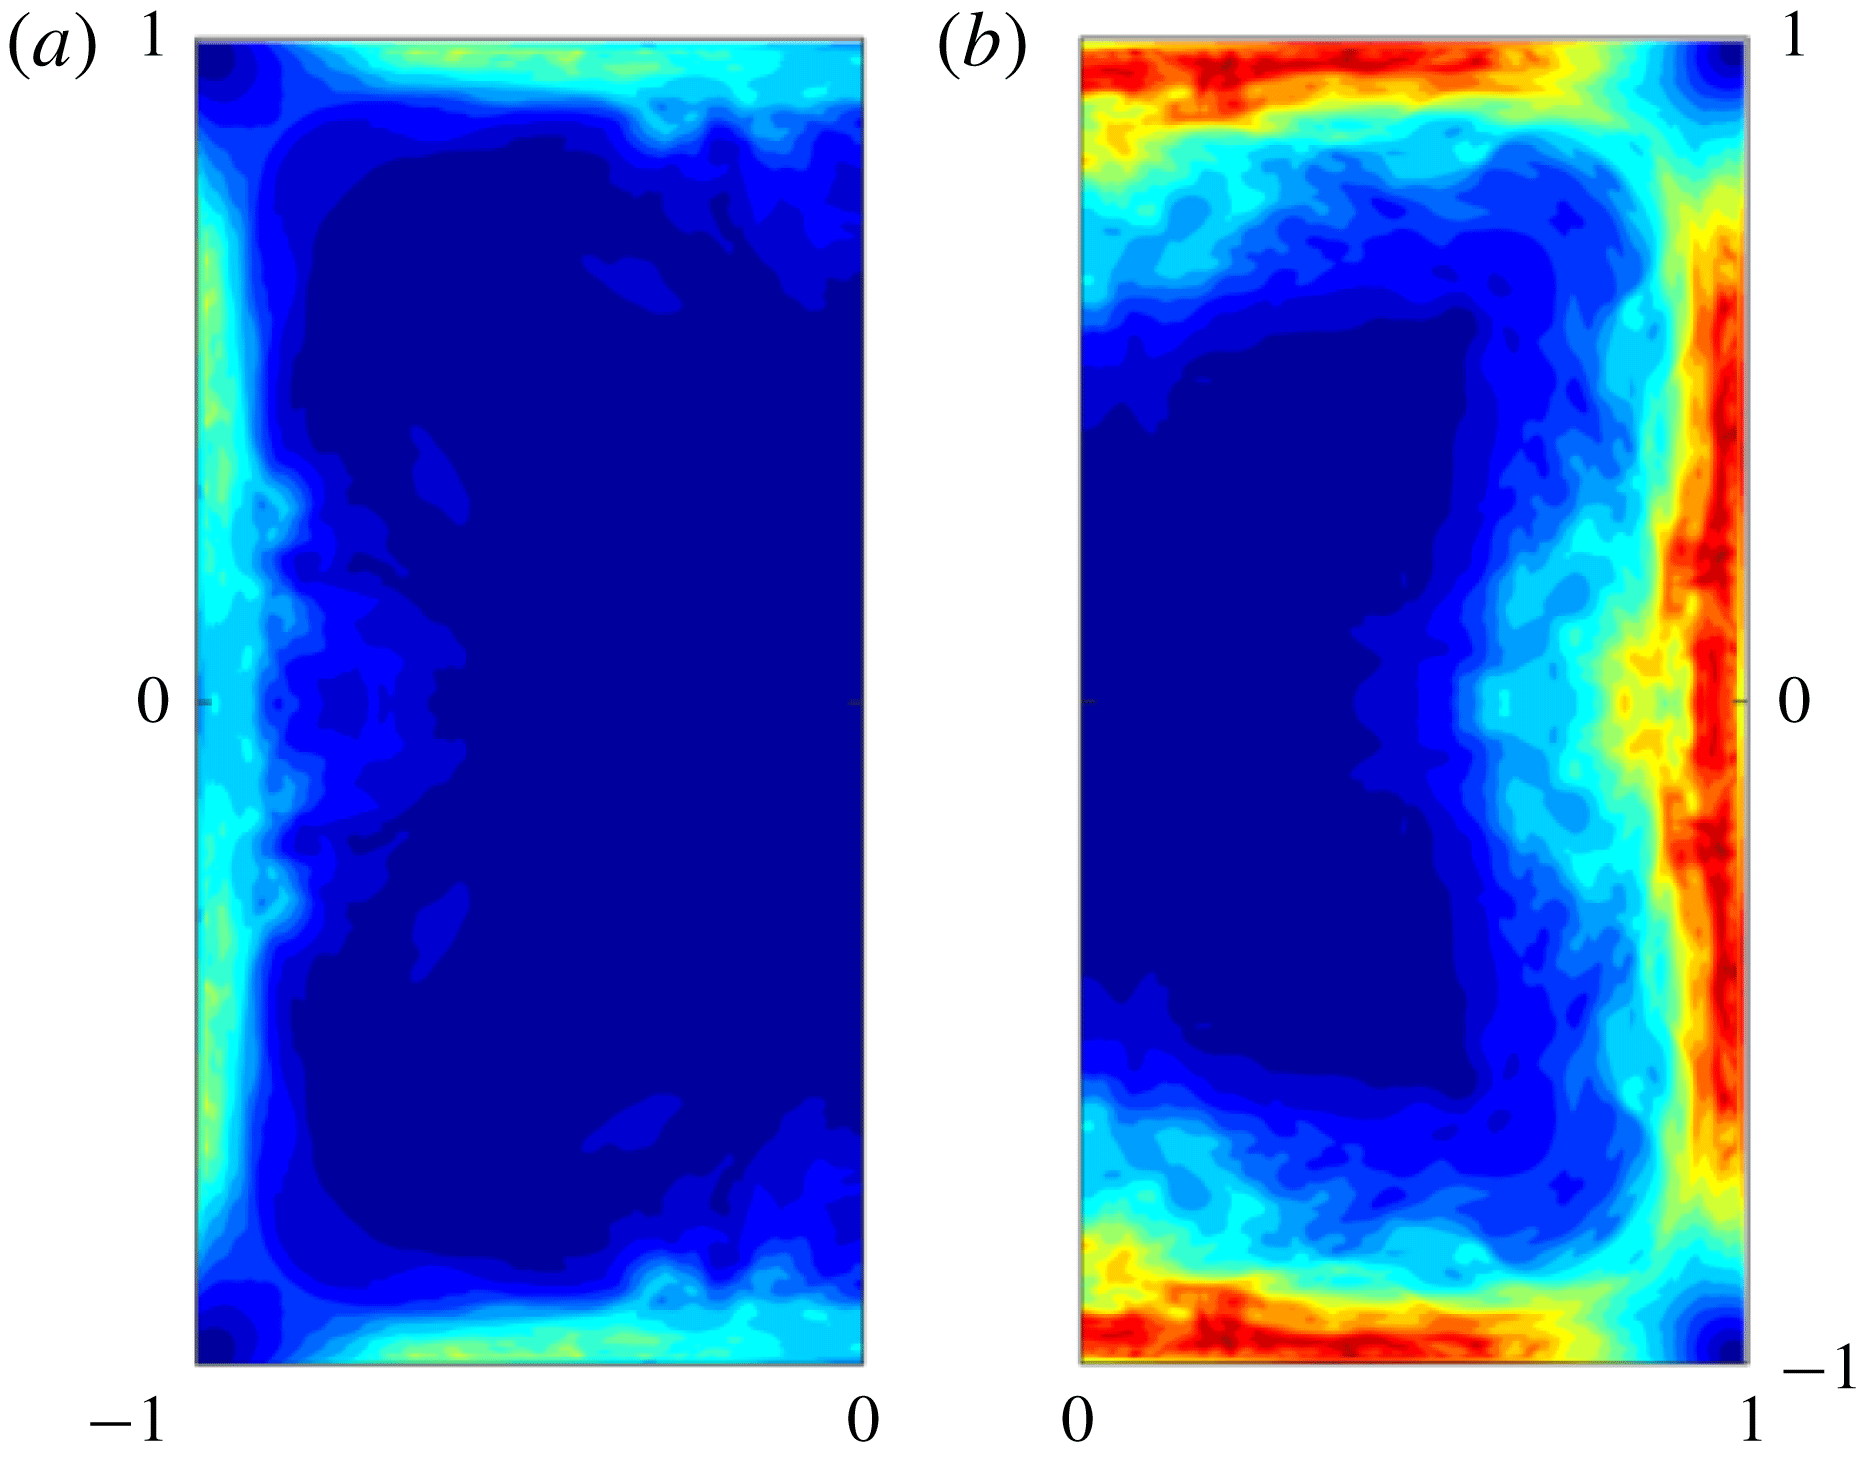
Contours of the mean first normal difference
 ${\mathcal{N}}_{1}$
, with the colour scales ranging from 0 (blue) to 0.8 (red) for the polymeric cases with
 $Wi=1.5$
(a) and
 $Wi=3$
(b).

Finally, we report in figure 18 the effect of the Weissenberg number on the mean first normal stress difference
 ${\mathcal{N}}_{1}$
. This strongly increases with
 $Wi$
, with its maximum value growing from approximately 0.3 for
 $Wi=1.5$
(figure 18
a) to 0.8 in the high-Weissenberg-number case (figure 18
b). We also note that the spatial distribution remains similar for the different
 $Wi$
studied here, with the peak values of
 ${\mathcal{N}}_{1}$
close to the walls and decreasing to almost zero in the centre of the duct and in the four corners. However, while for
 $Wi=1.5$
the region close to the centreline showed small values of the first normal stress difference, with a peak located at a distance of approximately
 $0.5h$
from the sidewalls, the case with
 $Wi=3$
exhibits a more uniform distribution around the wall bisectors, except in the corners, where it remains almost zero.
4 Conclusion
We have performed numerical simulations of a turbulent duct flow with polymers, and compared the results with those of a Newtonian flow. The numerical simulations are direct numerical simulations, where all the space and time scales of the flow are resolved, and the presence of polymers is modelled with the FENE-P closure. The numerical simulations are performed at a fixed moderate Reynolds number
 $Re=2800$
, resulting in a friction Reynolds number of 185 for the Newtonian flow and 155 for the viscoelastic counterpart with
 $Wi=1.5$
,
 $\unicode[STIX]{x1D6FD}=0.9$
and
 $L^{2}=3600$
; thus, the addition of polymers produces a drag reduction of approximately 30 % at the chosen Reynolds number. How the drag reduction is obtained and how it affects the secondary flow present in turbulent duct flows have been examined by various analyses.
We show that the mean streamwise velocity component is larger close to the corners in the viscoelastic flow than in the Newtonian case; the secondary flow is modified, with the locations of the maximum vorticity moving towards the centre, away from the walls, and an increase of the circulation in each of the eight sectors. These effects are observed in the presence of polymers that strongly modifies the quasi-streamwise vortices and the low- and high-speed streaks; in particular, their streamwise coherence is enhanced, they grow in size and depart from the walls, as already documented for turbulent plane channel flows with polymers. It is observed that, on average, each edge hosts up to two high-speed streaks and one low-speed one, similarly to what is found in duct flows at much lower bulk Reynolds number than the one considered here. However, we also found the flow to be deeply different from a Newtonian flow at the same friction Reynolds number.
The change in the near-wall turbulent structures is accompanied by a modification of the turbulent fluctuations and stresses: the streamwise velocity fluctuations increase in the polymeric flow, whereas the in-plane components and the shear stresses are strongly reduced. In particular, it is found that the polymer force tends to reduce streamwise turbulent fluctuations in the bulk of the flow and in the four corners, while promoting those close to the walls, whereas the wall-normal fluctuations are always reduced except in the corners. This is further discussed in connection with the mean streamwise vorticity budget, related to the cross-flow velocity. The analysis reveals that, although the polymeric contribution has a very small amplitude, the presence of polymers in the flow produces macroscopic changes in the flow itself; in particular, the contribution related to the in-plane derivatives of
 $\overline{v^{\prime }w^{\prime }}$
changes sign and becomes a production term, rather than a sink for the secondary motion.
The streamwise perturbation energy budget is also used to discuss the flow modification in the presence of polymers: again, we show that the viscoelastic flow is less uniform than its Newtonian counterpart, with the streamwise turbulent activity displaced farther away from the corners, towards the centreline. Also, the direct contribution of the polymer stress term in the energy budget is small in amplitude, but the polymer addition substantially modifies the flow itself, as for the streamwise vorticity budget.
We investigate the effect of the different parameters defining the viscoelastic behaviour of the fluid, and show that the solution significantly changes with
 $Wi$
. As the Weissenberg number is increased, the cross-stream vortical structures keep increasing in size, with their centre further away from the wall. The slope of the inertial range strongly increases with
 $Wi$
and the mean velocity profile approaches the maximum drag reduction asymptote. All the in-plane velocity fluctuations are strongly reduced by an increase of
 $Wi$
, except for the streamwise component, which on the contrary remains almost unaltered.
Acknowledgements
This work was supported by the European Research Council grant no. ERC-2013-CoG-616186, TRITOS and by the Swedish Research Council grant no. VR 2014-5001. The authors acknowledge computer time provided by SNIC (Swedish National Infrastructure for Computing).
Appendix A. Derivation of the vorticity budget
In this appendix we derive the equation for the mean streamwise vorticity component
 $\overline{\unicode[STIX]{x1D714}}_{x}$
,
 $$\begin{eqnarray}\overline{\unicode[STIX]{x1D714}}_{x}=\frac{\unicode[STIX]{x2202}\overline{w}}{\unicode[STIX]{x2202}y}-\frac{\unicode[STIX]{x2202}\overline{v}}{\unicode[STIX]{x2202}z}.\end{eqnarray}$$
Using the Reynolds decomposition, the instantaneous flow variables are written as the sum of their mean value and fluctuation, i.e.
 $$\begin{eqnarray}u_{i}=\overline{U}_{i}+u_{i}^{\prime },\quad p=\overline{p}+p^{\prime },\quad \unicode[STIX]{x1D70F}_{ij}=\overline{\unicode[STIX]{x1D70F}}_{ij}+\unicode[STIX]{x1D70F}_{ij}^{\prime },\end{eqnarray}$$
so as to obtain the following mean momentum equation:
 $$\begin{eqnarray}\frac{\unicode[STIX]{x2202}\overline{u}_{i}\overline{u}_{j}}{\unicode[STIX]{x2202}x_{j}}+\frac{\unicode[STIX]{x2202}\overline{u_{i}^{\prime }u_{j}^{\prime }}}{\unicode[STIX]{x2202}x_{j}}=-\frac{\unicode[STIX]{x2202}\overline{p}}{\unicode[STIX]{x2202}x_{i}}+\frac{\unicode[STIX]{x1D6FD}}{Re}\frac{\unicode[STIX]{x2202}^{2}\overline{u}_{i}}{\unicode[STIX]{x2202}x_{j}\unicode[STIX]{x2202}x_{j}}+\frac{1-\unicode[STIX]{x1D6FD}}{Re}\frac{\unicode[STIX]{x2202}\overline{\unicode[STIX]{x1D70F}}_{ij}}{\unicode[STIX]{x2202}x_{j}},\end{eqnarray}$$
where we have considered that the mean flow is stationary. The streamwise component of the curl of (A 3) then reads
 $$\begin{eqnarray}\displaystyle & & \displaystyle \frac{\unicode[STIX]{x2202}}{\unicode[STIX]{x2202}y}\left(\frac{\unicode[STIX]{x2202}\overline{w}\,\overline{u}_{j}}{\unicode[STIX]{x2202}x_{j}}+\frac{\unicode[STIX]{x2202}\overline{w^{\prime }u_{j}^{\prime }}}{\unicode[STIX]{x2202}x_{j}}\right)-\frac{\unicode[STIX]{x2202}}{\unicode[STIX]{x2202}z}\left(\frac{\unicode[STIX]{x2202}\overline{v}~\overline{u}_{j}}{\unicode[STIX]{x2202}x_{j}}+\frac{\unicode[STIX]{x2202}\overline{v^{\prime }u_{j}^{\prime }}}{\unicode[STIX]{x2202}x_{j}}\right)\nonumber\\ \displaystyle & & \displaystyle \quad =\frac{\unicode[STIX]{x1D6FD}}{Re}\frac{\unicode[STIX]{x2202}^{2}}{\unicode[STIX]{x2202}x_{j}\unicode[STIX]{x2202}x_{j}}\left(\frac{\unicode[STIX]{x2202}\overline{w}}{\unicode[STIX]{x2202}y}-\frac{\unicode[STIX]{x2202}\overline{v}}{\unicode[STIX]{x2202}z}\right)+\frac{1-\unicode[STIX]{x1D6FD}}{Re}\left(\frac{\unicode[STIX]{x2202}^{2}\overline{\unicode[STIX]{x1D70F}}_{3j}}{\unicode[STIX]{x2202}x_{j}\unicode[STIX]{x2202}y}-\frac{\unicode[STIX]{x2202}^{2}\overline{\unicode[STIX]{x1D70F}}_{2j}}{\unicode[STIX]{x2202}x_{j}\unicode[STIX]{x2202}z}\right).\end{eqnarray}$$
Note that Schwarz’s theorem has been used. By using the definition of streamwise vorticity (A 1), the homogeneity in the streamwise
 $x$
-direction (
 $\unicode[STIX]{x2202}/\unicode[STIX]{x2202}x=0$
), and the incompressibility constraint for the mean flow (
 $\unicode[STIX]{x2202}\overline{v}/\unicode[STIX]{x2202}y+\unicode[STIX]{x2202}\overline{w}/\unicode[STIX]{x2202}z=0$
), one can write
 $$\begin{eqnarray}\displaystyle & & \displaystyle \overline{v}\frac{\unicode[STIX]{x2202}\overline{\unicode[STIX]{x1D714}}_{x}}{\unicode[STIX]{x2202}y}+\overline{w}\frac{\unicode[STIX]{x2202}\overline{\unicode[STIX]{x1D714}}_{x}}{\unicode[STIX]{x2202}z}+\frac{\unicode[STIX]{x2202}}{\unicode[STIX]{x2202}y}\left(\frac{\unicode[STIX]{x2202}\overline{w^{\prime }v^{\prime }}}{\unicode[STIX]{x2202}y}+\frac{\unicode[STIX]{x2202}\overline{w^{\prime }w^{\prime }}}{\unicode[STIX]{x2202}z}\right)-\frac{\unicode[STIX]{x2202}}{\unicode[STIX]{x2202}z}\left(\frac{\unicode[STIX]{x2202}\overline{v^{\prime }v^{\prime }}}{\unicode[STIX]{x2202}y}+\frac{\unicode[STIX]{x2202}\overline{v^{\prime }w^{\prime }}}{\unicode[STIX]{x2202}z}\right)\nonumber\\ \displaystyle & & \displaystyle \quad =\frac{\unicode[STIX]{x1D6FD}}{Re}\left(\frac{\unicode[STIX]{x2202}^{2}}{\unicode[STIX]{x2202}y^{2}}+\frac{\unicode[STIX]{x2202}^{2}}{\unicode[STIX]{x2202}z^{2}}\right)\overline{\unicode[STIX]{x1D714}}_{x}+\frac{1-\unicode[STIX]{x1D6FD}}{Re}\left(\frac{\unicode[STIX]{x2202}^{2}\overline{\unicode[STIX]{x1D70F}}_{32}}{\unicode[STIX]{x2202}y^{2}}+\frac{\unicode[STIX]{x2202}^{2}\overline{\unicode[STIX]{x1D70F}}_{33}}{\unicode[STIX]{x2202}z\unicode[STIX]{x2202}y}-\frac{\unicode[STIX]{x2202}^{2}\overline{\unicode[STIX]{x1D70F}}_{22}}{\unicode[STIX]{x2202}y\unicode[STIX]{x2202}z}-\frac{\unicode[STIX]{x2202}^{2}\overline{\unicode[STIX]{x1D70F}}_{23}}{\unicode[STIX]{x2202}z^{2}}\right).\qquad\end{eqnarray}$$
Finally, the equation can be rearranged to obtain (3.2):
 $$\begin{eqnarray}\displaystyle & & \displaystyle \overline{v}\frac{\unicode[STIX]{x2202}\overline{\unicode[STIX]{x1D714}}_{x}}{\unicode[STIX]{x2202}y}+\overline{w}\frac{\unicode[STIX]{x2202}\overline{\unicode[STIX]{x1D714}}_{x}}{\unicode[STIX]{x2202}z}+\frac{\unicode[STIX]{x2202}^{2}}{\unicode[STIX]{x2202}y\unicode[STIX]{x2202}z}\left(\overline{w^{\prime }w^{\prime }}-\overline{v^{\prime }v^{\prime }}\right)+\left(\frac{\unicode[STIX]{x2202}^{2}}{\unicode[STIX]{x2202}y^{2}}-\frac{\unicode[STIX]{x2202}^{2}}{\unicode[STIX]{x2202}z^{2}}\right)\overline{v^{\prime }w^{\prime }}\nonumber\\ \displaystyle & & \displaystyle \quad =\frac{\unicode[STIX]{x1D6FD}}{Re}\left(\frac{\unicode[STIX]{x2202}^{2}}{\unicode[STIX]{x2202}y^{2}}+\frac{\unicode[STIX]{x2202}^{2}}{\unicode[STIX]{x2202}z^{2}}\right)\overline{\unicode[STIX]{x1D714}}_{x}+\frac{1-\unicode[STIX]{x1D6FD}}{Re}\left(\frac{\unicode[STIX]{x2202}^{2}\overline{\unicode[STIX]{x1D70F}}_{32}}{\unicode[STIX]{x2202}y^{2}}+\frac{\unicode[STIX]{x2202}^{2}\overline{\unicode[STIX]{x1D70F}}_{33}}{\unicode[STIX]{x2202}z\unicode[STIX]{x2202}y}-\frac{\unicode[STIX]{x2202}^{2}\overline{\unicode[STIX]{x1D70F}}_{22}}{\unicode[STIX]{x2202}y\unicode[STIX]{x2202}z}-\frac{\unicode[STIX]{x2202}^{2}\overline{\unicode[STIX]{x1D70F}}_{23}}{\unicode[STIX]{x2202}z^{2}}\right).\qquad\end{eqnarray}$$