

Introduction
The transition in Britain during the nineteenth century from a predominantly rural and agrarian society to an urban one had a profound effect on rural areas as agriculture lost its role as a mainstay of the economy. Yet people continued to live in, and earn their living from, the countryside. Agriculture was adapted to meet the growing demand of towns and cities for food and fodder. This was facilitated by developments in transport such as improved roads and the growth of the railways. Increasing imports during the second half of the nineteenth century contributed to a fall in the price of many foodstuffs. British agriculture has been seen as successive periods of prosperity, depression and recovery: from the golden age of high farming in the 1850s to 1860s, through the agricultural depression of around 1875 to 1896, a revival at the turn of the century, to the depression of the 1920s to 1930s.Footnote 1 This article analyses the extent to which these issues were reflected in an individual rural community and the local factors that had an influence on economic activity.
Barry Reay has demonstrated how microhistories, by ‘placing a small community under the microscope’, enable us to ‘to see and explore the complexity of social interaction and social and economic processes’.Footnote 2 Reay uses oral, demographic and social structural material to examine changes in three parishes in the Blean area of Kent from 1800 to 1930. John Godfrey and Brian Short also use record linkage to examine the ownership and use of land over time in communities on the South Downs in Sussex.Footnote 3 This research draws on elements of both these approaches to focus on the rural economy of the parish of Hockley in south-east Essex over the period 1840 to 1916. The study uses the tithe apportionment, farm inventories, agricultural returns, census enumerators' books, trade directories and sales catalogues to examine how the landscape of the parish was exploited by landowners and farmers and the employment opportunities that were available.Footnote 4 The changing pattern of rural occupations demonstrates the extent to which factors such as the location and topography of the parish, the agricultural depression and the arrival of the railway played a part in the available occupational opportunities and the extent of the ‘flight from village England’.Footnote 5
1. The landscape and its exploitation
Hockley was a large parish of about 4,600 acres situated on the Rayleigh hills in south-east Essex. The landscape comprised several elements: woodland; arable fields; pasture; marsh; saltings; and the tidal reach of the river Crouch which formed the northern boundary of the parish. All these elements were used as a resource on which the rural economy was based. The woodland was principally on the higher ground to the south and consisted of hornbeam and chestnut coppice plus standard oak trees. The coppice was harvested on a five to ten year cycle for fencing, wattle and fuel; standard trees were used for carpentry wood such as planks, wheels and structural timbers; and the underwood as a cover for game. Oliver Rackham suggests this pattern of management and utilisation had existed for centuries.Footnote 6 In 1840 there were about 250 acres of woodland in the parish, an amount that did not change significantly during the study period.Footnote 7 The woodland supported woodsmen, sawyers, carpenters and game keepers. The gently sloping hills consisted of heavy but fertile London clay. This has been called ‘three-horse land’ being less easy to cultivate than two-horse boulder-clays and one-horse light soils but was considered to be good corn country.Footnote 8 The clay was also a resource for brick and tile making. A sixteenth-century tile kiln has been identified and two brickworks were established in the nineteenth century.Footnote 9 Adjacent to the river Crouch were saltings, marsh and low-lying fields. These were subject to inundation and water-logging and therefore unsuitable for arable cultivation but were ideal for grazing sheep. The 1840 tithe apportionment indicates a total of twenty-four acres of seawall and seventy acres of saltings.Footnote 10 The saltings and marsh had the advantage that the land did not dry out in summer; the salt reduced the risk of sheep liver fluke and foot rot; and the flavour of the mutton was said to be excellent.Footnote 11 The tidal reach of the river Crouch provided other opportunities for exploitation. Tom Richardson contends that ‘the economy of Essex was dominated by a progressive agricultural sector which had strong commercial links with London’.Footnote 12 The river was used to export grain, straw, hay, sheep and bricks to London and elsewhere on shallow-draught barges called ‘stackies’ and to import coal, ‘London Muck’ (manure), and chalk for conditioning the clay soil.Footnote 13 The river provided livelihoods for boat builders, bargemen, fishermen, oyster growers and a ferryman. The location and landscape of Hockley therefore provided a wide range of opportunities for exploitation and rural livelihoods.
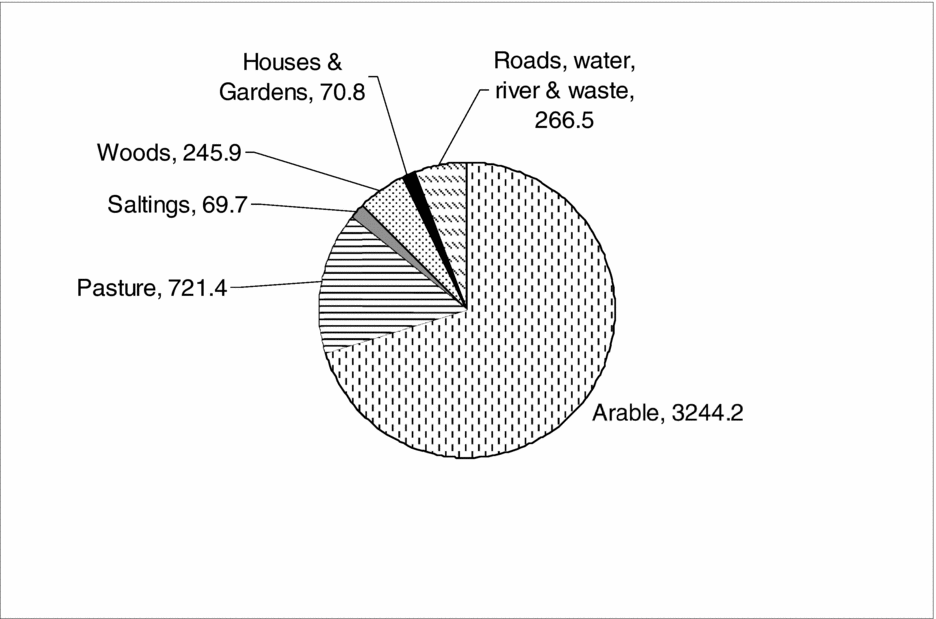
The tithe apportionment survey, undertaken in 1839–40, provides a snapshot of land use for both the parish as a whole and for individual farms.Footnote 14 The overall acreage of land use in Hockley is shown in Figure 1. Over seventy per cent of the land was used for arable cultivation which was characteristic of Essex as ‘the proudest of the corn counties’.Footnote 15
Overall land-use acreage in Hockley, 1839–40.
Source: Essex Record Office, Tithe Commissioners Papers, D/DOp/B39/44/1.

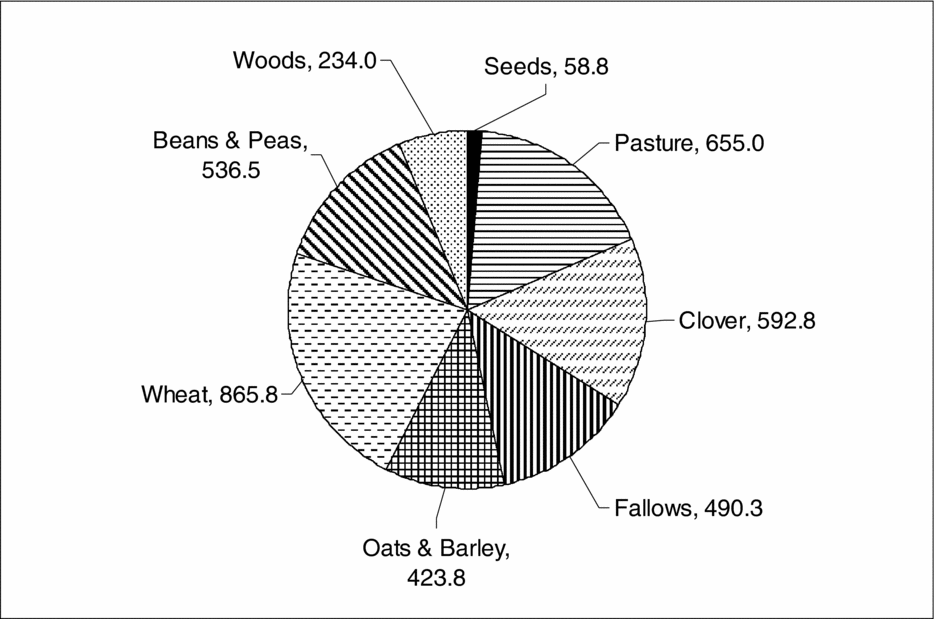
The tithe apportionment provides details of the specific crops, as shown in Figure 2. Wheat accounted for nearly a quarter of the cultivated acreage. Essex had also traditionally produced large amounts of hay and oats for sale in London, a trade to which Hockley contributed.Footnote 16 The tithe apportionment indicates that most farms in Hockley comprised fields of arable, pasture, clover and fallow which suggest that mixed arable and livestock farming was practised. The period from the 1840s until the mid 1870s has been called the golden age of high farming.Footnote 17 High farming or high feeding was a mixed farming system intended to produce a profit for the farmer, to provide a rent to the landowner and to maintain and improve the quality of the land. Cereals for sale, root crops and grasses were grown in rotation with some fallow fields every year. Manure from livestock improved the yield of cereals and fodder and conditioned the soil. Rotational or temporary grasses such as clover, lucerne and sainfoin, together with peas and beans which fixed nitrogen in the soil, were grown together with fodder crops such as turnips and mangolds which were fed to stalled cattle in winter together with purchased oil-cake. As David Grigg notes, mixed farming had economic advantages as dairy produce and meat could be sold throughout the year providing a regular income rather than the single annual return from cereals.Footnote 18 Diversification also provided some protection against changing prices. However, Jim Holderness has argued that high farming was high risk farming based on a premise of maximum production at any cost and could not redress the consequences of falling world prices from the mid nineteenth century.Footnote 19
Cultivated land acreage in Hockley, 1839–40.
Source: ERO, Tithe Commissioners Papers, D/DOp/B39/44/1.

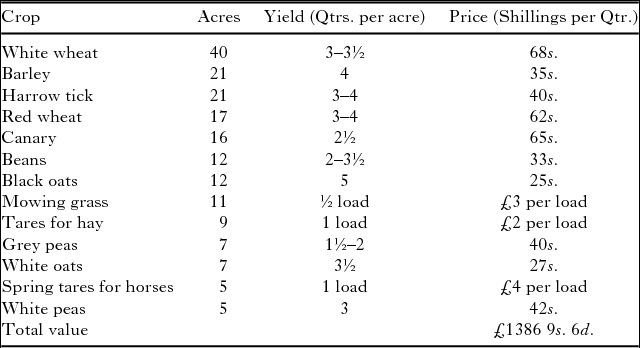
The system of mixed farming in Hockley is exemplified by the 334 acre Plumboro Mount farm. An inventory and valuation of the property in 1840 provides an insight into the management of the farm.Footnote 20 The range and extent of the growing crops are shown in Table 1. The diversity was typical of mixed farming with crops grown for green folder, hay or dry feed, i.e. oats, but with the majority of the farm's acreage devoted to cereals such as wheat and barley intended for sale. The inventory also gives an insight into the yield of the farmland and the local price of cereals and fodder crops.
Growing crops at Plumboro Mount farm Hockley, July 1840.

Source: ERO, An Inventory & Valuation Plumboro Mount Farm 2nd July 1840, D/DOp/B68.
There was a wide range of livestock on the farm. This included eighty-seven ewes, twenty-one hoggetts, 107 lambs and three South Down rams. The sheep were bred, fattened and sold or slaughtered for meat; there were also eighty-seven fleeces of down wool and twenty-four fleeces of hoggett wool itemised. There were six cows together with six calves and ‘weaners’, the relatively small number indicates that dairy production was not on a large scale; milk and dairy products were produced for consumption on the farm and sold locally. The four sows and twenty-nine ‘store pigs’ were being fattened for meat. Other faming stock were twelve horse and colts for transport and for working the land; sixty head of poultry; thirty hens; two cocks; and four ducks, these were kept for eggs and meat for sale. The high farming practice of feeding oil-cake to livestock is evident in the 150 oil-cakes and the oil-cake cutter in the inventory. The only machinery on the farm was a chaff cutting machine, a reaping machine and a clover seed blower. There were significant quantities of crops stored in barns, including rough chaff wheat, threshed and unthreshed wheat and oats, white wheat and clover hay. Hay and oats would have been kept for feeding livestock and for sale but the seventy-five quarters of white wheat (valued at £255 0s. 0d.) would have been the produce from the previous year and remained unsold in July 1840. Plumboro Mount farm was therefore typical of mixed farming, growing cereals and fodder crops together with a range of livestock for dairy produce, eggs, meat and fleeces to generate income for the tenant.
2. Agriculture: changing patterns of land use
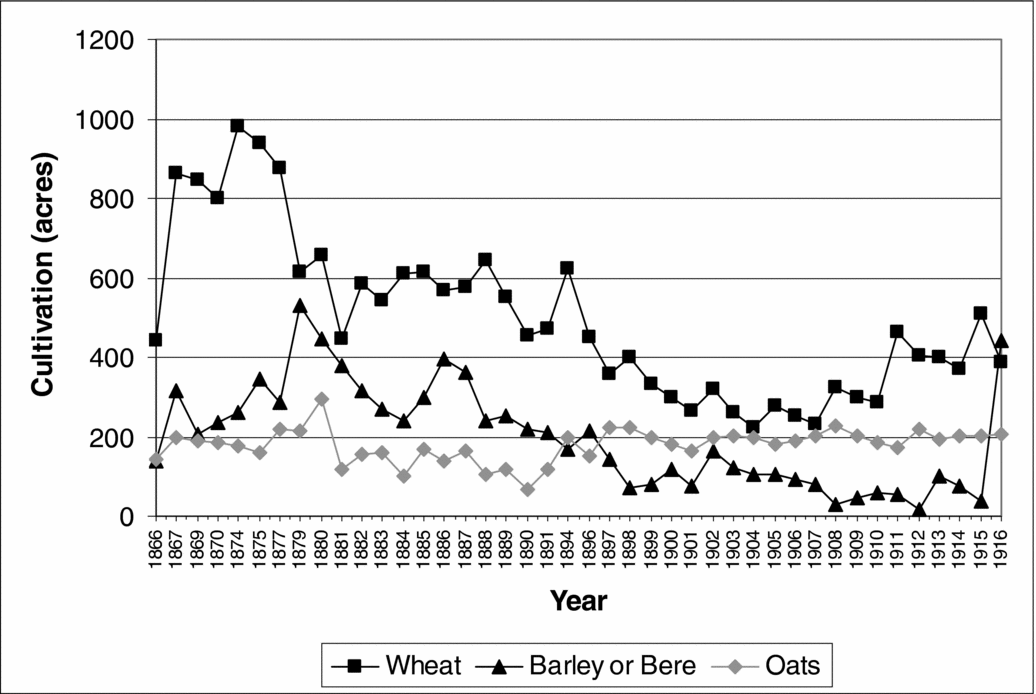
The pattern of mixed farming in Hockley continued through the high farming middle decades of the nineteenth century. Urbanisation and the rapid growth of British cities had created a large and expanding market for agricultural produce.Footnote 21 Increasing demand led to rising prices and greater prosperity for farmers. The agricultural returns from 1866 provide a chronological series of land use and livestock numbers. The acreage of the main cereal crops grown in Hockley over the period 1866 to 1916 are shown in Figure 3.Footnote 22
Cultivation of cereal crops in Hockley, 1866–1916.
Source: The National Archives (TNA), Essex agricultural returns, MAF 68.

In the mid 1870s up to 1,000 acres of wheat were being grown in Hockley. This demonstrates the continuity from the late 1830s when there were 886 acres of wheat. Cereal production was seriously affected by a number of wet years and poor harvests in the late 1870s culminating in the exceptionally wet year of 1879. Low domestic yields and high demand had previously kept prices high, but by the late 1870s increasing cereal imports were meeting more of the demand. Wheat imports into Britain in 1872 accounted for 48.3 per cent of demand, this increased to 80.8 per cent by 1913. Transport costs also fell. In 1902 the cost of transporting wheat from Chicago to Liverpool was 3s. a quarter.Footnote 23 As a consequence of these factors, the price of wheat nearly halved, from 58s. 8d. per quarter in 1873 to 31s. 8d. in 1913.Footnote 24 The decline of wheat production in Hockley from 1874 is evident in Figure 3. By the turn of the century, only 200 to 300 acres of wheat were being grown. The situation in Hockley matches the decline in wheat production in Essex as a whole. In 1896 the acreage of wheat in both the parish and the county was forty-six per cent of its 1874 figure.Footnote 25 The price of oats and barley also fell but less sharply than wheat.Footnote 26 In Essex the acreage of barley fell by thirty-six per cent between 1874 and 1895, but in Hockley the acreage only fell by eighteen per cent, half the county value.Footnote 27 Figure 3 indicates the switch from wheat to barley in the late 1870s as farmers attempted to take advantage of the differential prices between cereals. However, in the long term barley acreage also fell in Hockley to just eighteen acres in 1912. E. H. Hunt and S. J. Pam, in their study of Essex farms, note that there was a twenty-seven per cent rise in the acreage of oats in Essex between 1892 and 1895 at a time when its price was falling but when wheat prices were plummeting.Footnote 28 This is reflected in Hockley where the oat acreage increased by a more substantial sixty-one per cent over this period. The partial recovery in agriculture from the turn of the century is evident in the increase in the acreage of wheat in Hockley from about 1904.
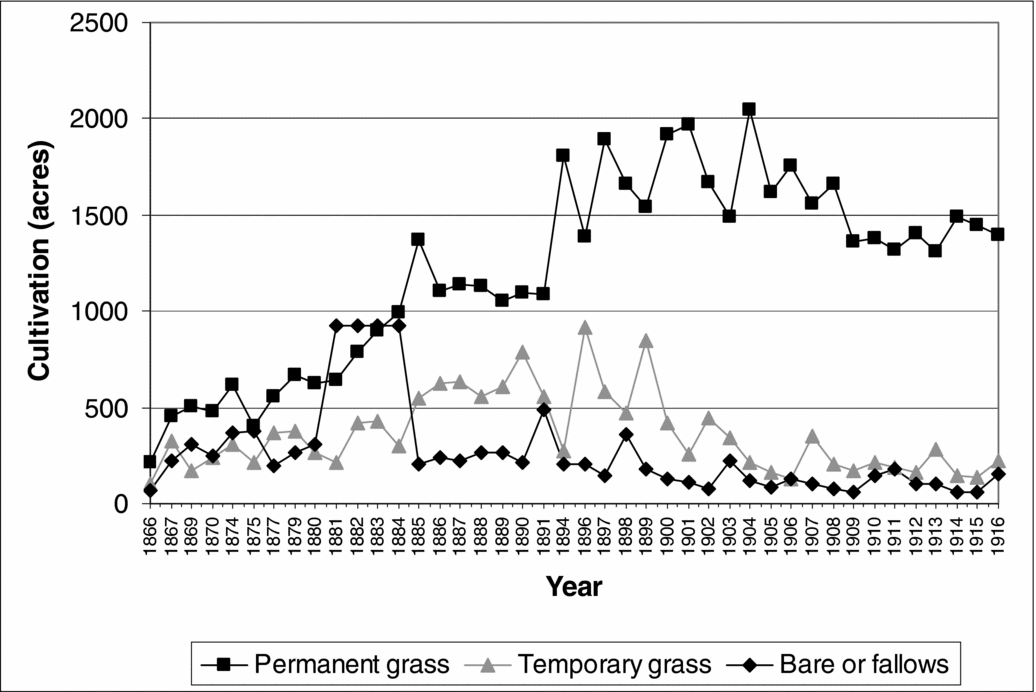
For farmers the depression of around 1875 to 1896 and the associated fall in the price of cereals led to a move from arable to livestock farming. This is reflected in the change in the cultivated acreage of grasses and fallows for Hockley shown in Figure 4. The most significant change was the increase in the acreage of permanent grasses which tripled from 670 to 2,047 acres between 1880 and 1904. There was also an increase in the acreage of temporary grasses in the late 1890s. These increases are consistent with the switch from arable to livestock farming and reflect wider patterns across southern England.Footnote 29 The shift to pasture was not unproblematic: in 1907 it was noted that ‘Essex is far more suited climatically for wheat-growing, being sunny and dry in Summer, too dry for the best pasture’.Footnote 30 The direct effects of the agricultural depression are evident in Figure 4 in the increase in the acreage of fallow and bare land in the early 1880s. Prior to the depression, bare and fallow land in the parish comprised around 300 to 400 acres, this increased to nearly 1,000 acres in the period 1881 to 1884. After 1885 the amount of bare fallow gradually decreased as land was brought back into cultivation or was reclassified as rough pasture. Farmers also changed from ‘high’ to ‘low’ farming. As Hunt and Pam note, farmers were less assiduous about weeding, hedging and ditching and moved towards rough grazing and growing grass for hay. Land was used less intensively and with less labour, part of a process of converting arable to grassland without the expenditure necessary to make good pasture on heavy clay soil.Footnote 31
Cultivation of grasses and fallows in Hockley, 1866–1916.
Source: TNA, Essex agricultural returns, MAF 68.

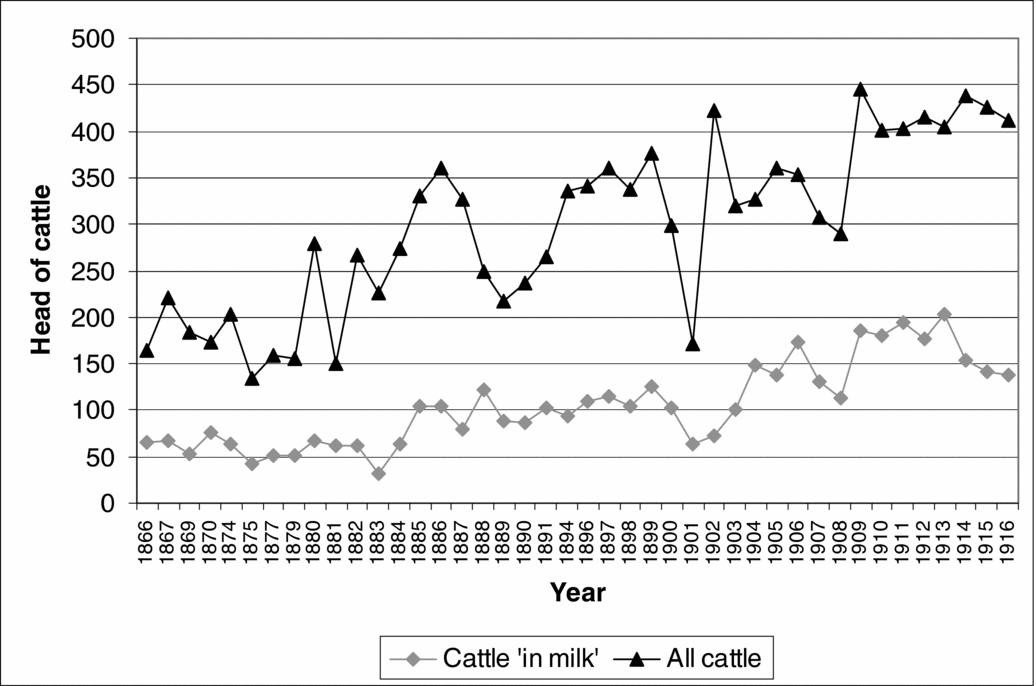
The numbers of livestock in Hockley are shown in Figures 5 and 6. Cattle numbers more than doubled in the five years from 1881 to 1886 demonstrating a decisive switch to livestock farming following the start of the agricultural depression. As Peter Wormell has said ‘Essex farmers turned to dairying in depressed times, and reduced their herds when conditions improved’.Footnote 32 The increase in cattle is consistent with the greater acreage of pasture shown in Figure 4. Hunt and Pam have assessed groups of parishes in Essex and examined the effect of soil types and the proximity to railways, and hence urban markets, and how these factors influenced crop acreage, cattle numbers and milk supplies.Footnote 33 They argue that for parishes like Hockley, although this was not part of their study, with heavy clay soil and late access to the railway, the cereal acreage reduced considerably to be replaced by stock raising and then dairying as access was gained to the urban milk market. The demand for milk in London grew by twenty-five per cent per decade from 1880 to 1910.Footnote 34 The Great Eastern Railway was opened through Hockley in 1889, and this appears to correspond with a rising number of dairy cattle to supply the milk trade. In the fifteen years prior to 1881 there were on average sixty head of dairy cattle in Hockley, this increased to 101 in the fifteen years following the arrival of the railway. The milk was sent to the early morning milk market at Liverpool Street station.
Numbers of dairy and non-dairy cattle in Hockley, 1866–1916.
Source: TNA, Essex Agricultural returns, MAF 68.

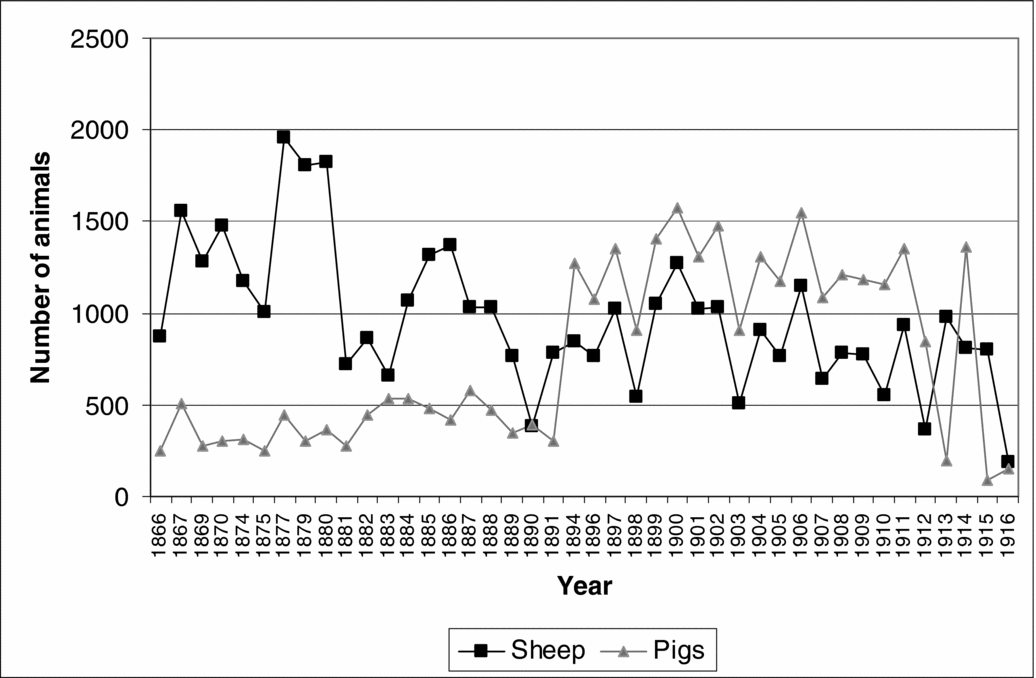
Numbers of sheep and pigs in Hockley, 1866–1916.
Source: TNA, Essex agricultural returns, MAF 68.

The agricultural returns also identify other livestock such as sheep and pigs whose numbers in Hockley are shown in Figure 6. The wet weather of the late 1870s affected livestock as well as crops with, nationally, an estimated loss of six million sheep through foot-rot in 1880–81.Footnote 35 In Hockley the number of sheep fell by two thirds in the four years from 1879 to 1883. Sheep husbandry partly recovered after 1883 but numbers in Hockley did not return to their former level and there was a gradual reduction in the number of sheep over the following decades. The decline reflects both the reduced demand for wool and the associated fall in its price as well as the effect of the increasing dominance of imported lamb and mutton.Footnote 36 In 1872 meat imports accounted for 13.6 per cent of British consumption but this had risen to 42.3 per cent by 1912.Footnote 37 As with dairy imports, this trade was facilitated by ocean going bulk transport and refrigeration.Footnote 38 Pig rearing was often seen as a casual adjunct to farming and Hunt and Pam claim that there was ‘little long-term increase in the Essex (or national) pig population’.Footnote 39 Yet there was a marked and sustained increase in the numbers of pigs in Hockley in the 1890s and 1900s which indicates that this was seen as a profitable enterprise by some local farmers.
The agricultural returns indicate an increase in market gardening from the mid 1890s. This reflects a wider trend in Essex in this period, with farmers specialising in produce for local market towns and for sale in London, facilitated by the railways.Footnote 40 Prior to 1894 there were no more than seven acres of market gardens, orchards and soft fruit in Hockley but this increased to 16.5 acres by 1900 and forty-one acres in 1912. In 1901 there were eleven market gardeners described variously as nurserymen, florist, fruit grower or tomato grower.Footnote 41 A sizable market existed for horticultural produce as described in a sales catalogue of the ninety-four-acre Wadham Park farm in 1903. The catalogue lists the merits of the farm including ‘a greenhouse fitted with hot-water piping . . . two acres of productive kitchen garden . . . from 1,200 to 1,300 assorted Fruit Trees planted on the property (six years)’. It also noted that ‘the land is in grass in excellent order . . . much improved at considerable expense during the present owner's occupation’.Footnote 42 Notwithstanding perhaps a degree of hyperbole about the owner's investment, the catalogue is equivocal about how the property might be developed: ‘the Estate lends itself to an easy scheme of development for sub-dividing into suitable lots for Good-class Residences, Fruit Growing, Market Gardening, Horticulture, Poultry Rearing, Dairy Farming, &c, being within easy access of Southend-on-Sea, where produce commands a ready market’. The growing town of Southend-on-Sea was seven miles from Hockley by railway. These statements reinforce Hunt and Pam's observation about the purchase of smallholdings close to towns and railway stations as sometimes ‘less for their horticultural potential, as in the expectation of an early resale to speculative builders’.Footnote 43 The microhistory of Hockley has therefore identified patterns of land use and animal husbandry, the access to urban markets and the shift from arable to livestock farming, as a consequence of the agricultural depression. The next section examines land ownership, rural employment and the pattern of agricultural labour and livelihoods in the parish.
3. Rural economy: landowners, farms and agricultural occupations
In 1840 there were sixty-three landowners in the parish of Hockley. These ranged from institutions and charities to private individuals with either multiple holdings or just a cottage and garden. Only thirteen of these landowners were owner-occupiers and these were generally smaller holdings.Footnote 44 Many of the larger landowners were absent landlords who held the property as an investment or which were run as a business and a source of income. For example, in 1840 the landowner with the largest acreage in Hockley was Robert Bristow ‘a gentleman of Lincoln’ who owned 566 acres, about one-eighth of the area of the parish, comprising three farms occupied by tenant farmers plus sixty-five acres of woodland. Other examples are Blunts farm owned by Stephen Cleasby, a London merchant, and Plumboro Mount farm, owned by the stockbroker Walter Otte of Homerton. The capitalist aspect of land ownership is also reflected in the number of institutions that owned land including Christ's College Cambridge; Christ's Hospital; Sion College; and the Dean and Chapter of St Paul's. The 1840 tithe apportionment identifies twenty-seven farms and the 1841 census names twenty-one farmers, indicating that some farmers were managing two or more farms. For example, in the tithe apportionment William Law is the stated occupier of both Shepherds farm and Hockley farm which had different owners.
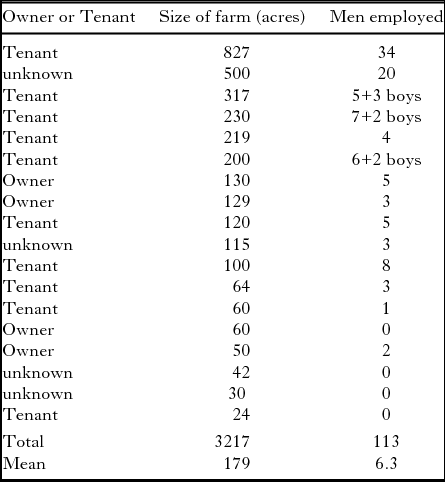
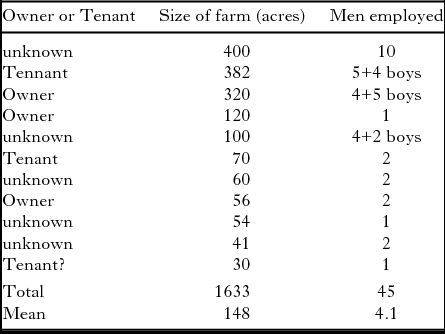
Leigh Shaw-Taylor has analysed the census returns for 1851 to reveal the geography of farm size and employment patterns which he suggests were indicators of the relative importance of agrarian capitalism and family farming.Footnote 45 He argues that large scale agrarian capitalism was dominant in the south and east of England. However, the structure of landownership in Hockley does not entirely support this contention. Land ownership was not concentrated in the substantial estates as, for example, also identified by Godfrey and Short on the South Downs; in Hockley ownership was widely distributed amongst a number of individuals and institutions.Footnote 46 The 1851 census enumerators' books are the earliest ones that provide information on the size of farms and the number of employees. The data for Hockley are summarised in Table 2.
Hockley farmers, 1851.

Source: Census Enumerators' Books, Hockley, 1851 and ERO, Tithe Apportionment (D/CT 181A) and Tithe Commissioners Papers (D/DOp/B39/44/1), 1840.
The mean farm size in Hockley closely matches the mean of 173 acres of Essex farms in 1851.Footnote 47 Shaw-Taylor has argued that the key variable in indicating the pattern of ownership is the ratio of farm labourers to farmers rather than farm size.Footnote 48 The ratio of farmworkers to farmers for Essex as a whole was 10.6 and Shaw-Taylor notes that ‘everywhere south and east of a line from Dorset to the Wash the ratio . . . exceeded 7 to 1’. The ratio for Hockley from Table 2 is 6.3 and therefore less than the Essex and regional mean. The farmworker/farmer ratio in Hockley is closer to those counties in a line from Somerset to the East Riding where there was a mixture of family farms and small-scale rather than large-scale agrarian capitalism.Footnote 49 Shaw-Taylor warns that farmworker/farmer ratios are ‘not likely to be a reliable indicator of agrarian capitalism at the parish level’.Footnote 50 Nevertheless, the diversity of ownership identified in the tithe apportionment agrees with the relatively low ratio as an indicator of the landownership pattern in Hockley. The number of agricultural labourers and farm workers in Table 2 only accounts for about sixty per cent of the agricultural workers in the parish. In 1851 there were a total of 177 agricultural workers, some of whom would have worked on their own smallholdings rather than on farms. Using this figure gives a farmworker/farmer ratio of 9.8 which is closer to, but still less than, the mean for Essex. Hockley, with its relatively large number of family farms and small scale agrarian capitalism, was therefore atypical of the large scale agrarian capitalism of the region.Footnote 51 Whether this pattern is reflected in other parishes in south-east Essex has yet to be established. Table 2 also demonstrates that smaller farms below about sixty acres were generally farmed without additional labourers but often with the help of the farmer's family. Edward Higgs says of the censuses that in the case of farms the ‘kin of the householder were almost automatically assumed to be helping with agricultural tasks’.Footnote 52 This is illustrated by Samuel Watson, a farmer of 120 acres with five labourers, his two sons aged nineteen and fifteen were designated ‘Farmer's son’ and are likely to have worked on the farm, but his younger children aged four and three were not shown as ‘Farmer's son/daughter’. In the mid nineteenth century there appears to have been little farm mechanisation in Hockley. It has been suggested that agricultural labourers were often ‘replaced if not displaced by new labour-saving technology’ although there is limited evidence of this in Hockley.Footnote 53 Two agricultural engine drivers are mentioned in the 1861 census enumerators' books but not in any of the other censuses.Footnote 54 Stephen Caunce has argued that ‘under British conditions, horses were under no threat of replacement in any work they had traditionally done before 1914’.Footnote 55 He notes that nationally horse numbers increased by a quarter between 1870 and 1914, however in Hockley numbers only increased modestly from 156 to 166 between these dates. This suggests that the shift from arable to livestock farming did not entail a significant increase in the number of horses required for agricultural work.
The number of farmworkers and farmers in the parish remained fairly constant during the 1850s and 1860s up to the 1871 census. However, even during its golden age, farming was an insecure occupation. In 1861 three farmers were described as ‘out of business’. The agricultural depression from the mid 1870s had a dramatic impact on the rural economy. A. F. J. Brown notes that ‘in villages all over Essex many who had occupied farmhouses in 1871 were no longer in them a decade later’.Footnote 56 This is true of Hockley: fifteen farms are named in both the 1871 and 1881 census enumerators' books, yet only three of the farmhouses have the same occupier. A significant reduction in agricultural employment is evident from the 1881 census enumerators' book which identifies only 156 agricultural labourers. Numbers fell further to 113 in 1891 and 108 in 1901. In 1881 there were only eleven named farmers. This was a low point of the agricultural depression when some farms were untenanted.Footnote 57 The data on farms from the 1881 census are shown in Table 3. The number of men and boys employed was considerably less than in 1851, and similar sized farms were being run with fewer labourers, from a mean of 6.3 farmworkers per farm in 1851 to 4.1 in 1881. This evidence suggests a significant ‘flight from agriculture’ in this period.
Hockley farmers, 1881.

Source: Census enumerators' books, Hockley, 1881.
In addition to giving details of farm size and numbers of farmers and agricultural labourers, the census enumerators' books provide details of specialist agrarian work. Occupations in 1851 included six gardeners, two grooms, a haybinder, a horse clipper and a shepherd. Later censuses indicate a greater diversity of agricultural occupations and give an insight into farming practices. For example, the 1901 census enumerators' books mention a cowman, stockman overlooker, farm foreman, gamekeepers, grazier, grooms, haybinders, horse foremen, horsemen and a teamster. Some of these occupations indicate cattle rearing and dairying which was then being widely practised in the parish. The increased specialisation in agricultural activities may, however, be a consequence of more precise recording of occupational information in the later census enumerators' books.
4. Rural economy: crafts, trades and other occupations
In addition to agriculture and horticulture, a range of rural craft and trades were being practised in Hockley. In 1841 there were four blacksmiths, two wheelwrights, three shoemakers, eleven carpenters and one sawyer. The large number of people associated with timber reflects the extensive woods in the parish. Many crafts continued throughout the century; however the failure of farms and falling agricultural profits from the late 1870s, together with a reduction in the population, meant that there was less custom for village craftsmen such as blacksmiths and wheelwrights.Footnote 58 For example, there were six blacksmiths in 1871 and 1881, five in 1891 and three in 1901. Similarly there were seven wheelwrights in 1881 but only two in 1901. The three shipwrights/yacht builders in 1841 and 1861 had dwindled to one by 1871 after which they no longer appear in the census enumerators' books; the railway appears to have largely superseded barges and ships for the carriage of goods. The reduced number of craftsmen and tradesmen also reflects the decline in rural trades seen in other areas in south-east England.Footnote 59 Craftsmen had to compete against factory production for some of the goods that they had traditionally produced. For example, there were six shoe- or boot-makers in 1851 but only one in 1914. Basket, brush, and hat makers are identified in the early censuses but none are recorded in 1901. The pattern reflects Michael Thompson's statement that from about 1871 ‘the numbers of rural craftsmen, engaged in servicing local communities and the local economy, began to thin out’ as rural areas became deindustrialised and manufacturing became more concentrated in towns.Footnote 60 In contrast to this decline there was a significant increase in new non-agricultural trades and livelihoods being undertaken in Hockley. In 1901 these included: apprentice; apprentice engineer; builders; bricklayers; electrical engineer; printers; compositor; lithographer; draughtsman; and scientific instrument maker. Many of these were new occupations some of which were associated with new technologies such as electricity. Therefore looking at craftsmen overall, Trevor Wild's gloomy assessment of the departure of craftsmen damaging village self-sufficiency and community spirit is not entirely supported in Hockley. Although many traditional crafts and trades declined, livelihoods in new trades developed.Footnote 61
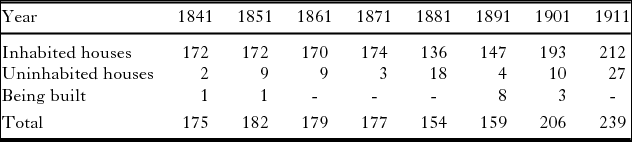
Extensive house building took place in Hockley from about 1891. Data on the number of houses, determined from the census enumerators' books, are shown in Table 4. At the height of the agricultural depression in 1881 one in eight houses was uninhabited. The data show that the housing stock in the parish increased by thirty per cent in the decade between 1891 and 1901 and continued to increase. The census enumerators' books and trade directories identify six builders and bricklayers in Hockley in 1901. C. A. Crompton has noted that ‘builder/bricklayer was the most erratic of the occupational groups’ with the least correspondence with the threshold population necessary to support a trade.Footnote 62 The builders and bricklayers in Hockley may have been itinerant, travelling to speculative building projects; none had been born in the parish. The building activity appears to be associated with the opening of the railway in 1889 which increased opportunities for in-migration and commuting. The population of Hockley was increasing at this time as shown in Figure 10. The building work would have required carpenters which may account for their sustained numbers in contrast to the decline of several traditional rural crafts. Among the latter were thatchers whose numbers declined from five in 1841 to two in 1891 after which they disappear. This appears to be related to architectural changes: the vernacular architecture of south-east Essex was weatherboard and thatch but this changed to brick-built tiled-roof buildings from the second half of the nineteenth century.
Number of houses in Hockley, 1841–1911.

Source: Census enumerators' books, Hockley, 1841–1911.
The river Crouch and its wharves were also associated with trade and livelihoods. In 1851 there were two fishermen and a ferryman, and in 1901 an oyster grower was active.Footnote 63 The potential for flooding of the low-lying areas of the parish also appears to have been an issue as there are five ‘seawallers’ mentioned in the 1901 census enumerators' books. Before the arrival of railways, for villages like Hockley with ready access to a navigable river and the sea, heavy and bulky goods were most easily transported by barge and ship. Table 5 shows the numbers of bargemen, mariners or sailors born in Hockley.
Number of mariners born in Hockley.

Source: Census enumerators' books, Hockley, 1841–1901.
There was a peak in the number of mariners in the 1860s to 1880s which corresponds to the era of high farming and the export of grain, straw, hay and sheep to London.Footnote 64 The majority of mariners ‘resident elsewhere’ in Table 5 were on vessels in coastal ports in Essex and Kent and on the Thames, with London a major destination. In the 1881 census enumerators' books there were eight vessels in London with Hockley-born mariners aboard. There were also vessels in Seaham and Sunderland in County Durham perhaps transporting coal to Hockley from the North East. One of the barge owners in the 1841 census was Benjamin Cackett who is identified as a coal merchant in an 1855 trade directory. The reduction in the numbers of mariners towards the end of the century reflects the decline in coastal navigation, partly as a result of the spread of the railways. In 1914 there was a coal merchant located at Hockley railway station indicating that coal was delivered by rail. As already discussed, the railway had a significant impact on the village. As well as giving access to the London milk and horticultural markets, it facilitated migration and commuting and provided new employment opportunities. Thirteen people were employed by the Great Eastern Railway in 1901 including a station master, shunters, signalmen, platelayers, clerks and a porter. Hockley station had a goods siding which appears to have been busy since eight carmen are identified in the 1901 census, plus two carriers in a 1902 trade directory.
The landscape of Hockley also provided raw material for other livelihoods. Small scale brick and tile makers using the local clay had existed since the early modern period. The 1841 census enumerators' books mention a brickmaker, and in 1861 George Peach was described as ‘brickmaker employing 5 men’. In the 1890s an entrepreneurial brickfield was established adjacent to the river Crouch (see Figure 7); by 1901 it provided employment for a manager, foreman, three engine drivers and twenty-five labourers. The house building activity in Hockley around the turn of the century suggests that there was a market for the bricks, but most were sent to London. A catalogue dated 1903 states that the works were capable of producing 3,200,000 stocks, 400,000 facing reds and 500,000 wire-cuts annually and the cost of transporting to London was 1s. 7d. a ton by barge.Footnote 65
Brickworks adjacent to the river Crouch.
Note the brickworks on the left, the wharves and the sailing barge.
Source: ERO, I/Mb 184/1/1 (Reproduced with permission).

The changing occupations and employment patterns discussed above have largely concerned male workers. Women and children also had both paid and unpaid occupations. As Nicola Verdon has observed, there was an informal economy in which ‘women's earnings, although not central to the family's income, remained important’.Footnote 66 The issues around the recording of female occupations in the census enumerators' books have been addressed by Edward Higgs, and Pamela Sharpe has cautioned that census material is ‘a poor tool for use in analysing Victorian women's participation’.Footnote 67 For example, women may have worked for casual pay or part-time and therefore do not appear in the ‘occupation’ column of the census enumerators' books.Footnote 68 Also, as Verdon notes, the 1851 to 1871 censuses recognised that wives who assisted their husbands in family enterprises should be recorded but in 1881 they were ‘permanently removed’, and work in the home is unlikely to have been recorded.Footnote 69 Overall workforce participation rates for females aged twelve and over are shown in Table 6.
Female workforce participation rate, 1841–1901.

Source: Census enumerators' books, Hockley, 1841–1901.
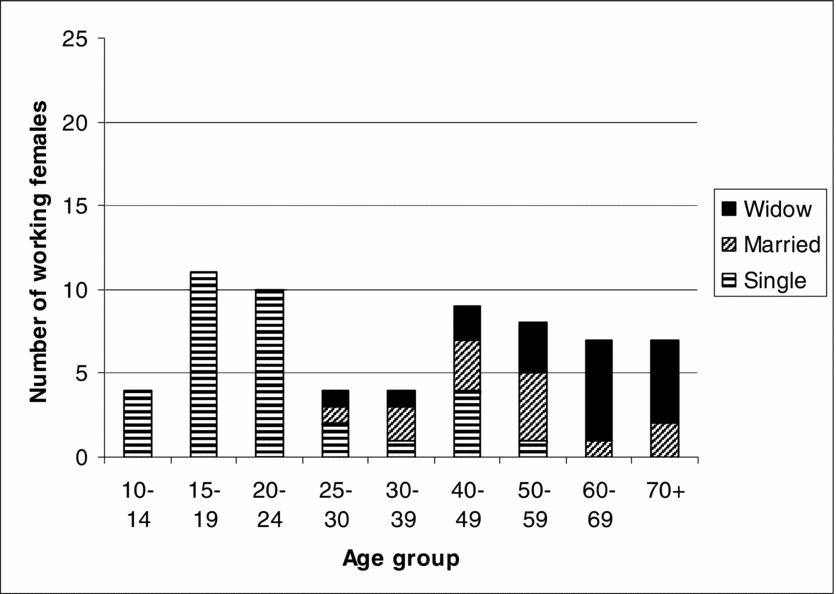
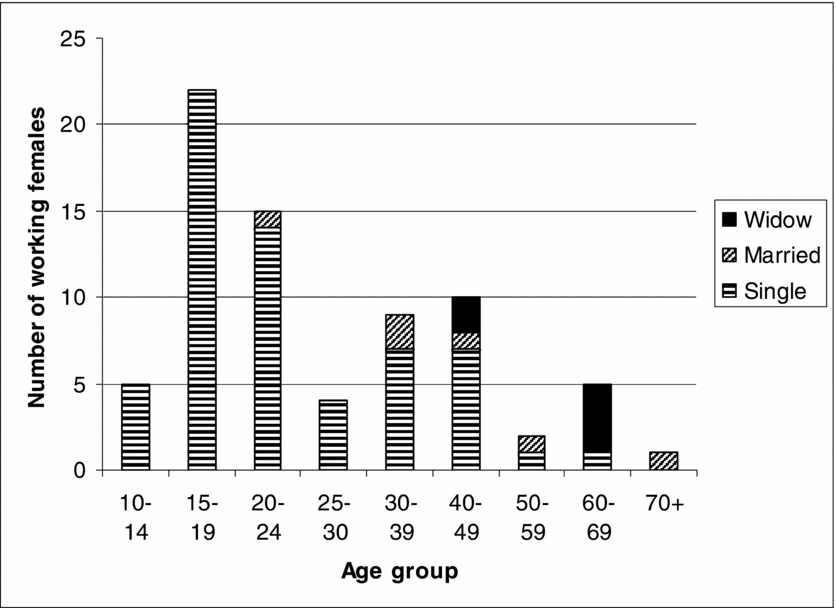
Shaw-Taylor notes that the lowest rates of female participation ‘were to be found in the south and east . . . where reported unadjusted participation rates fell below 30 per cent’.Footnote 70 Hockley had even lower participation rates, but was not untypical of rural Essex.Footnote 71 Where female occupations are given in the Hockley census enumerators' books, domestic service (housekeeper, parlour maid, cook, nurse) predominates. All but two of the thirty-five domestic servants in Hockley in 1851 were female. A. F. J. Brown observes that ‘over Essex as a whole, domestic service was the only major form of female employment’.Footnote 72 The census data for Hockley does not entirely support this observation. The 1841 census enumerators' books identify ten female agricultural labourers, although this is exceptional. In 1851 there were two females with agricultural occupations (one agricultural labourer and one gardener). Women were also likely to have undertaken informal seasonal work such as weeding, haymaking and harvesting.Footnote 73 Michael Anderson notes that nationally, tens of thousands of women who performed at least some agricultural tasks as general servants may have found their way into the domestic service category.Footnote 74 In addition to domestic service, occupations in Hockley include dressmaker, laundress, barmaid, teachers and a governess. Unlike some areas such as north-west Essex and other counties in the South and East there was not a cottage industry for females in Hockley such as lace-making or straw-plaiting.Footnote 75 Women's workforce participation was based on life stages. Verdon has argued that earnings ‘were conditional not only on the availability of employment, but also on the number and age of children living in the household’.Footnote 76 This life-cycle effect is demonstrated in Figures 8 and 9.
Marital status of working females, 1851.
Source: Census enumerators' books, Hockley, 1851.

Marital status of working females, 1901.
Source: Census enumerators' books, Hockley, 1901.

The number of females in the workforce increased as they became economically active. It then declined when women married and started families. Childcare may have been available but it was expensive.Footnote 77 After the age of forty or so there was an increase in workforce participation when women were no longer looking after young children. Osamu Saito, in a study of rural parishes in Dorset and Bedfordshire, suggests that widowhood was the occasion for a return to the labour market.Footnote 78 This also appears to be the case in Hockley: widows account for a large proportion of the working female population over the age of fifty. The life-cycle pattern in subsequent censuses is similar, but in 1901 a higher female workforce participation rate is apparent with a significant number of younger unmarried women with an identified occupation but fewer older women than in 1851 as shown in Figure 9.
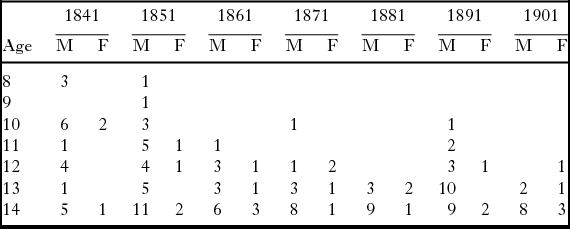
Children also contributed to the rural economy. Geoffrey Best says of the period 1851 to 1875 that parents were ‘habitually reluctant to keep a child at school after it became capable of wage-earning (at, say, ten years old on average)’.Footnote 79 The evidence from the Hockley census enumerators' books, see Table 7, suggests that some children were economically active from an even earlier age. Boys were mostly designated as ‘agricultural labourer’ and girls ‘female servant’ or ‘housemaid’. Even after school attendance became compulsory in the 1870s it is apparent that some children still had a declared occupation. The actual numbers engaged in work may be greater as children described as scholars in the census enumerators' books may also have undertaken casual work. This would have been particularly so at busy times of the agricultural year such as ploughing and harvest. One of the eleven-year-olds in 1891 was described as ploughboy although this was a seasonal occupation.
Number of children in Hockley with an occupation, 1841–1901.

Source: Census enumerators' books, Hockley, 1841–1901.
Key: M = male, F = female.
5. Population and migration
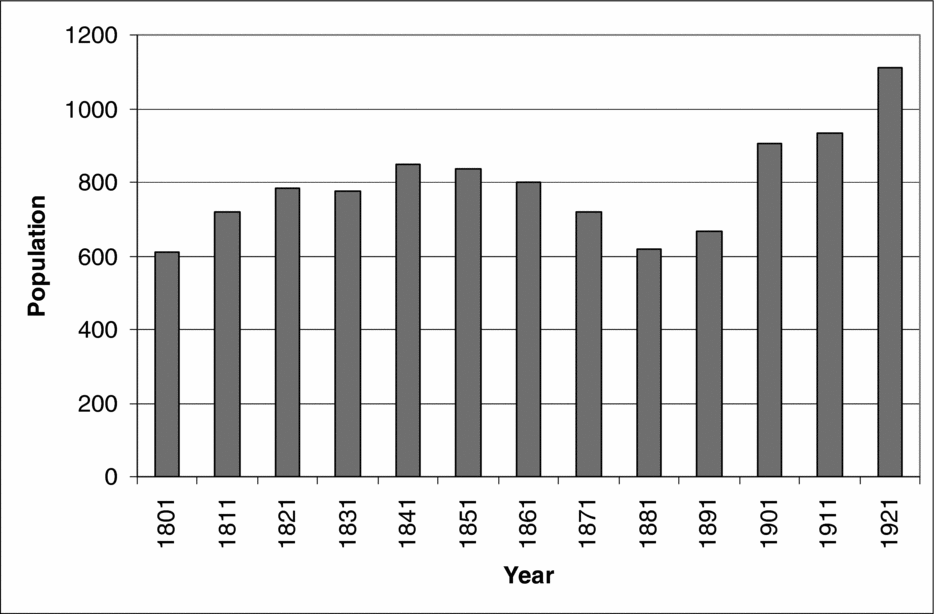
The overall population of Hockley is shown in Figure 10. The increasing population in the early nineteenth century reflects the wider patterns related to economic factors such as opportunities for employment and social factors such as lower mortality rates. During the period of high farming from the 1840s to the 1870s the population of Hockley fell. This pattern was widespread. The reasons are complex but are related to the increasing accessibility of London with its more varied employment opportunities and higher wages and the loss of craft occupations to urban factories.Footnote 80 The increasing population from 1891 is related to the arrival of the railway and the opportunity it provided for commuting to Southend-on-Sea and London.
Population of Hockley, 1801–1921.
Source: Census enumerators' books and Census Summaries, 1801–1921.

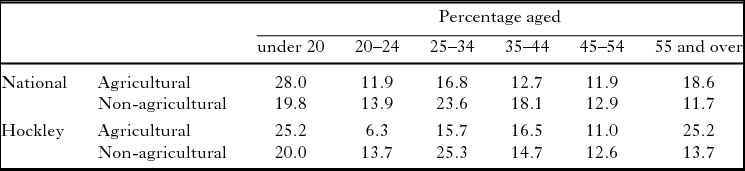
Alan Armstrong has argued that, during the depression, agriculture relied heavily on older men and youths since the experience and strength of those in the twenty-five to forty-four age group meant they were more likely to migrate to seek employment in non-agricultural occupations.Footnote 81 Armstrong's national data on the composition of the male labour force and the corresponding data from Hockley are shown in Table 8. The evidence from Hockley closely matches and supports Armstrong's findings. There was a higher proportion of under-twenties and over fifty-fives in agriculture than in other occupations, together with a markedly lower proportion of twenty to thirty-four year olds in agriculture. It is notable that in Hockley a quarter of the agricultural labour force was aged fifty-five or over.
Age-related composition of male labour force, 1891.

Source: Adapted from A. Armstrong, Farmworkers, Table 5.1; and census enumerators' books, Hockley, 1891.
It has been claimed that Essex farms were saved by an influx of Scottish dairy farmers who took on untenanted farms at low rents.Footnote 82 Hunt and Pam argue that the contribution of Scottish farmers to the recovery was never more than supplementary and that long distance migrants from the West Country, the north of England, and Wales outnumbered Scots farmers and began to arrive at the same time.Footnote 83 Of eighteen farmers in Hockley in 1851, only two had been born outside Essex, one each from the adjacent counties of Kent and Suffolk. By 1891 the birthplaces of farmers were more diverse: out of seventeen farmers, two had been born in Yorkshire, one in Somerset and one was a ‘British Subject’. By 1901, of twenty farmers listed in the census enumerators' books, half had been born outside Essex and indeed include a Scot, four born in Yorkshire, two from Lancashire, and one each from Staffordshire, London and Russia. This largely supports Hunt and Pam's contention that farmers, and some farmworkers, migrated to Essex from the West Country and the north of England but there was not a large influx of Scottish dairy farmers.
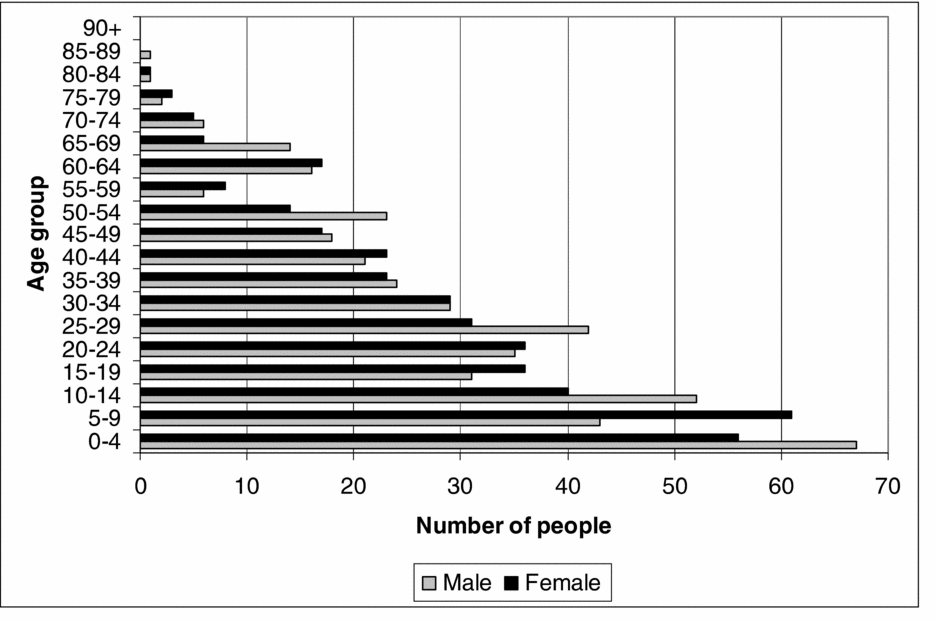
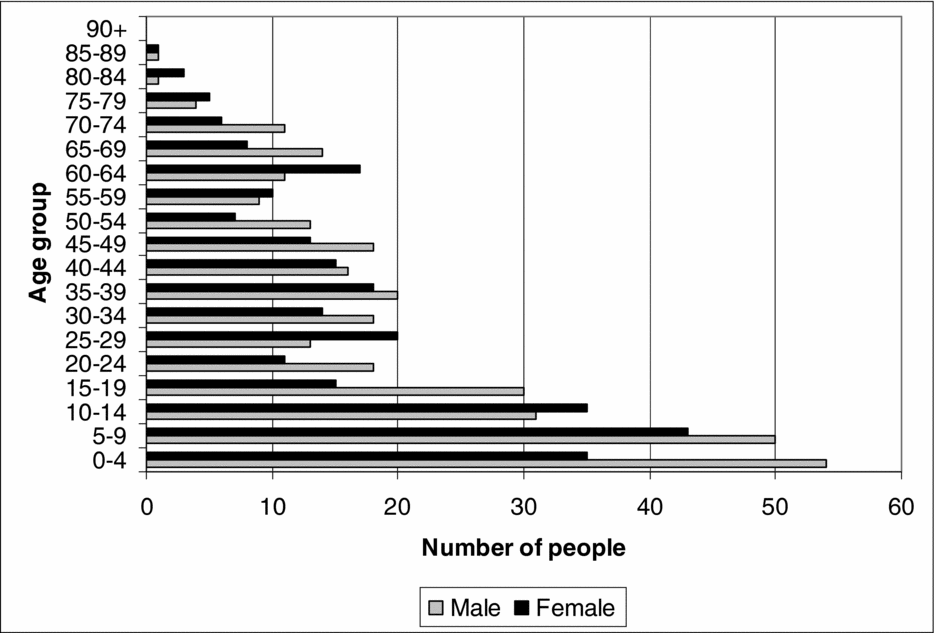
The census enumerators' books data also demonstrate patterns of migration to and from Hockley. In 1851 half of the resident population had been born in the parish, and half of the people who had been born there were living elsewhere. A pattern of increasing in- and out-migration continued throughout the century. By 1901, less than one third of the population had been born in the parish and three-quarters of those born there were living elsewhere. Migration was mainly to and from neighbouring parishes and market towns and there was significant out-migration of young females into domestic service. Among the out-migrants in 1881 there were ninety-seven male agricultural or farm labourers all living in parishes in rural Essex except for one in Kent. The out-migrants also undertook a wide range of rural and urban occupations. Hockley-born craftsmen such as thatchers, wheelwrights and carpenters were living in Essex towns and rural parishes. Others included five carmen in London, a bricklayer in Battersea, eight labourers in East London, a coal miner in Durham, two police constables in London and a private in the army. Female occupations include five lodging-house keepers and two coffee-house keepers in London and Brighton. There were seventy-five female domestic servants, housekeepers and housemaids born in Hockley who were resident in Southend-on-Sea and the neighbouring market towns of Rochford and Rayleigh and in London and its suburbs. This was considerably more than the number of domestic servants that could have been sustained in Hockley, which was just twenty-two in 1881. As Gwyneth Nair and David Poyner have observed in their study of migration in rural Shropshire that ‘intra-rural migration remained the norm; local market towns continued to be a frequent destination; the advent of the railways affected the distance traveled but not the pattern of migration’.Footnote 84 This pattern is also evident for Hockley with the additional pull of London. The effects of the increasing out-migration are shown in the age-structure profile of the population in 1841 and 1881 in Figures 11 and 12. The age-structure profile in 1841 shows that there were a broadly similar number of males and females in each age group and the shape of the profile has the characteristically gradual decrease in the number of people of increasing age. The profiles of 1851, 1861 and 1871 have a similar profile. The 1881 age-structure profile is markedly different.
Age-structure profile for Hockley, 1841.
Source: Census enumerators' books, Hockley, 1841.

Age-structure profile for Hockley, 1881.
Source: Census enumerators' books, Hockley, 1881.

The out-migration of working-age males and females is evident from Figure 12 in their ‘absence’ from the demography of the parish. Also notable is the imbalance of males and females particularly in the fifteen to nineteen age group (thirty males and fifteen females). This may partly be a result of the random variation in this cohort: in the five to nine age group in 1871 there were forty-eight males and thirty-six females, but the 2:1 ratio in 1881 is striking. Charles Rawding has demonstrated that differences in the sex ratio of rural villages relates to the demands of the labour market where there were limited employment opportunities for females, particularly during the agricultural depression so that they tended to out-migrate.Footnote 85 The data from Hockley also demonstrates this phenomenon.
Conclusions
This article has demonstrated the strength of record linkages to construct a microhistory of a rural community. This has allowed an exploration and close examination of the rural economy of the village. The landscape of the parish, its exploitation, farming practices, land ownership, livelihoods, demography and migration patterns have been placed under the analytical microscope, revealing aspects of the operation and impact of local and national economic and social processes during a key period in British rural history. The breadth of this analysis could be said to transcend the narrow geographical bounds of the study. The rural economy of Hockley reflects the pattern of many communities in Essex and south-east England during the study period. High farming was practised with a large acreage of cereals grown for sale. The majority of the male workforce earned their living from the landscape. There was a range of traditional rural trades and crafts but several of these declined over the second half of the nineteenth century. Despite uncertainties about the identification of female occupations, the recorded female workforce participation rates in Hockley were significantly lower than many areas of south-east England. There was no rural industry in the village such as straw-plaiting. Women's occupations were principally in domestic service and agriculture and female age-related workforce participation reflects the pattern in other areas.
The microhistory of Hockley demonstrates how, and in what ways, wider economic and social forces had an impact at a local level. The transformation from high farming to less labour-intensive livestock and dairy farming is apparent. In addition to changes in agriculture, the depression of around 1875 to 1896 had an impact on agricultural occupations, migration and the demography of the parish. There was a significant out-migration of working-age men and women. In particular the skewed demographic profile of the village in 1881 suggests a substantial out-migration of working-age women. Out-migrants left to undertake a wide range of occupations in neighbouring villages, market towns, in London and further afield; a phenomenon identified in many rural parishes. By the turn of the century only one-third of the male workforce in Hockley earned their livelihood from agriculture.
A strength of microhistory is the location specific issues that it reveals about a community. The landscape of Hockley was widely exploited: in addition to agriculture, the extensive area of woodland, the clay soil and the location of the parish on the tidal river Crouch facilitated economic activities such carpentry, boat building, coastal trade and shipping, fishing and brick-making. Some of these declined alongside traditional village crafts, however new occupations, such as large-scale entrepreneurial brick making, provided employment. The range of occupations in the village increased as communications, transport and technology developed towards the end of the nineteenth century. Like several other Essex parishes, the arrival of the Great Eastern Railway facilitated the development of dairying; the growth of market gardening and increased in- and out-migration. The railway also provided direct employment and supported associated livelihoods such as carmen and carriers. The increasing population led to employment for bricklayers, carpenters and builders for new housing. The building boom demonstrates the utility of record linkages to identify the causes, progress and effects of change.
This microhistory identifies details that qualify, or are counter to, national, regional and county-wide patterns. The agricultural data demonstrate how local farmers did not completely abandon cereals but attempted to take advantage of differential prices between wheat, barley and oats in the management of their farms. They also sought other sources of income such as pig rearing which has not been identified as a significant economic activity in Essex in this period. There is no evidence in Hockley of rural out-migration caused by increasing mechanisation of farms. Nor was there evidence of an influx of Scottish dairy farmers to the parish to take over untenanted farms, although there was some in-migration of farmers from other areas. The structure of land ownership in mid century indicates that family farming and small-scale agrarian capitalism were being widely practised in Hockley contrary to the pattern of large-scale agrarian farming predominant in south-east England. The microhistory of Hockley has therefore revealed location-specific details of the exploitation of the landscape, the management of farms, changing occupational structure and the operation of the rural economy that are not revealed in more broadly based studies.