I. INTRODUCTION
In material science, indentation testing has a long history and represents an essential method for characterization of various material properties. Among these, determination of elastic properties like Young’s modulus and plastic properties like hardness have been the major and most successful applications of this technique. There are plenty of reasons for the widespread and growing use of indentation techniques: miniaturization in various scientific and technological fields necessitates the quantification of mechanical properties on a scale that has not been as extensively characterized as the macroscopic scale. Furthermore, various sources of size-dependent behavior exist that need to be tested and quantified, yet tensile tests below the millimeter scale pose severe challenges. Indentation techniques in general can be applied to assess local mechanical properties in varying microstructures, e.g., in a welded zone. The preparation and conduction of tensile tests on all scales is a time and cost-extensive procedure, whereas conventional hardness testing is readily applicable and quasi-non-destructive. However, (nano-)indentation requires a careful and at times tedious specimen preparation as well.
As an alternative to conventional materials testing procedures or as a necessity, posed by difficulties in measuring local properties, material characterization by indentation techniques has become a standard method in material science. Nevertheless, the conventional use of indentation techniques is limited to the determination of hardness or microhardness values as strength parameters and does not include the widely used engineering quantities, yield strength and strain hardening rate. In this context, inverse methods and optimization techniques together with realistic finite element (FE) models came into the focus of interest to derive the plastic properties of materials.
Previous work on obtaining mechanical properties other than hardness from indentation tests is presented here very briefly. Numerous approaches have been carried out to obtain material properties by using the load–indentation curve obtained from instrumented indentation. It is well known that the isotropic elastic properties can be identified with sufficient accuracy and reliability using the method introduced by Oliver and Pharr.Reference Oliver and Pharr1 Yet, plastic properties are more difficult to obtain. Approaches to determine plastic properties are, e.g., presented in Refs. Reference Suresh2–Reference Dao, Chollacoop, Vliet, Venkatesh and Suresh5. In this context, it has been shown by many authors that using a single load–displacement curve is not sufficient to identify plastic material parameters uniquely.Reference Cao and Lu6–Reference Alkorta, Martinez-Esnaola and Sevillano9 Capeheart and ChengReference Capehart and Cheng10 have shown that such a procedure gives ambiguous results, and noise levels of only 1% make the identification of strain hardening behavior impossible. As a conclusion, many authors modified or extended the experimental setup to yield more satisfactory results and to circumvent nonuniqueness and sensitivity issues. Modifications include the use of multiple indenter geometries,Reference Cao and Lu6, Reference Chollacoop, Dao and Suresh11–Reference Chen, Ogasawara, Zhao and Chiba13 multiple indentations,Reference Valeriy, Frederick and Hamed14, Reference Marco, Leonardo and Vigilio15 or stepwise indentation.Reference Field and Swain16 Among these, many approaches have been described to yield good approximations to the true material behavior when validating the models with numerical indentation simulations. However, when dealing with experimental load–indentation curves subject to noise or other uncertainties, many approaches yield unsatisfactory results.Reference Capehart and Cheng10
Within the context of sensitivity to an uncertainty of measured quantities, Lan and VenkateshReference Lan and Venkatesh17 compared four approaches that use two different indenter geometries for their robustness. Most of the presented approaches do not suffer from nonunique solutions in comparison to single indenter approaches, yet all methods can exhibit errors above 50% for certain material parameter combinations if uncertainties of 5% for the input parameters of their reverse algorithms are assumed. This work shows that these procedures—even when multiple indenter geometries are used—generally remain highly sensitive to typical measurement errors.
Some authorsReference Matsuda18–Reference Bolzon, Maier and Panico20 discovered that the residual imprint formed by an indenter was a helpful source of information to determine plastic material properties. Most commonly, the authors formulate an error term, which was a weighted sum of discrepancies of residual imprint geometry and load–displacement curve comparing simulation and experiment. Using optimization techniques, this error term is minimized successfully and a good approximation of material parameters can be obtained, however, mostly for numerical indentation experiments that are not subject to noise or other measurement errors.
In the present work, it is shown that exclusively using the imprint geometry together with knowledge on the boundary conditions of the indentation experiment lead to good results in determining yield strength and strain hardening exponent from experimental data with an inverse method. As it is common for indentation-based material property determination, the presented approach is based on the assumption of a homogeneous and isotropic solid, free of residual stresses in the vicinity of the indent. Isotropy necessitates that the size of the indenter is large compared to microstructural components like grains, single phase regions, etc. The paper is organized as follows: first, the method of deriving material properties together with brief descriptions of the FE model and optimization strategy is presented. Experimental techniques and setup as well as experimental results for imprint geometries and imprint characteristics are presented subsequently. The described method will be shown to yield a unique and robust solution over a large material parameter domain. Finally, results of the presented approach will be compared to experimental stress–strain behavior obtained by independent uniaxial tension tests of the same material.
II. METHOD
A. Material model
To obtain estimates of the material hardening behavior, the first step is to find a suitably parameterized hardening model. Among a large variety of phenomenological hardening laws, a simple description for materials hardening behavior in the form of power–law hardening is chosen:
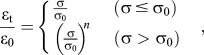
where  is the total strain, i.e., the sum of elastic strain
 and plastic strain
 ,
 is the yield strength, and n is the work hardening exponent. The strain at yield is denoted by
 , with the Young’s modulus E. Resolving Eq. (1a) with respect to the stress yields

which for  is similar to the well-known Hollomon equation. In Eq. (1a), only two parameters are used, the yield strength
 and the strain hardening exponent n, which are summarized in the work hardening coefficient
 in Eq. (1b). Additional elastic strains after yielding are neglected, such that the approximation in Eq. (1b) is only valid for small work hardening rates. Regardless of its simplicity, power–law hardening is capable of approximating the work hardening behavior of metals reasonably well and hence will be used exclusively in the following.
B. FE model
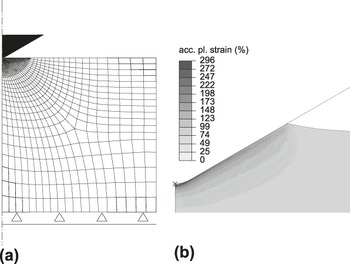
The FE model consists of a rigid indenter and a deformable substrate. Exploiting symmetry of the Rockwell indentation process (HRC norm), an axisymmetric FE model is chosen in all simulations that follow. The model is implemented in the commercial software Abaqus and consists of 1231 linear quadrilateral elements of type CAX4R using reduced integration [Fig. 1(a)].
FE model used for Rockwell indentation simulation (a) axisymmetric FE mesh with finely discretized contact zone; displacements in vertical direction at the lower boundary of the model (b) distribution of accumulated plastic strain after unloading; note particularly the large values directly underneath the indenter tip (exemplary results using material properties of iron).

In the FE model, a von Mises elastoplastic material model is used along with isotropic hardening, neglecting the kinematic hardening that materials might exhibit under load reversals. Rate-independent material behavior is considered for the quasistatic calculations presented here. The influence of large deformation is included in the analysis by considering geometrical nonlinearity. Each simulation consists of two load steps represented by force-controlled loading and unloading of the indenter tip; no holding stage is applied since no viscosity in the constitutive material model is considered.
In Fig. 1(b), accumulated plastic strains resulting from a FE simulation for σ0 = 157 MPa and n = 12 (these are approximate values for iron, see Sec. IV. C) are shown to demonstrate the large values of plastic strain occurring during indentation. Below the indenter, a large area with accumulated plastic strain of 100–150% is seen, whereas directly below the indenter tip, a maximum value of 300% is reached. The exact values, of course, strongly depend on the underlying material parameters. It is consequently found that elastic constants have a negligible effect on the formation and final shape of the residual imprint due to the domination of plastic strain, and therefore, values for Young’s modulus and Poisson’s ratio are fixed to 210 GPa and 0.3, respectively, in all simulations unless stated otherwise.
Friction is considered to be of the Coulomb type and a typical value of 0.1 is chosen for all simulations. Friction is a complicated process and this quantity cannot be determined easily; moreover, friction also depends on the load applied.Reference Polzer and Meißner21 Yet, the handbook value of 0.1 for friction of diamond against steel was confirmed for typical loading conditions of hardness testsReference Yurkov, Skvortsov, Buyanovsky and Matvievsky22 and values above the used on do not change the imprint geometry considerably.Reference Bolzon, Bocciarelli and Chiarullo23
C. Optimization procedure
The inverse analysis in our case is expressed as the minimization of a discrepancy norm quantifying the deviation between experimental and simulated quantities with respect to the unknown values of yield strength and strain hardening coefficient. The discrepancy norm to be minimized is defined as

where  (i =1, …, N) are the displacements describing the height profile of the simulated indent from the center of the indent over the entire pileup area; the number of sampling points is denoted by N ≈ 200. The corresponding experimental values are denoted by
 and x is the vector of simulation parameters. To minimize Eq. (2), few well-known derivative-free optimization algorithms, such as the Nelder–Mead simplexReference Nelder and Mead24 and quasi-Newton method with Broyden?Fletcher?Goldfarb?Shanno (BFGS) update from SciPy optimization package,Reference Jones, Oliphant and Peterson25 as well as the trust region reflective algorithm from the Matlab toolbox,26 were tested. Yet, for all optimization algorithms stated here, the dependence on starting values, a large number of function calls, and a limited capability of parallelization (for the SciPy optimization package) were inconvenient. An in-house derivative-free parallelized optimization algorithmReference Begau27 based on a work about efficient global optimization of expensive black box function using the Kriging metamodeling approachReference Jones, Schonlau and Welch28 was consequently chosen. The optimization algorithm and strategy is especially designed for optimization of FE problems, requires a small number of usually expensive function calls, i.e., FE simulations, and returns good estimates very close to the global minimum in all our test cases showing fast convergence behavior. Instead of using starting values that can run into local minima, the algorithm samples the entire domain of possible material parameters and successively finds better estimates based on various criteria. Bounds for all optimizations runs have been applied for the yield strength 50 ≤ σ0 ≤ 1000 MPa and for the strain hardening exponent 2 ≤ n ≤ 10. For the sake of brevity, the reader is referred to Ref. Reference Jones, Schonlau and Welch28 for details of the optimization algorithm.
III. EXPERIMENTS
In this section, the materials that were investigated along with a description of the experimental setup of the indentation experiment and the surface profilometry used to characterize imprint geometries are presented. Consequently, experimental results of material-specific average profiles including observed scatter are presented.
A. Material selection and experimental setup
Different metallic samples have been selected to cover a wide range of materials including fine- and coarse-grained metals, different crystal structures, as well as pure and alloyed metals. Details about structure and processing of each material are presented in Table I. The austenitic steel 1.4301, resp. AISI 304 or X5CrNi18-10 (name chosen in the following), a noncommercial low-carbon multiphase steel, as well as the pure elements iron (ARMCO iron), and copper were chosen. Chemical compositions of the alloyed materials are given in Tables II and III. Some FE simulations were carried out to investigate differences of imprint profiles due to a small thickness of a specimen. Sheet and bulk materials with the geometries given in Table I were analyzed but showed no difference in the material parameter range that has been investigated.
Details on investigated materials used for experimental verification (abbreviations of the crystalline structure: bcc, body-centered cubic; bct, body-centered tetragonal; fcc, face-centered cubic).

Chemical composition of austenitic stainless steel X5CrNi18-10 (1.4301, AISI 304).

Chemical composition of multiphase steel.

Samples were grinded and polished using up to 1 μm monocrystalline diamond polishing suspension. Some samples were additionally electrochemically polished to study effects of possible residual stresses due to the mechanical polishing and to analyze effects of the surface roughness on resulting imprint profiles. Yet, no differences in the obtained impressions could be observed so that mechanical polishing was considered to be sufficient for the rather deep indentations that have been applied here.
For all investigated materials, a total number of three indents per alloy were made using a conventional noninstrumented Rockwell hardness testing machine. This apparatus applied a total load of 1471.5 N on a spheroconical Rockwell tip indenter (HRC norm, radius of 200 μm and a 120° opening angle; no preload is applied here). A holding time of 10 s after each indent was used before unloading that is, however, not considered in the corresponding FE simulation where nonviscous material behavior is assumed.
B. Residual imprints of selected alloys obtained by surface profilometry
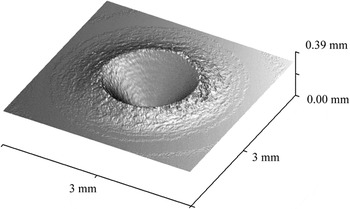
Topology measurement was carried out using a chromatic white light sensor with a height resolution of 10 nm. A lateral resolution of 10 μm was sufficient and chosen for all experiments. Figure 2 shows exemplarily an impression into copper.
Residual imprint in copper using Rockwell indentation after HRC norm. The topographical image is obtained by a chromatic white light sensor.

Each topology was postprocessed using the following steps:
(i) A filtering technique was used to remove nonidentified points for selected images;
(ii) The center of the imprint was identified;
(iii) Profiles in radial direction were computed at angular increments of 1–2°, interpolating linearly in between data points of the image data;
(iv) The mean of radial height profiles was computed; and
(v) The mean profile is leveled to reach zero for infinite distance to the center.
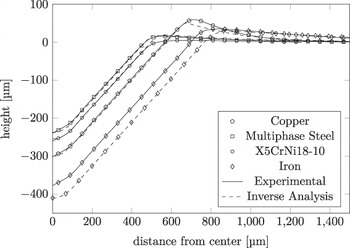
Figure 3 shows the experimentally measured surface height against the distance from the center of radially symmetric impressions. The profiles show surprisingly little scatter of only a few percent or even less in some cases. It is seen that scatter increases for softer materials and for larger grain sizes. The softest material, i.e., iron, has an observed relative scatter of 3.1% for the depth, 13.7% for the width, and 6.1% for the maximum (Table IV). We assume the large grain size of this material compared to the others to be the reason for this large scatter, because for the grain size of approximately 160 μm, an average of only five grains are indented in radial direction from center to the pileup of the imprint. Yet, the influence of grain size on imprint quality has to be confirmed by an independent analysis.
Surface height versus distance from center obtained through topology measurement are compared to corresponding quantities obtained by the inverse analysis for denoted materials.

Observed scatter of characteristic points of the identified height profiles over all specimens. The minimum, maximum, and the width at half of the maximum are displayed.

C. Tensile tests
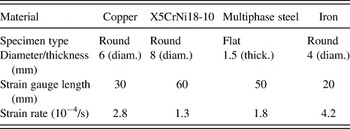
Tensile tests were carried out on different machines using different specimen geometries due to geometries of the material. The strain rate was chosen to be sufficiently low to exclude any strain rate effects. Details can be found in Table V.
Details about tensile tests carried out on investigated materials.

IV. RESULTS
In this section, it is shown that the exclusive use of imprint data along with the knowledge of all boundary conditions of the indentation process poses a well-defined inverse problem in terms of identification of plastic material properties. Experimental verification of the proposed inverse analysis is provided by independent uniaxial tests for all tested materials. Consequently, it is shown that the proposed method robustly yields unique material parameters in terms of yield strength and power–law hardening exponent.
A. Material parameters obtained by numerical method
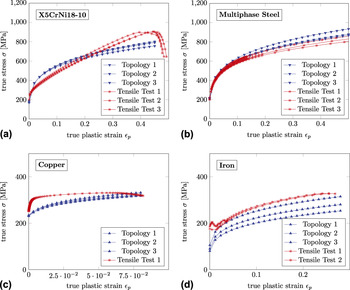
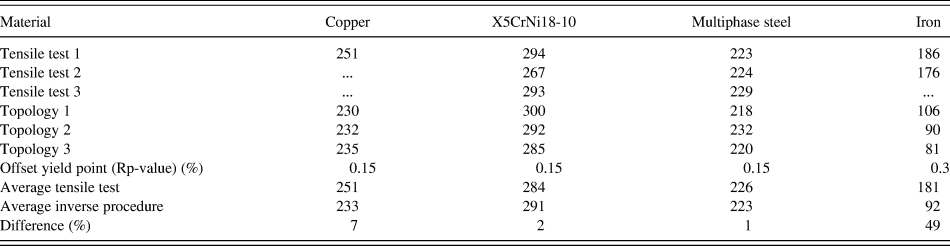
The average profiles presented earlier in Sec. III. B have been used to identify yield strength and strain hardening behavior of the investigated materials introduced earlier with the help of the inverse analysis explained in Sec. II. C. Stress–strain curves are plotted resulting from the yield strength and power–law hardening exponent obtained from the inverse analysis of the imprint profiles together with independent experimental data from tensile tests in Fig. 4. It is seen that some materials exhibit strong deviations from power–law hardening, in particular copper; however, the results obtained with the indentation method approximate the true material behavior to a good degree. Hence, it was not attempted to derive a work hardening exponent from the experimental data; instead, the work hardening behavior found in experiment is compared to the effective power–law hardening obtained by the inverse analysis in a qualitative way in Fig. 4. A comparison of the experimental results and the inverse analysis in Fig. 4 and Table VI shows that in particular, the yield strength is reproduced with good precision, except for the case of iron that shows a pronounced yield point phenomenon. Nevertheless, a good description of the flow behavior after the Luders strain regime is yielded by the indentation method. Table VI summarizes the values of initial yield strength identified by the indentation method to values derived from uniaxial tension tests. As usual for interpreting data of tensile tests, an offset yield point is chosen for the identification of a yield stress at a plastic strain value of 0.15–0.3%. The same offset is again chosen for the results of the indentation method. By applying a common offset, typical errors amount to only a few percent except for the case of iron, as discussed above. From these results, it is concluded that our method provides reliable results for the initial yield strength of different materials, in the absence of yield point phenomena and Luders strain. The power–law hardening, however, is only a rough estimate for the true strain hardening behavior.
Stress–strain behavior by inverse analysis and by corresponding uniaxial straining experiments as a reference: (a) X5CrNi18-10, (b) multiphase steel (noncommercial grade), (c) copper, and (d) iron.

Comparison of yield strengths derived by inverse analysis and by uniaxial straining experiments. A common offset yield point is chosen for all results (tensile tests and inverse analysis).
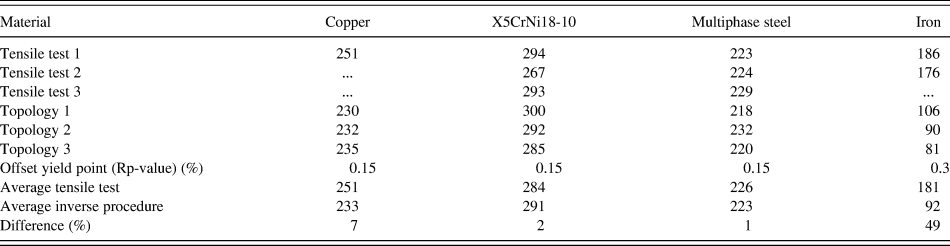
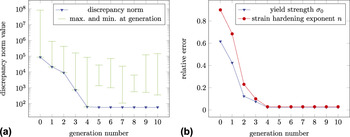
Figure 5(a) shows the general convergence behavior of an optimization run following the procedure after Jones et al.Reference Jones, Schonlau and Welch28 The discrepancy norm in all cases was always sufficiently minimized before the 10th generation (≤60 function calls), where each generation consists of four individuals. The absolute relative error of the material parameters over the course of the optimization is presented in Fig. 5(b).
(a) Convergence of discrepancy norm along with the maximum and minimum at each generation is displayed; (b) corresponding relative error of σ0 and n is shown (optimization after).Reference Jones, Schonlau and Welch28

B. Proof of uniqueness
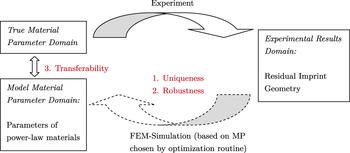
Uniqueness of the solution is a fundamental prerequisite for any inverse procedure. Figure 6 summarizes the forward and reverse analysis for numerical simulation and experiment, where the forward analysis is the relation of an indentation experiment to its results. In the backward problem, material properties are derived using experimental results and quantities, e.g., by the load–displacement curve or imprint geometry. Figure 6 illustrates the three major challenges (Points 1–3) to derive material parameters from indentation experiments:
(i) Uniqueness of the inverse procedure for a wide range of material properties through a suitable experimental quantity.
FIG. 6.Major challenges (Points 1–3) of plastic material properties determination via indentation technique. The mapping of material parameters to residual imprint geometries and vice versa in case of true experiments is displayed.

(ii) Robustness of the inverse analysis based on these experimental results, i.e., a small influence of typical measurement errors on the results of the inverse analysis.
(iii) Transferability of the material model to represent the experimentally observed plastic behavior.

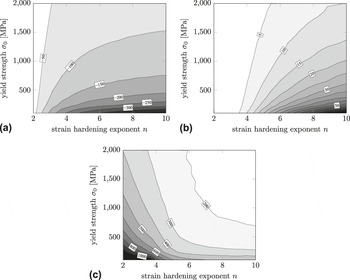
A truly mathematical proof of uniqueness of residual imprint geometry to material parameter space [parameters formulated by Eq. (1)] cannot be given due to the unknown relation by which the FE simulation maps point from the material parameter space to the residual imprint domain. Here, uniqueness of our solution is motivated by a showing that there is a unique mapping of material properties to some parameters extracted from the imprint profile. The information of the residual imprint is condensed by extracting characteristic information from every profile: minimum imprint depth, maximum pileup height, and width of the profile at 40% of its maximum height (referred to as “40%-width” in the following). The 40%-width showed lower standard deviations than other widths in the range of 30–60%. These quantities represent the main characteristics of the imprint profile.
A series of FE simulations were conducted to construct maps of those three characteristic quantities as functions of the two material parameters considered in this work, i.e., yield strength and work hardening exponent. In Fig. 7, the minimum depth, maximum height, and 40%-width are plotted over a wide range of these material parameters. It is seen that a given value for any single characteristic quantity can always be obtained by a set of material parameters; these sets are represented by contour (or iso-) lines along which the value of the given geometry characteristic is constant. Fixing the value of a second characteristic quantity yields a second contour line in the same material parameter space. For the given shapes of the contour lines it becomes obvious that there can only be only one unique intersection point of all three contour lines representing the characteristic quantities within the domain of material parameters. Hence, any combination of two different characteristic quantities of the imprint profile yields a unique combination of the two material parameters yield strength and work hardening exponent. Taking into account, a third characteristic quantity improves the precision and robustness of the method for practical applications, where measurement errors in the characteristic quantities are unavoidable.
Characteristic quantities describing residual imprints as a function of material parameters for FE simulations. The yield strength is varied from 100 to 2000 MPa and the work hardening exponent from 2 to 10: (a) minimum imprint depth, (b) maximum pileup height, and (c) width of pileup profile at 40% of maximum height.

C. Sensitivity analysis
Measurement of mechanical properties by indentation is subject to certain inaccuracies in the experimental setup as well as unavoidable measurement errors. Within all errors, we most commonly found that the residual imprint is not axisymmetric due to the fact that indentation axis and specimen surface normal were not well aligned. Yet, we assume the error due to this to be small because any tilt will be averaged out during the radial averaging of the imprint profiles (refer to Sec. III. B). Further possible sources of errors, however, not observed in our experiments, include poor indenter geometry, either resulting from manufacturing process or due to wear and the existence of residual stresses within the indented region. Measurement errors are assumed to result in deviations for the residual imprint as this is the only experimental indicator used in our approach and focus our sensitivity analysis on the influence of perturbations of the imprint geometry. With the help of certain perturbation scenarios, the level of sensitivity of our method is quantified.
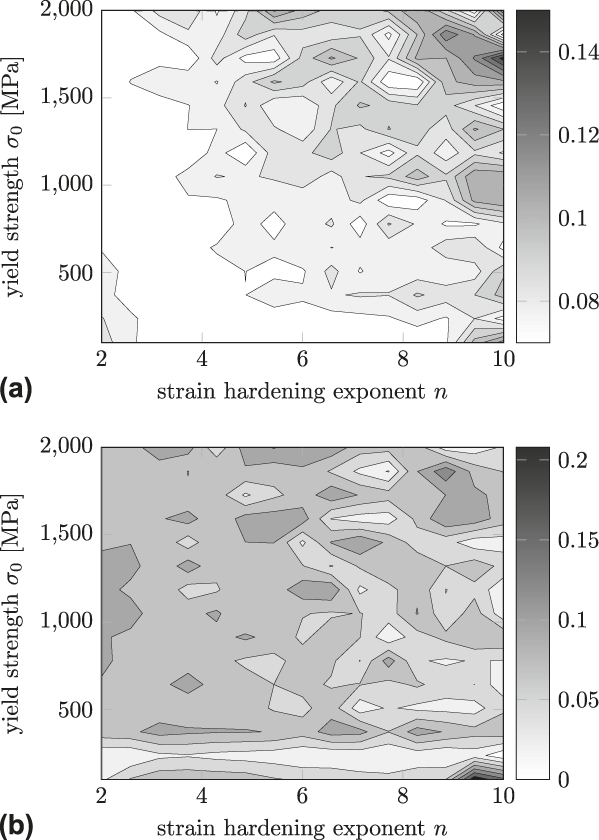
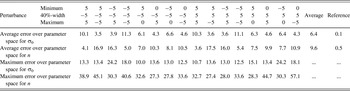
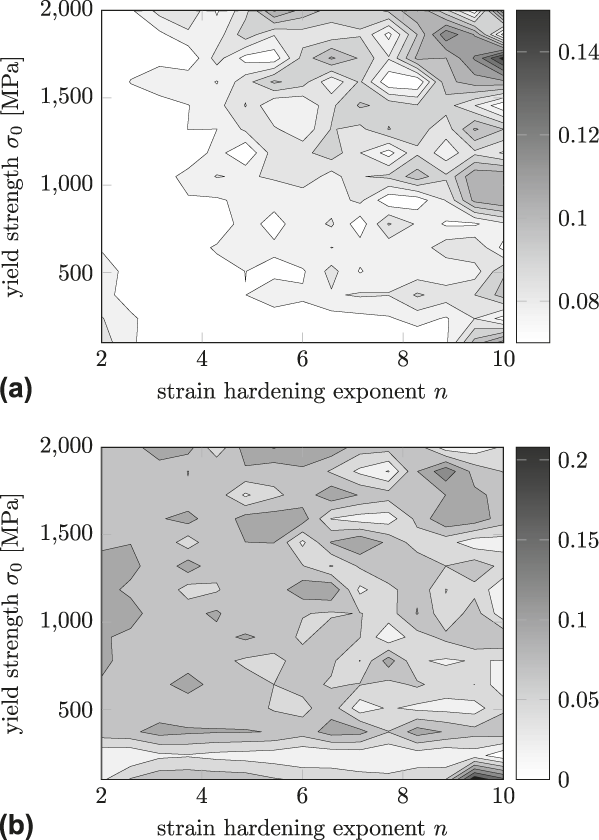
To apply perturbations to the residual imprint in a systematic way, the optimization approach is slightly modified in the following way. A reference imprint profile is computed at all points within the domain of material parameters (σ0 = 100, …, 2000 MPa, n = 2, …, 10), where the domain of each perturbation scenario has been discretized by 15 × 15 optimization runs. This information is then reduced to the characteristic points (minimum, maximum, and 40%-width) similarly to Sec. IV. A. Instead of computing material parameters by minimizing the difference of the measured and simulated full profile, in this section, values are given that have been found through an inverse analysis using the computed maps shown in Fig. 7. Perturbation is introduced at this point so that these reference characteristic points are modified in the perturbation scenarios. Taking the reference characteristic points without perturbations, it is found that this method is able to reproduce σ0 and n with an average error of less than 0.1% and 0.5%, respectively, over the entire domain of material parameters. A total number of 24 perturbation scenarios are investigated. Figure 8 shows exemplarily an error map over the domain for a +5% perturbation of depth and a +5% perturbation of the 40%-width over the domain of material parameters. It is seen that not all material parameter combinations are influenced in the same way. Hence, selected results presented in Table VII are given in form of maximum and average errors over the entire domain.
Results of inverse analyses carried out over the material parameter domain (σ0 = 100–2000 MPa, n = 2–10) including perturbations in the input parameters. A total number of 15 × 15 = 225 inverse analyses were used to quantify the relative errors for (a) yield strength and (b) strain hardening exponent. The case considered here reflects a perturbation of +5% of the minimum of the indent and +5% of the width at 40% height with respect to the reference values.
Average and maximum errors of the indentation method due to perturbations in the measure imprint profiles are quantified. The resulting errors of 16 scenarios are averaged over the material parameter domain (σ0 = 100–2000 MPa, n = 2–10). The reference case is calculated without perturbation. All values are percentage values.

With an assumed average perturbation of 5%, this study quantifies an average error of the presented approach over the range of practically all technical materials to be 6.4% for yield strength and 9.6% for the strain hardening exponent. Such that the method can be called robust with respect to measurement errors of the imprint profile.
V. DISCUSSION
Determining material properties from indentation experiments has certain limitations, which have to be kept in mind for interpretation of results from these methods. Even the most elaborate methods exhibit typical deviations to the true material parameters due to the following limitations:
(i) The necessity to use a simplified model for the description of the true plastic flow behavior of a material, as in our case, the power low hardening, due to the fact that only a low number of parameters guarantee uniqueness and robustness in material property determination. Furthermore, with this method, only isotropic hardening can be quantified.
(ii) Microstructural length scales must be much smaller than the volume tested with the indentation. It was found that for the iron samples investigated here, where the grain size was on the same order as the indentation depth, the results show a strong scatter.
(iii) Friction between indenter and material has a considerable effect on the pileup of the imprint. This quantity is difficult to assess exactly, might differ from material to material, and is to some extent dependent on the contact pressure applied.
(iv) Residual stresses can have a large influence on the imprint geometry. An earlier study quantifies large deviations in the residual imprints for bodies subject to high internal stresses.Reference Lee, Takashima, Higo and Kwon29 Yet, our study excludes the consideration of influences from residual stresses, mainly because residual stresses naturally can appear in many different multiaxial stress states, which usually also fluctuate locally. A further more extensive study will be needed to quantify possible scenarios of residual stresses and their influence on averaged characteristic profiles. Furthermore, it is noted that a direct experimental verification of models taking internal stresses into account will be an extremely difficult task to achieve due to the high effort necessary to quantify residual stresses experimentally.
The comparison of the results of the indentation method to the stress–strain behavior determined by tensile testing yields a good agreement for values of yield strength and the overall hardening behavior in three cases. Nevertheless, in the case of pure iron, where a yield point phenomenon occurred in the tensile test, the yield stress could not be predicted by this method. A fair agreement, however, was found for the flow behavior after the Luders strain regime. Obviously, as long as a power–law hardening is a valid assumption, the proposed method gives a very good fit of the true material yielding behavior, shown, e.g., in the case of the two steel grades.
The overall uncertainty of the experimentally determined imprint topology was below 4% if iron is not taken into account due to its large grain size. A large-scale sensitivity analysis was carried out to determine typical influences of scatter and measurement errors on the final results of the plastic properties. Even with an uncertainty of 5% of the imprint profile, deviations to the true material behavior were of the same order of magnitude as the uncertainty. Nevertheless, a more detailed statistical analysis is necessary to guarantee the robustness of the method in practice to a higher degree.
VI. CONCLUSIONS
A novel method to determine plastic material properties is presented, in this case, yield strength and work hardening rate, from residual imprints resulting from an indentation with known indenter geometry and maximum force. The method relies on a quantitative comparison between residual imprints resulting from FE simulations and indentation experiments, whereas no depth sensing information such as a load–displacement curve was used in this work. An automated optimization routine varies the material parameters underlying the FE simulation until a satisfactory agreement between simulation and experimental imprint geometries is achieved. The parameters of the simulation with the optimal agreement represent a good approximation of true material parameters, as it is verified by independent uniaxial tensile tests of the same material. The detailed results of this work are summarized in the following:
(i) A unique solution for the material parameters is found over the material parameter domain for yield strengths ranging from 100 to 2000 MPa and for power–law hardening exponents from 2 to 10. In the absence of noise or other errors in the imprint geometry, a very low theoretical error smaller than 1% is found for the identification of plastic material parameters. The imprint can therefore be regarded as a unique fingerprint of a material.
(ii) Introducing perturbations into the results for imprint geometries shows that the sensitivity of our method with respect to measurement errors is satisfactory, i.e., in general, the error of the resulting material properties is less than twice the uncertainty in the characterization of the imprint geometry.
(iii) After the optimization procedure, the material parameters of the simulation pose a good representation of the true material properties, which has been confirmed by independent uniaxial straining experiments with the same material as used for the indentations. Further verification with other materials is currently in progress to validate the method for a wide range of metals.
Therefore, we regard the approach presented here as a suitable and robust method to determine plastic material parameters from indentation experiments.
ACKNOWLEDGMENTS
The authors gratefully acknowledge support concerning the optimization strategy from Christoph Begau, as well as help with specimen preparation and laboratory work from Rehman Hameed, both from our institute. We further express thanks to ThyssenKrupp AG, Bayer Material Science AG, Salzgitter Mannesmann Forschung GmbH, Robert Bosch GmbH, Benteler Stahl/Rohr GmbH, Bayer Technology Services GmbH, and the state of North-Rhine Westphalia as well as the European Commission in the framework of the European Regional Development Fund (ERDF) for financial support and particularly thanks to the ThyssenKrupp AG for providing the multiphase steel material.