In recent years, there has been a social trend for singing red songs (hong ge 红歌) among the Chinese, with communist revolution, anti-imperial struggles and the building of a prosperous and promising socialist country as the predominant themes. After nearly 40 years of reform and opening-up, this renewed enthusiasm for red songs, especially traditional revolutionary songs, reflects a typical and prevalent nostalgia for the revolutionary era in contemporary China.Footnote 1 It is a construction of the collective memory of the revolutionary past, somewhat similar to how singing Soviet anthems shows nostalgia for the old era among the Russians.Footnote 2
While the social phenomenon of revolutionary nostalgia in the era of globalization merits close inspection, owing to data availability and measurement methods, most existing studies touch on the content and function of nostalgia; very few have empirically examined its salience, correlates and determinants by analysing reliable large-scale data.Footnote 3 In the present analysis, we aim to fill this research gap by presenting the first large-scale portrait of the spectrum of revolutionary nostalgia among 31 provincial-level regions in China
Specifically, we use the normalized frequency of searches for numerous red songs on Baidu 百度 (the most widely used online search engine in China) as a proxy for the aggregate level of local revolutionary nostalgia among Chinese between 2008 and 2014. We add to the literature by showing that the trends of provincial nostalgia are similar but stratified. This is also the first empirical study regarding whether and how the level of local nostalgia is shaped by a constellation of socio-political and economic factors at the macro level.
Seeing Red, Singing Songs
The origins of the red culture movement can be traced back to the 1942 Yan'an Forum on Literature and Art, which formed a major part of the Yan'an Rectification Movement (1942–1944). During this campaign, Party leader Mao Zedong 毛泽东 specifically demanded that, in assessing a work of literature or a work of art, both political and artistic criteria should be applied: “Literature and art are subordinate to politics, but in their turn exercise a great influence on politics … What we demand is a unity of politics and art, of content and form, and of the revolutionary political content and the highest possible degree of perfection in artistic form.”Footnote 4 Literary and artistic productions, such as art, music and poems, were perceived as an essential instrument to signify the splendid history of the communist victory and correct views of life and values. They provided an ideological and discursive framework through which to involve the party-state in the production of Chinese national identity.
After the establishment of the new China in 1949, revolutionary songs were further used to educate the masses and to promote political campaigns and socialist ideologies and values. Factory workers, peasants, soldiers and students were also encouraged to compose their own songs.Footnote 5 A People's Daily editorial from 1958 encapsulated this strategy, advocating that red songs, and red culture as a whole, should permeate every public and private space:
A large number of popular new red songs are printed with beautiful colourful pictures, with four or five million copies sold in places such as Shenyang and Beijing. The capitalist songs have long been cast aside by people and turned into waste paper. The vigorous development of the socialist singing movement has brought out tens of thousands of mass singing organizations all over the country. They have established powerful red music bases in factories, villages and schools … In order to completely eliminate the influence of capitalist music among the masses, the work of criticizing capitalist music will continue to be carried out in the light of the launch of the socialist singing movement. Lectures and concerts will be held in more grassroots units and red songs will be frequently printed and promoted in large numbers.Footnote 6
The wide range of red songs included revolutionary songs from the Soviet Union, translated into Chinese, as well as Chinese red songs dedicated to the founding fathers of the new China, postludes, military songs for improving morale, and theme songs or interludes from revolutionary movies and opera. One of the classic Chairman Mao anthems, “The east is red” (Dongfang hong 东方红), took its melody from a local folk song about love in northern Shaanxi. It first gained popularity in the revolutionary base area of Yan'an in 1942. Later, during the Cultural Revolution, the song became the de facto national anthem.Footnote 7 “Three rules of discipline and eight points for attention” (Sanda jilu baxiang zhuyi 三大纪律八项注意), a rousing military song about the eight regulations enforced in the army, was designed to enhance morale and draw support from the masses. A classic and typical example of an interlude from a revolutionary movie or opera is “My country” (Wo de zuguo 我的祖国), which was the theme song of a popular Korean war film, Shang gan ling 上甘岭, from 1956.
Aside from the classic/traditional revolutionary songs, which were composed and popularized mainly between the 1930s and the 1980s, there are “new” red songs, mostly written since the 1990s, which incorporate more diversified musical elements. Nowadays, while classic red songs are re-interpreted in contemporary social contexts, new red songs are juxtaposed with ideological meanings which extend the registers of political legitimacy to new development. For example, one of the most famous new red songs is “Being a soldier” (Zan dangbing de ren 咱当兵的人), which was composed in 1994 to sing the praises of the People's Liberation Army. Its lyrics celebrate the selfless commitment of soldiers to the nation's safety and their glorious missions in times of peace. Another famous song, the 1992 “Story of the spring” (Chuntian de gushi 春天的故事), was written in praise of Deng Xiaoping's 邓小平 far-reaching economic reform policies after 1978 and to celebrate his famous 1992 southern visit and calls for further opening-up policies.
For ordinary people living in pre-reform China, red culture was embedded in the entire cultural fabric of everyday life. To “sing red songs and go with the Party” was an internalized requirement for expressing one's allegiance to the state.Footnote 8 However, since the 1980s, with the advent of global consumerism and reform, singing revolutionary songs has become increasingly alien to everyday life, and popular music from Hong Kong, Taiwan, Japan and the West has become more fashionable among the younger generation.
Despite this, the legacy of red political culture and mass-line governance remains potent through the periodic promotion of new red songs. For example, the performance of red songs as part of a campaign to celebrate the Party's achievements and to resist Western influence was particularly encouraged through local social events and public education in the first decade of the 21st century. Inculcating the values celebrated in red songs was increasingly perceived as necessary for building a harmonious and prosperous society.Footnote 9 In view of this, in 2006, Jiangxi Satellite Television Broadcast launched its China Red Songs Singing Contest (Zhongguo hongge hui 中国红歌会), which attracted more than half a million contestants.Footnote 10
The red culture campaign reached its peak with the introduction of the Chongqing model in late 2007 when Bo Xilai 薄熙来, Chongqing's Party secretary at that time, launched an unusual political campaign calling on people to “sing red and crack the black” (chang hong da hei 唱红打黑) in order to popularize the collective identity of the communist legacy.Footnote 11 Shanghai and other cities including Wuhan and Changsha later sent delegations to Chongqing to learn about this red culture propaganda method.Footnote 12
The Chongqing model was wound up following Bo Xilai's downfall in 2012. However, the party-state still continued to emphasize the importance of promoting red culture in artistic productions to serve the Party's political priorities. In October 2015, Party leader Xi Jinping 习近平 stated at the Forum on Literature and Art that art is vital in realizing Chinese dreams and he called on artists to promote Party ideology and patriotism. His full remarks were published in 2016 and were interpreted as a response to Chairman Mao's speech at Yan'an in 1942.Footnote 13 The state media began to vigorously promote a red culture revival (including in art, literature, films, songs and celebrations of revolutionary icons) as a sign of “the great rejuvenation of the Chinese nation” and to counter the corrosive influences of contemporary commercialism and consumerism.Footnote 14
Red Song and Revolutionary Nostalgia
Nostalgia is a yearning for a return to a former place and time.Footnote 15 It is especially aroused when people face uncertainty and identity-discontinuity during great social transformations.Footnote 16 Nostalgia is of particular scholarly interest because it is affected not only by personal traits but also by a series of macro socio-political and economic factors.Footnote 17 Nostalgia is also of policy interest because it is crucial to understanding the socio-political trends of a given society and it relates to a variety of social/individual functions, ranging from serving as a repository of positive feelings to boosting self-esteem, enhancing social connectedness and increasing perceptions of social support.Footnote 18
Essentially, nostalgia can be divided into three subcategories: personal nostalgia, historical nostalgia and collective nostalgia. Personal nostalgia refers to one's directly experienced past and is equivalent to so-called “true” or “real” nostalgia. Certain external stimuli are required to evoke it. By contrast, historical nostalgia happens even if the ego has not personally experienced the original events. For instance, one may feel nostalgia in museums. Collective nostalgia refers to a common yearning shared by collective units, such as specific generations, nations or cultures.Footnote 19
Several triggers facilitate the emergence and pervasiveness of nostalgia, including music, lyrics, odours and negative mood states including loneliness and being scared.Footnote 20 Among these, music is of crucial importance in evoking a sense of nostalgia about one's past.Footnote 21 This is because of “the idiosyncratic associations that people have formed between particular songs and events in the past.”Footnote 22 On the one hand, listening to an old song can arouse dust-laden memories of the past and provoke various emotions in individuals. On the other, music can also become nostalgia itself, and music-evoked nostalgia may be reinforced in a group setting.Footnote 23 Since the formation of self-identity also takes place most rapidly and most frequently during one's adolescence and early adulthood, the music of one's youth will have an enduring impact throughout the remainder of one's life.Footnote 24
In post-communist Russia, singing the Soviet-era anthem with new lyrics has been documented to reflect nostalgia for the relative security of the era of Joseph Stalin.Footnote 25 This trend for revolutionary nostalgia reflects the deep loss and dissatisfaction felt by ordinary people towards state building and political reform in Russia.Footnote 26 As scholars observe:
The rise in nostalgia is most easily understood as a rise in frustration. There's nothing like rampant crime and corruption to make people long for the old police state; there is nothing like going without a paycheck for months or losing a job to make a subsistence wage seem like a security blanket … Even those who have modestly improved their living standard, purchasing new VCRs and better food, often feel poorer because they see how much they are missing out on.Footnote 27
Similarly, in China, singing red songs evokes popular nostalgia for the revolutionary past as “the golden age of Chinese socialism equipped with its own humane and spontaneous everyday culture.”Footnote 28 Since the launch of the opening-up policy in the 1980s, China has made great economic progress and generally maintained political stability. However, drastic changes in economic and social life have led to anxiety and uncertainty. The masses are increasingly anxious about their social statusFootnote 29 and the social problems caused by the single-minded pursuit of GDPFootnote 30 and increasing penetration of materialism, for example cadre corruption, income inequality, unemployment and money-driven values.Footnote 31 Altogether, these factors have given rise to nostalgia for the old days – a yearning for “a sense of solidarity, camaraderie, and simplicity.”Footnote 32 Rather than desiring “to recreate or rebuild the past,” people regard the Mao era as a society with “simple emotions and plain living.”Footnote 33 Singing red songs thus gives them some sense of comfort and stability.Footnote 34 One student, quoted in The Washington Post, embraced the ethos of the red culture campaign: “When I sing red songs, I find a kind of spirit I never felt when singing modern songs … To surround yourself with material stuff is just a waste of time.”Footnote 35
To summarize, we find that previous studies have focused primarily on how nostalgia is influenced by aggregate socio-economic factors, such as the unaffordability of day-to-day living, fragmented state welfare and other economic frustrations in the present time. However, given the limited data availability and methods of measurements, current scholarship on nostalgia remains mostly theoretical and there has been scant effort to empirically examine the exact degree of influence of those socio-economic variables. Moreover, in the Chinese context, the nostalgia felt by the populace can also be affected by official ideologies and political campaigns.Footnote 36 Themes such as communist revolution, liberation, collectivism, patriotism and anti-imperial struggles are invoked from time to time to confirm the political legitimacy of the Chinese Communist Party (CCP) as needed.Footnote 37 Nostalgia among the Chinese can, therefore, be seen as a hybrid of personal attachment to the past and an ideological propensity that is exploited and directed by the party-state. In this regard, “red” songs evoking nostalgia are very likely to be profoundly determined by socio-political factors and agendas. Building on the theorizations above, the present analysis will perform a systemic examination of the determinants of revolutionary nostalgia in contemporary China. In the following section, we clarify the methods and main variables that were used in order to collect and analyse data.
Measuring Revolutionary Nostalgia in China
Constructing the index of nostalgia
The local level of nostalgia is key to the present study. We developed a novel approach for constructing an index of revolutionary nostalgia (IRN), measured by online searches for red songs in China's 31 provinces (including four province-level municipalities and five province-level autonomous regions) on the Baidu search engine, the largest and most widely used internet search engine in China. First, we constructed a list of famous red songs. For each province, we then quantified the IRN by measuring the total frequency of searches for the titles of these songs on Baidu within the province. Baidu releases its scaled search engine volume data publicly on the Baidu Index (https://index.baidu.com). This provides the data searched for on Baidu over time from June 2006 to the present on a daily basis.Footnote 38 The Baidu-based red song search volume can also be representative of the total online search behaviour among Chinese internet users since Baidu is the most widely used search engine in mainland China (particularly since Google's exit from mainland China in 2010). As reported by the China Internet Network Information Center in 2017, more than 95 per cent of internet users in China choose Baidu over all other search engines.Footnote 39
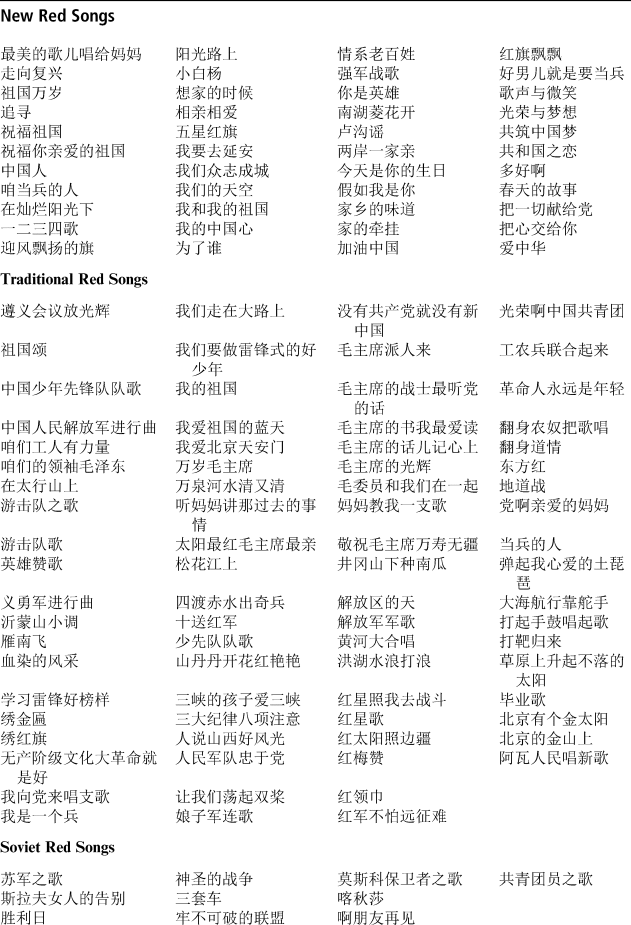
Based on the list of the most famous red songs published in Baidu's Encyclopedia (which is similar to Wikipedia), we gathered information for 172 of the most celebrated traditional red songs (composed before the 1990s) and 62 new red songs (composed after the 1990s). The Baidu Index provides search volume data for 88 of the most searched-for traditional red songs and 44 of the most searched-for new red songs, since data for songs with a search volume lower than a certain threshold are not provided by the index. Consequently, the list used for our main analysis contains 88 traditional red songs (including ten Soviet songs), while robustness checks also included 44 new red songs. The full list is presented in Table 1. To avoid device-using bias, we considered searches conducted from both computers and mobile devices. Also, given that internet access is uneven among provinces, we normalized the total frequency of searches for all red songs in each province using the responding annual provincial population of internet users to compute the IRN for all 31 provinces by:
 $$IRN_{i\_t} = \displaystyle{{\mathop \sum \nolimits_{k = 1}^m Search_{k\_i\_t}} \over {Netpop_{i\_t}}}$$
The Full List of Red Songs (Search Terms in the Baidu Index)

In Equation (1),  $IRN_{i\_t}$ is the index of nostalgia of Province i in year t,
 $Search_{k\_i\_t}$ is the frequency of searches for song k on Baidu by net users of Province i in year t, and
 $Netpop_{i\_t}$ represents the netizen population of Province i in year t. Further, m is 88 for traditional red songs.
We restricted our research to the period between 2008 and 2014 (inclusive). This is because the Baidu Index of provincial names is only available from 2008, and some key variables after 2015 were missing when we started collecting data in 2015. This relatively short time frame, in fact, has its own strengths: restricting our time range to seven years for the 31 provincial regions brings about panel data, not only of “small T, large N” (T = 7, N = 31) but also sufficient numbers of waves to improve the efficiency of estimation (both important for performing dynamic panel analysis). Note that we accessed daily search data for all songs for each province via the Baidu Index (https://index.baidu.com/) from 1 January 2008 to 31 December 2014. We then summed them up and computed the annual average data to perform a panel analysis, controlling for the annual socio-economic and political factors of all 31 provinces.
One issue nevertheless deserves further discussion. If we aim to construct a nationally representative portrait of nostalgia, we cannot be certain whether searchers of red songs on Baidu are representative of the overall Chinese population. Since the Baidu Index records age and gender, we examined the demographic distribution of red song searchers who logged in when performing a search and found that people older than 50 and younger than 19 were relatively underrepresented in comparison with the overall Chinese population. Two aspects, however, make our Baidu-based analysis insightful and reliable. First, the online queries came from the vast majority of around 600–700 million Chinese internet users, who accounted for around 40–50 per cent of the whole population from 2010 to 2015.Footnote 40 Outnumbering the entire US or Indian populations, the sheer numbers and growth rate of Chinese internet users make them a vast, powerful and interesting social force that deserves sociological inspection. Second, in the robustness check, we adopted a pseudo re-weighting strategy by dropping samples of less developed provinces (where fewer older people and youths have access to the internet) to make the sub-sample as representative as possible of the overall target population. By comparing the results from full samples and sub-samples, we could check whether our results are sensitive to sample compositions.
Spectrums of nostalgia
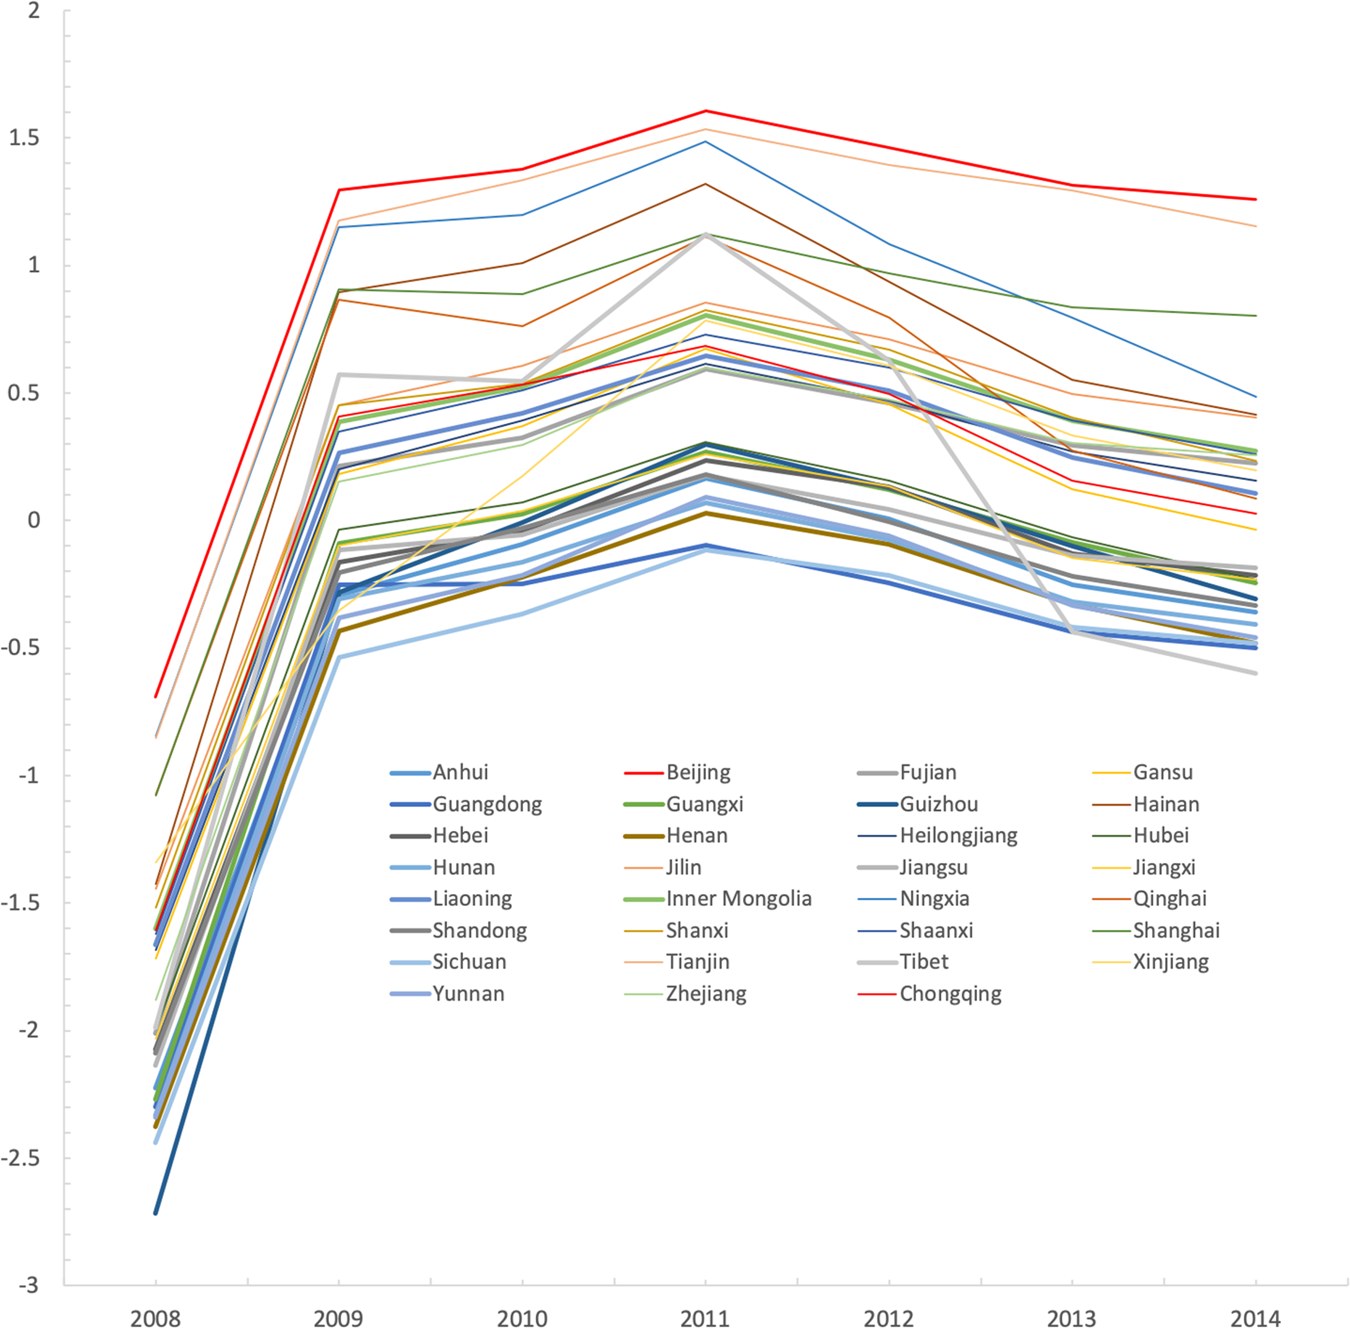
Figure 1 plots the Z-score of the IRN for all 132 red songs in each province from 2008 to 2014 to give a visual representation of the time trends and to identify the stratification of the IRN among provinces. It clearly shows a dramatic rise in the number of searches for red songs since 2008. This number rose steadily after 2009 and peaked in 2011 when a national campaign for promoting red culture was underway to celebrate the 90th anniversary of the founding of the CCP. During the campaign, the government at various levels organized citizens to perform patriotic and red songs to praise the Party for liberating the Chinese people from the Nationalist Party's oppressive rule, for founding a new socialist country, and for reviving the Chinese nation in the early 21st century.Footnote 41 There is a gradual decline in red song searches after 2011.
IRN of the Chinese Provinces, 2008–2014

Interestingly, but unsurprisingly, all provinces show almost the same overall tendencies from 2008 to 2014. Taking Shanghai and Chongqing for comparison, although the general trends in online searches for red songs are quite similar for both cities, the extent to which people harboured feelings of nostalgia towards the pre-reform era is much higher in Shanghai than in Chongqing over the seven years studied. This leads to the exciting speculation that revolutionary nostalgia is not merely a product of particular political atmospheres at the regional level, but rather a combination of people's reconstruction of collective memory and government-guided socio-political campaigning at the national level.
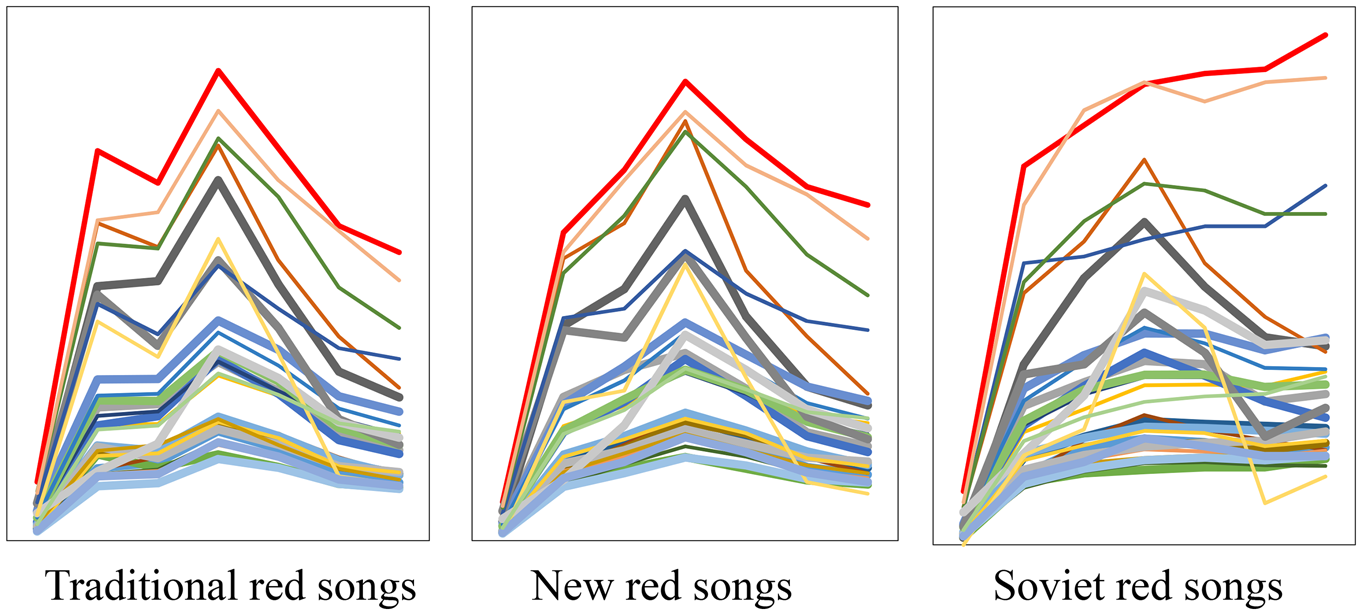
Using the same time framework between 2008 and 2014, we also present three types of IRN based on different types of red song (classic/traditional red songs, new red songs and Soviet red songs) in Figure 2. It is easy to see that the patterns for the three IRNs are, in general, consistent, except for searches for Soviet songs in some regions, such as Beijing.
IRN Based on Different Types of Red Songs, 2008–2014

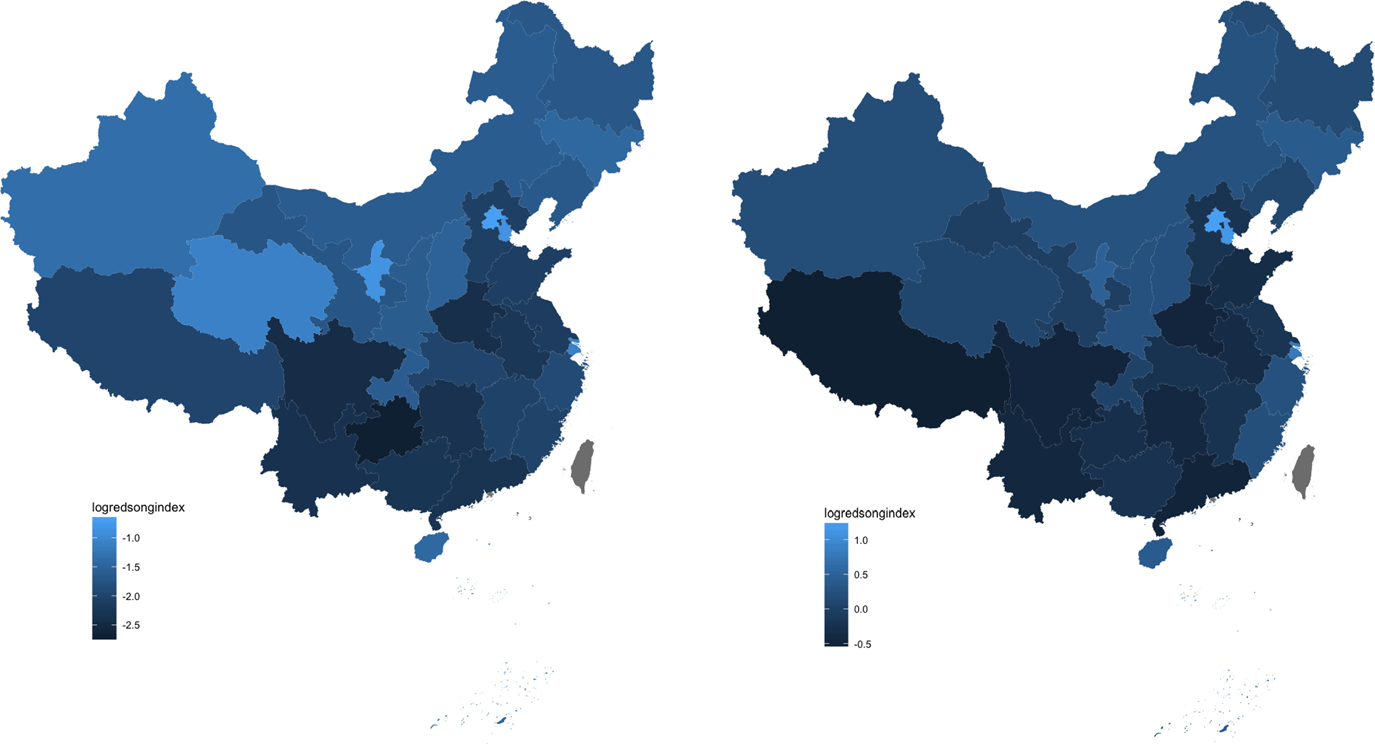
We used the time series data for each province's IRN to examine regional variation. As Figure 3 shows, between 2008 and 2014, online searching for red songs was most prevalent in Beijing, followed by two other province-level municipalities, Tianjin and Shanghai. We speculate that this may be owing to the fact that 1) Beijing is the political centre of China and Tianjin is geographically close to Beijing; 2) Shanghai is the birthplace of the CCP and the site of the First National Congress of the CCP in 1921, thus the historical context might explain the relatively higher level of searching for red songs there; and 3) province-level municipalities tend to focus more on developing urban community-level Party organizations, for which singing red songs and square dancing are often the most effective methods of social mobilization.Footnote 42
Geographic Distribution of IRN in 2008 (left) and in 2014 (right) in Surveyed Provinces

Notably, Chongqing, the newest inland municipality under the direct administration of central government, also ranked highly in revolutionary nostalgia. This is perhaps partly owing to the “sing red and crack the black” political campaign launched in late 2007.Footnote 43 In addition, Ningxia, Hainan and Qinghai, the three most undeveloped provinces, also topped the list, implying that the formation process of nostalgia is quite complicated. Likewise, the most developed provinces in coastal China (such as Guangdong, Jiangsu and Shandong) and some of the most undeveloped inland provinces (including Guizhou, Yunnan and Henan) had relatively low levels of revolutionary nostalgia. This encouraged us to perform a regression analysis to see how various local factors contribute to the level of revolutionary nostalgia.
Determinants of Nostalgia
To explore how the local level of revolutionary nostalgia is formed, we performed a regression analysis to see whether (and how) prior socio-economic and political conditions shape IRNs across Chinese provinces.
Data and variables
The dependent variable is the IRN. To consider the dynamic structure of nostalgia, we introduce its lagged value, or the IRN of the prior year, into the regression model. Following Jennifer Pan and Yiqing Xu's pioneering study on China's ideology, we include two economic indicators at the provincial level, economic development (GDP per capita) and income inequality (Gini coefficient), to predict regional revolutionary nostalgia.Footnote 44 Specifically, economic development is captured by the level of GDP per capita of the province. This factor reflects the production level and market size of a particular region.Footnote 45 Income inequality is also expected to impact the IRN significantly and is measured by the household Gini coefficient of the province.
In addition to this, we also consider whether education (edu) at the provincial level might have an impact on shaping regional revolutionary nostalgia, since Pan and Xu uncovered a relationship between the two. This variable is captured by the number of college students per 100,000 of the population. We also add a series of macro indicators suited to measuring regional development levels, such as the level of social development, legal development and the degree of globalization. Legal development is measured by the number of cases of administrative ligation per 100,000 people in a province.Footnote 46 It indicates the extent to which Chinese citizens, legal persons or other organizations have the right to, and can, prosecute a lawsuit in the courts if administrative organs or personnel infringe their lawful rights and interests. NGO development, as represented by the number of non-governmental organizations (NGO) per 100,000 people within the province, is an indicator of the strength of the public sphere, reflecting a region's social development level.Footnote 47 This has been shown to exert a far-reaching impact on nostalgia in previous literature. Finally, foreign tourism receipts (FTR) and foreign direct investment (FDI) are two widely used indices that measure the degree of globalization, a factor which may play a crucial role in influencing people's revolutionary nostalgia.Footnote 48
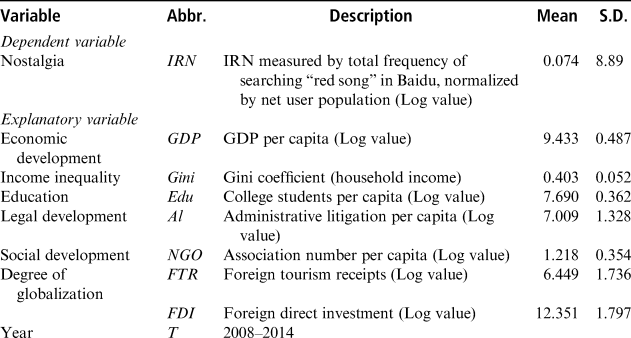
All of the original data, except for Gini coefficients, come from various years of the China Statistical Yearbook. Owing to the changing inflation rate between 2008 and 2014, the monetary variables are not comparable from year to year. Thus, we use the Consumer Price Index (CPI) to adjust data for inflation. In the analysis, we use a logarithmic transformation of GDP per capita. For GDP, FTR and FDI, we also convert the data into real values using 2008 as the base year of the CPI. Since the official provincial Gini coefficients are not available, we calculate the Gini coefficients from multiple data resources including the Chinese General Social Survey (CGSS), Chinese Social Survey (CSS) and China Family Panel Studies (CFPS). In the robustness check, we also use the Gini coefficients (2004–2010) calculated by Ye Tian to examine whether our findings are sensitive to different measures of the Gini coefficient.Footnote 49 We present the major statistics of the variables of interest in Table 2.
Descriptive Statistics of Variables of Chinese Provinces, 2008–2014
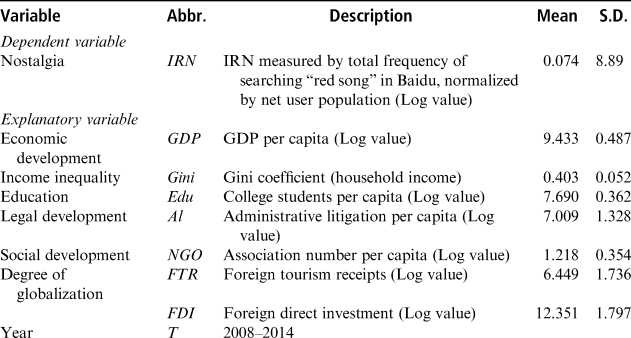
Notes: The means and standard deviations of IRN are scaled by a factor of 100,000 for readability.
Dynamic panel model
Since the level of revolutionary nostalgia in a certain province is very likely to be hinged on its past values in previous years (for instance, the IRN of the previous year), we take into account the dynamic structure in the model of the IRN at the provincial level by introducing the lagged-value of the IRN. To avoid a mutual causality problem, we impose the temporal order by using the lagged value of all the explanatory variables to predict the IRN. The model is thus written as:
 $$IRN_{i\_t} = \alpha IRN_{i\_\lpar {t-1} \rpar } + \beta _1GDP_{i\_\lpar {t-1} \rpar } + \beta _2Gini_{i\_\lpar {t-1} \rpar } + \beta _3Edu_{i\_\lpar {t-1} \rpar } + \beta _4Pol_{i\_\lpar {t-1} \rpar } + \beta _5NGO_{i\_\lpar {t-1} \rpar } + \beta _6FTC_{i\_\lpar {t-1} \rpar } + \beta _7FDI_{i\_\lpar {t-1} \rpar } + T_i + c_i + \mu _{it}$$
In Equation (2), IRN it is the dependent variable, representing the level of nostalgia in a particular province in year t, while  $IRN_{i\_\lpar {t-1} \rpar }$ is its one-year lag, or the nostalgia of the same province in the previous year. In addition, c i is the time-fixed regional effect and μ it is the error. We further control for T i, the time/year dummies to make the assumption of no correlation across provinces in the idiosyncratic disturbances more likely to hold. Note that we do not estimate the panel vector autoregression (VAR) model to include all historical levels of the IRN and other explanatory variables, since our panel data are relatively short (only seven waves).
To estimate the above model, we adopt the Generalized Method of Moments (GMM) estimator to deal with provincial heterogeneity problems.Footnote 50 Specifically, we perform (1) the unit-root test, to ensure that all variables are stationary time series; (2) the AR(2) test, to check whether μ it is serially correlated; and (3) the Henson/Sargan over-identification test, to examine the validity of these instruments. We report test results together with the model regression results in the following section.
Results
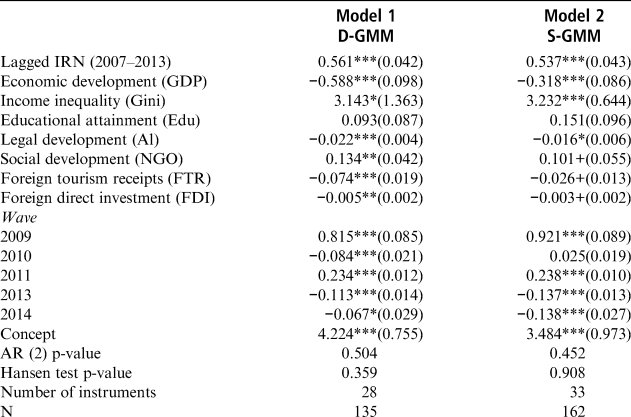
The regression results are presented in Table 3 using two different GMM estimators. First, we fit the Differenced GMM model (Model 1) to estimate how the IRN is shaped by a set of explanatory variables among Chinese provinces between 2008 and 2014. As the results from Model 1 show, the level of revolutionary nostalgia at the provincial level as measured by internet searches for red songs is obviously path-dependent, as it is positively and strongly predicted by its lagged value (the IRN of the previous year), with a coefficient of around 0.5. Holding other factors fixed, economic development measured by GDP per capita negatively predicts the IRN of the next year. As expected, income inequality significantly shapes local nostalgia. The negative and significant effect of the household Gini coefficient at the provincial level is around 3, suggesting that a 0.05 increase of Gini coefficient (a one-unit increase of standard deviation of Gini) will produce a 0.15 higher search frequency for red songs on the internet, which is around one-fifth of the mean of the IRN.
Dynamic Panel Regressions of IRN in Chinese Provinces, 2008–2014

Notes: IRN is measured by the frequency of searches for “red songs” on the Baidu search engine. Adjusted robust standard errors in parentheses; p < 0.1+ p < .05* p < 0.01** p < 0.001*** (two-tailed tests). The reference group is the year 2008. AR(2) is the Arellano-Bond test for zero autocorrelation in second-differenced errors (H0: no autocorrelation), and the Hansen test is the test of over-identifying restrictions (H0: over-identifying restrictions are valid). The year 2012 was dropped because of collinearity.
Legal development is also associated with the IRN. As shown in Model 1, the more administrative litigation cases in a province, the fewer searches there are for red songs. Interestingly, however, more NGOs lead to a higher IRN. This can probably be explained by the fact that most NGOs in China are state led and grassroot NGOs are strongly controlled by the state through a symbiotic relationship.Footnote 51 Although recent studies show that individuals with higher educational attainments tend to be more politically liberal, we find that, at the provincial level, education did not predict nostalgia.Footnote 52 This finding is consistent with the insignificant effect of education on nostalgia found in Russia.Footnote 53 We also find that the degree of globalization negatively predicts IRN, as expected. Specifically, both the FTR and FDI of the previous year are negatively correlated with the level of nostalgia at the provincial level. Finally, we also find a significant year effect, although the long-term time trend is not found.
Using System GMM estimators, we arrive at the same conclusion as that which we find with the DGMM method. Although not reported here, we fit pooled OLS and FE models and found the coefficients to be 0.856 and 0.354, both highly significant at 0.001 alpha level, showing that both the estimates from DGMM and SGMM are adaptable. Both Models 1 and 2 also passed the AR(2) test. The Hansen test p-values of both Model 1 and Model 2 were larger than 0.1, showing that the use of internal instruments is valid. However, the Hansen test p-values for Model 2 were close to 1, showing that instrument proliferation may be an issue. In this regard, we adopt results from Model 1 or the DGMM estimator.
Robustness check
We also ran a robustness check. First, if a certain red song, or a certain type of song, was far more searched for on Baidu, then the IRN measured by the sum frequency of searches for the song name may simply reflect searches for a very specific or certain type of red song. Given that Table 2 shows that the standard deviation of the IRN is big, we ran a Principal Components Analysis (PCA) for each province in each year to generate the overall index of search frequency, rather than simply computing a sum of 88 time series of searches. The results are, in general, consistent with those shown in Table 3.Footnote 54
Second, we tried different measures for several key variables to check if our results were sensitive to different operationalization. For instance, we added 44 new red songs to calculate the IRN. We also used the Gini coefficients calculated by Tian rather than those we computed from general social surveys.Footnote 55 We also construed the IRN measure by not normalizing it with the provincial population. Again, different measures did not change our major conclusion.
Third, we dropped several provinces from our samples to make the demographic as similar as possible to the whole population of China, particularly age structure. We found that the results from sub-sample and the results in our main analysis using full samples were almost identical. This shows that the determinants of nostalgia (and their effects) among Chinese internet users and the wider population are quite similar in general. Our conclusions thus not only apply to the netizens of China but also to the whole population of the country.
Conclusion
Until now, empirical investigations of the determinants of nostalgia have been very limited because such an analysis requires a large volume of high quality and reliable data. To the best of our knowledge, our study presents the first ever large-scale empirical examination of the trend and determinants of revolutionary nostalgia in contemporary China. To quantify the level of nostalgia, which may not be adequately measured through traditional survey methods, we constructed an index of revolutionary nostalgia (IRN) based on large volumes of online enquiry data extracted from searches for revolutionary songs on Baidu at the provincial level in mainland China. By measuring and mapping the spectrum of revolutionary nostalgia, we contribute to the extant literature by unveiling the regional and temporal variations of revolutionary nostalgia among the Chinese. In particular, we find that the evolving trends of nostalgia across the provinces are interestingly similar but stratified, showing that nostalgia for the pre-reform era results from a combination of pervasive socio-political power at all levels and local social contexts. Our method of quantifying nostalgia using such unprecedented amounts of data could be more widely used in future to examine the transformation of sociocultural dynamics over the long term.
We also empirically examine how the provincial level of revolutionary nostalgia is shaped by a constellation of prior socio-economic and political factors. We exploit the dynamic panel feature of our data to address the correlation between the lagged dependent variable and errors by employing the GMM estimator.
Our preliminary findings have several implications for deepening scholarly understanding of how nostalgic feelings about the pre-reform past emerge and evolve in contemporary China. First, China's revolutionary nostalgia appears to be a by-product of the joint effect of regional development level and state-led political mobilization. Regions with a higher level of income inequality are more likely to show a higher level of revolutionary nostalgia, implying that widening income inequality is the driving force behind this increased nostalgia for the Mao era. In addition, more nostalgic feelings towards the old regime are found in regions with greater capacity for political mobilization (such as Beijing, Tianjin and Shanghai).
We also find that the intensity of revolutionary nostalgia is significantly and positively predicted by its lagged value in the previous year, implying it is path dependent across regions. Third, holding all other factors fixed, regions with a higher level of economic and legal development and a higher degree of globalization tend to harbour less nostalgic feelings towards the old regime. This suggests that more open provinces also have more liberal political views and thus less revolutionary nostalgia.
Fourth, social development, as represented by the number of NGOs, positively predicts revolutionary nostalgia. This may be related to the fact that most NGOs in China operate under conditions of state patronage.Footnote 56 According to He Jianyu and Wang Shaoguang, among the eight million NGOs in China, seven million are top-down government-affiliated GONGOs.Footnote 57
Our findings nevertheless have some limitations that deserve further discussion. First, despite our considerable effort to extract related red songs, we may have still omitted important ones, a factor which could have led to underrepresentation in our sample. Second, searching for red songs online reflects only one dimension of revolutionary nostalgia. For instance, people might search online for great leaders, such as Chairman Mao and Premier Zhou for example, out of nostalgia for the past. The frequency of online searches for red songs could also be the result of several other factors, for example the intensity of red culture campaigns. Third, individuals searching for red songs online are likely to be a non-random sample, given that people aged 50 and above are under-represented – that particular age group might be expected to have a stronger sense of revolutionary nostalgia. Thus, data extracted from search engines could represent only netizens at most and not all Chinese citizens. Despite running a variety of robustness checks to avoid such bias, we hope future studies will empirically extend our preliminary results using more relevant controls and take advantage of the increasing number of netizens nationwide over time.
Acknowledgements
This study is funded by the research start-up fund from Guangzhou University and the School of Social Sciences and Institute for Data Science, Tsinghua University. The authors are grateful to the anonymous reviewers of The China Quarterly for their constructive comments. The views in this article are those of the authors, who are solely responsible for the interpretations and any remaining errors.
Biographical notes
Shuanglong LI is an associate professor of sociology in the department of sociology at the School of Public Administration, Guangzhou University. He holds a PhD degree in sociology from Kyushu University, Japan. His research interests cover health, social networks, social stratification and mobility. His articles have appeared in, among others, Social Science and Medicine, Social Indicators Research, Chinese Journal of Sociology and International Journal of Environmental Research and Public Health.
Fei YAN is an associate professor of sociology in the department of sociology at Tsinghua University. He received his academic training from the University of Oxford and Stanford University. His research focuses on political sociology, historical sociology and Chinese societies. His work has appeared in Social Science Research, Urban Studies, The Sociological Review, Social Movement Studies, Modern China, China Information and China: An International Journal.