I. INTRODUCTION
Copper (Cu) has widespread applications, such as heat exchangers, make-and-break electric switches, and sliding contact materials, due to its good electrical and thermal conductivities.Reference Kaczmar, Pirtrzak and Wlosinski1, Reference Li, Wong, Fuh and Lu2 The lack of strength and wear resistance, however, limits the extensive usage of pure Cu. Ceramic particle-reinforced Cu matrix composite combines the good electrical conductivity and ductility of metal matrix with the high strength and modulus of ceramic reinforcement, leading to better mechanical behaviors and higher service temperatures. Therefore, a variety of ceramics such as SiC, Al2O3, and TiB2Reference Tjong and Lau3–Reference Tjong and Lau6 have been added into the Cu matrix.
Recently, a family of layered ternary carbides, namely MAX phases (where M is a transition metal, A is a group IIIA to IVA element, and X is C or N), have attracted extensive interest mainly because of their fascinating electrical, thermal, and mechanical properties.Reference Schuster and Nowotny7–Reference Wang and Zhou9 When these carbides, Ti3AlC2 or Ti3SiC2 for instance, were added into Cu, significant improvements in both hardness and strength were obtained without much loss of the electrical conductivity.Reference Peng10–Reference Zhang, Sun and Zhou12 Because of the similarity in their crystal structures, another family of layered carbides with the formula of TnAl3Cn +2 or TnAl4Cn +3 (where T is Zr or Hf, n = 1, 2, and 3)Reference Wang, Zhou, Liao and Lin13, Reference Wang and Zhou14 can also be added into Cu to achieve similar or better effects. Among the Zr–Al–C systems, Zr2Al3C4 is the most attractive member, which possesses higher modulus, strength, and hardness than those of Ti3AlC2.Reference Gesing and Jeitschko15–Reference He, Zhong, Xu, Li, Bao, Wang and Zhou18 In the previous work, we synthesized a highly conductive and strengthened Cu matrix composite by adding Zr2Al3C4 particles.Reference Zhang, He and Zhou19 The electrical conductivity of the Cu/Zr2Al3C4 composite is comparable to that of Cu/graphite, which has been extensively used in sliding electrical contact applications, while the Cu/Zr2Al3C4 composite possesses superior mechanical properties.
Although bulk Zr2Al3C4 ceramic has higher strength and hardness than those of Ti3AlC2, the tensile strength of Cu/Zr2Al3C4 composite is much lower than that of Cu/Ti3AlC2 composite. In the Cu/Ti3AlC2 composite,Reference Zhang, Wang and Zhou20 a high-strength interfacial layer composed of Cu–Al solid solution and TiCx forms, which helps to transfer the load from the matrix to the reinforcement. In the newly developed Cu/Zr2Al3C4 composite, Zr2Al3C4 particles are mechanically gripped by Cu matrix,Reference Zhang, He and Zhou19 which does not favor the load transfer and results in the limited strengthening effects. Because the microstructures and properties of materials are generally related, characterizing and understanding the microstructure evolution are essential for optimizing the processing parameters and performance of Cu/Zr2Al3C4 composite. In addition, braze is a common jointing material between ultrahigh temperature ceramic and metal.Reference Suganuma, Miyamoto and Koizumi21–Reference Avishai, Scheu and Kaplan24 Understanding the reaction between Zr2Al3C4 and Cu matrix will also help to evaluate the joining between Zr2Al3C4 and Cu, enabling applications of Zr2Al3C4 as high-temperature coatings.
In this work, we investigate the structure stability of Zr2Al3C4 in a Cu matrix by annealing the as-synthesized Cu/30 vol%Zr2Al3C4 samples in the temperature range from 850 to 1050 °C. The structure stability of two binary carbides related to Zr2Al3C4, i.e., Al4C3 and ZrC, are also studied by annealing the as-synthesized Cu/30 vol%Al4C3 and Cu/30 vol%ZrC samples. Finally, implications to microstructure optimization of Cu matrix composites are discussed.
II. EXPERIMENTAL
A near fully dense Cu/30 vol%Zr2Al3C4 sample was prepared by the powder metallurgy method. The sintering temperature was set to be 850 °C; details of the experimental procedure are described in Ref. 19. To investigate the microstructure evolution, the as-prepared Cu/30 vol%Zr2Al3C4 samples were annealed at 850, 900, 950, 1000, and 1050 °C, respectively, with a soaking time of 20, 40, and 60 min, respectively, in a tube furnace with flowing Ar gas. To investigate the structure stability of the related binary carbides, Al4C3 and ZrC powders synthesized in our lab were mixed with Cu powder to prepare Cu/30 vol%Al4C3 and Cu/30 vol%ZrC composites. These samples were then annealed under the conditions identical to those of Cu/30 vol%Zr2Al3C4 samples.
The phase evolution of the annealed samples was characterized by x-ray diffraction (XRD) and Raman spectroscopy. The XRD data were collected using a diffractometer (Rigaku D/max-2500PC, Tokyo, Japan) in the step-scanning mode with Cu Kα radiation (λ = 1.541 Å). The scanning speed was 0.04° per step. The Raman spectra were measured at room temperature in a Raman spectrometer (JY LabRam HR 800, Longjumeau, France) using a He-Ne laser with a wavelength of 632.8 nm as the excitation source.
Microstructure evolution of Zr2Al3C4 in Cu was investigated using transmission electron microscopy (TEM). TEM specimens were prepared by slicing, mechanical grinding (down to ~30 μm), dimpling (down to ~10 μm), and ion beam milling at 4 kV. A Tecnai G2 F30 microscope (FEI, Eindhoven, The Netherlands) was used for TEM imaging. Fast Fourier transformation (FFT) was carried out using a DigitalMicrograph software package (Gatan Inc., Pleasanton, CA). Interfacial models were built on the basis of the observed interfacial structures using the Interfacial Builder code in the CeriusReference Li, Wong, Fuh and Lu2 computational program (Molecular Simulation Inc., San Diego, CA).
III. RESULTS
A. Structure stability of Zr2Al3C4 in Cu matrix
1. Phase evolution of Cu/Zr2Al3C4 composites at high temperatures
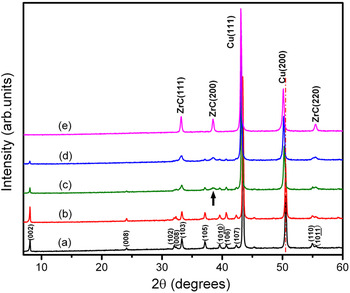
In the as-prepared Cu/30 vol%Zr2Al3C4 composite, Zr2Al3C4 particles are uniformly distributed in Cu matrix. Figure 1 shows the XRD patterns of the as-prepared and annealed samples. In the as-prepared sample, only Zr2Al3C4 and Cu are identified [Fig. 1(a)]; these two phases remain unchanged after annealing up to 900 °C [Fig. 1(b)]. When the annealing temperature reaches 950 °C, an apparent reaction between Cu and Zr2Al3C4 occurs. After annealing at 950 °C for 40 min, Cu peaks shift to low angles [Fig. 1(c)], indicating the formation of a Cu–Al solid solution; this is because Cu has high affinity to Al at high temperatures and the lattice constant of Cu–Al solid solution is larger than that of pure Cu. The XRD pattern shown in Fig. 1(c) also indicates the precipitation of a small amount of ZrC. Consistently, the intensity of Zr2Al3C4 reflections decreases [Fig. 1(c)]. Prolonged annealing at 950 °C results in further reduction of the intensity of Zr2Al3C4 reflections in conjunction with an increase of the intensity of ZrC peaks and a further shift of Cu peaks toward low angles [Fig. 1(d)]. When the annealing temperature reaches 1050 °C, only ZrC and Cu are detected by XRD [Fig. 1(e)], which indicates the completion of the Zr2Al3C4 decomposition.
XRD patterns of (a) as-prepared Cu/30 vol%Zr2Al3C4 sample and those annealed at (b) 900 °C for 60 min, (c) 950 °C for 40 min, (d) 950 °C for 60 min, and (e) 1050 °C for 60 min, respectively.

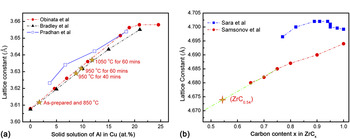
Lattice constants of Cu and ZrC in the samples treated under different conditions are measured and listed in Table I. It can be seen that with the increase of annealing temperature and annealing time, the lattice constant of Cu increases. Extensive reportsReference Obinata and Wassermann25–Reference Pradhan and De27 on the dependence of lattice constants of Cu–Al solid solution are summarized in Fig. 2(a). By linear fitting of the measured lattice constants of Cu into Obinata et al.Reference Obinata and Wassermann25 and Bardley et al.Reference Bradley and Goldschmidt26 results, the calculated solid solubility of Al in Cu under different annealing conditions are obtained [marked with stars in Fig. 2(a) and listed in Table I]. For the sample annealed at 1050 °C for 60 min, the Al fraction in the solid solution is calculated to be 12 at.%. Theoretically, if all Al in Cu/30 vol%Zr2Al3C4 sample dissolves into Cu matrix, the Al fraction should be 12.3 at.%. With the experimental errors, this is essentially identical to the fitted experimental result. According to the Al–Cu binary phase diagram, the solid solubility limit of Al in Cu is around 18 at.%; thus, no Cu–Al intermetallic phase should form during annealing. Therefore, it is concluded that after annealing at 1050 °C for 60 min, all Al dissolve into the matrix.
(a) Measured lattice constants of Cu–Al solid solution variation as Al solubility from Refs. 25–27 and the results of this work (marked with stars), (b) lattice constants of cubic ZrCx as a function of carbon content in Refs. 28 and 29 and the results of this work (marked with stars).

Lattice constants of Cu and ZrC in the samples under different annealing conditions.

If Zr2Al3C4 merely undergoes the depletion of Al (without changing the Zr/C ratio), the resultant ZrC will depart from its stoichiometry. It was reported that the stoichiometry of ZrC varied in a wide range from ZrC0.45 to ZrC0.95.Reference Ozoliņš and Häglund28–Reference Hugoosson, Eriksson, Jansson and Johansson30 A few works studied the variation of lattice constants of ZrCx with the substoichiometry,Reference Samsonov, Koval’chenko, Petrykina and Naumenko31, Reference Sara32 but there is a significant difference among the results [shown in Fig. 2(b)]. Because the lattice constant of ZrC1.0 (a = 4.694 Å) from Ref. 31 matches with the JCPDS (PDF Card No. 730477), the lattice constant of ZrCx in this work is linearly fitted according to it. It is found that the reaction product, ZrC, is understoichiometrc in C with the formula of ZrC0.54 [marked in Fig. 2(b)]. Taking into account the mass conservation, the reaction between Zr2Al3C4 and Cu can be described as

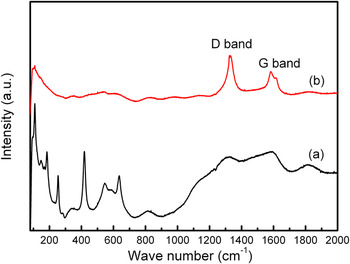
Compared with XRD patterns, Raman spectrum is suitable to detect the presence of graphite.Reference Ferrari33 In Fig. 3(a), sharp and intensive peaks at 108, 148, 183, 253, 418, and 633 cm−1 are clearly detected for the as-prepared Cu/30 vol%Zr2Al3C4 sample, which is presumed to be characteristic Raman peaks of Zr2Al3C4.Reference Wu, He, Bao and Zhou34 After annealing at 1050 °C for 60 min, only two peaks at higher wave numbers, i.e., 1331 and 1586 cm−1 can be distinguished [Fig. 3(b)], which correspond to the D and G modes of carbon. Single crystalline graphite has a single Raman active mode, a zone-center mode at 1580 cm−1 of E 2g symmetry [labeled “G” for “graphite” in Fig. 3(b)]. Disordered graphite has a second vibration mode at around 1350 cm−1 of A 1g symmetry (labeled “D” for “disorder”).Reference Robertson35 Consequently, the intensity ratio of the D and G modes, I(D)/I(G), which varied inversely with the in-plane correlation length L a of the graphite,Reference Tuinstra and Koening36 revealed the disordering of graphite. The intensity ratio of the D and G modes in Fig. 3(b) is 1.70, which indicates that the graphite resulted from decomposition of Zr2Al3C4 is highly disordered with small in-plane correlation length.
Raman spectra of (a) as-prepared Cu/30 vol%Zr2Al3C4 sample and (b) sample annealed at 1050 °C for 60 min.

2. Stability of Al4C3 and ZrC in Cu at high temperatures
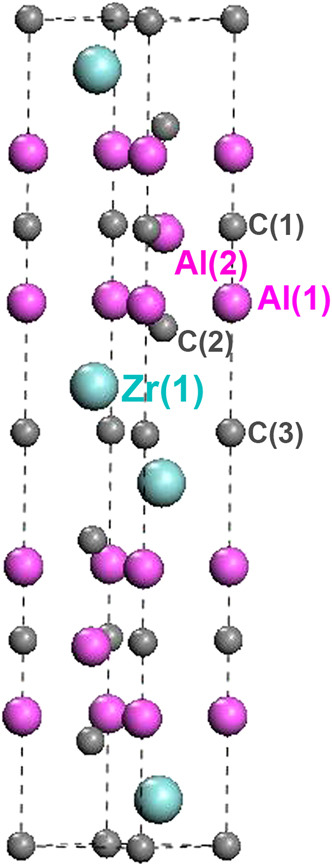
The crystal structure of Zr2Al3C4 is shown in Fig. 4. It crystallizes in the space group of P63/mmc,Reference Parthé and Chabot37, Reference Lin, Zhuo, He, Zhou, Li and Wang38 with an intergrowth of two alternatively basic units—a Zr–C slab with C atoms in octahedral Zr coordination and a Al–C slab. These two slabs share the carbon-atom network at their boundaries and the atomic bonding characteristic of the Zr2C and Al3C2 units in Zr2Al3C4 are similar to those in ZrC and Al4C3, respectively. Evaluating the structure stability of Al4C3 and ZrC will help to understand the stability of Zr2C and Al3C2 units in Zr2Al3C4. Therefore, the as-synthesized Cu/30 vol%Al4C3 and Cu/30 vol%ZrC samples are annealed under the conditions identical to that of Cu/30 vol%Zr2Al3C4 samples.
Crystal structure of Zr2Al3C4.

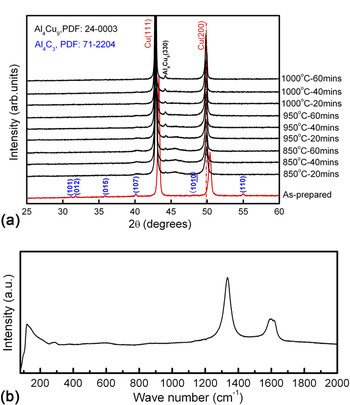
The XRD patterns of the as-synthesized and annealed Cu/30 vol%Al4C3 samples are presented in Fig. 5(a). In the as-synthesized sample, the peaks that belong to Al4C3 and Cu can be identified clearly. After annealing at 850 °C for 20 min, the Cu peaks shift to low angles, indicating the dissolution of Al into Cu matrix. With the increase of the annealing temperature and time, the Al4Cu9 phase emerges and the position of Cu peaks remains unchanged. If all Al in the Cu/30 vol%Al4C3 sample dissolves into Cu, the solid solubility is 21.6 at.%, which is already over the solid solubility limit of Al in Cu. Consequently, intermetallic compound forms as the reaction product. Since ZrC is stable in contact with Cu, no reaction occurs in Cu/30 vol%ZrC composite in the whole temperature ranges (not shown here).
(a) XRD patterns of the as-synthesized Cu/30 vol%Al4C3 sample and those after annealed under different conditions, (b) Raman spectra of the Cu/30 vol%Al4C3 sample annealed at 1000 °C for 60 min.

Raman analysis is also performed to characterize the Cu/30 vol%Al4C3 sample after annealing at 1000 °C for 60 min and the result is presented in Fig. 5(b). Only two peaks at 1334 and 1584 cm−1 can be distinguished, which correspond to the D and G modes of graphite, respectively. The intensity ratio of the D and G modes in Fig. 5(b) is analogue to the spectrum shown in Fig. 3(b). The graphite from the decomposition of Al4C3 is also highly disordered with a small in-plane correlation length, which provides the evidence that the graphite resulting from decomposition of Zr2Al3C4 is from the Al–C unit in its crystal structure.
Al4C3 is known as the only intermediate compound in the Al–C binary system and extensive investigations of its stability were performed.Reference Binford, Strohmenger and Hebert39–Reference Qiu and Metselaar41 In this work, it is interesting to notice that Al4C3 reacts with Cu at lower temperatures than that for Zr2Al3C4. The structure stability difference of the Al–C units in Al4C3 and Zr2Al3C4 can be explained in view of the atomic bonding. The ideal tensile strength reflects the atomic bonding strength between atoms. The ideal tensile strength of Al–C bond in Zr2Al3C4 is calculated to be 26.8 GPa.Reference Wang, Zhou, Lin and Liao42, Reference Wang, Zhou, Lin, Liao and He43 Calculation is also performed on Al4C3 using an identical method, and the calculated ideal tensile strength is only 21 GPa.Reference Liao, Wang and Zhou44 In other words, the atomic bonding between Al and C atoms becomes stronger when the Al–C unit intercalates with the Zr–C unit to form Zr2Al3C4. Therefore, ternary carbide Zr2Al3C4 exhibits higher stability than Al4C3 in Cu matrix.
B. Typical microstructure of Cu/Zr2Al3C4 composite during annealing
The aforementioned results suggest that the decomposition of Zr2Al3C4 is triggered by the depletion of Al atoms accompanied with the formation of ZrC0.5 and graphite. To reveal the microstructure evolution of Cu/Zr2Al3C4 composite during annealing, the as-prepared Cu/30 vol%Zr2Al3C4 sample and those annealed at 950 and 1050 °C for 60 min were analyzed by TEM.
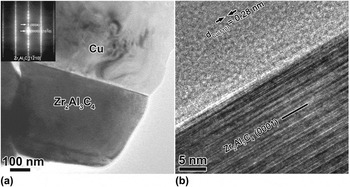
Figure 6(a) indicates the microstructure of the as-synthesized Cu/30 vol%Zr2Al3C4 sample. No reaction between Zr2Al3C4 and Cu are observed. The high-resolution TEM (HRTEM) lattice image of the interface is shown in Fig. 6(b). The Zr2Al3C4 grain orients in the [ ] zone axis and the interface is parallel to its basal plane. No low-index orientation relationship exists between Cu and Zr2Al3C4; therefore, only weak fringes of the Cu (110) plane are visible. At the interface, an amorphous layer links Cu and Zr2Al3C4 grains. Further analysis finds the presence of the O, Cu, and a small amount of Zr and Al.
(a) Typical microstructure of the as-synthesized Cu/30 vol%Zr2Al3C4 sample and corresponding SAED pattern (inset), (b) HRTEM image of the Zr2Al3C4 grain with the electron beam parallel to [ ] direction.

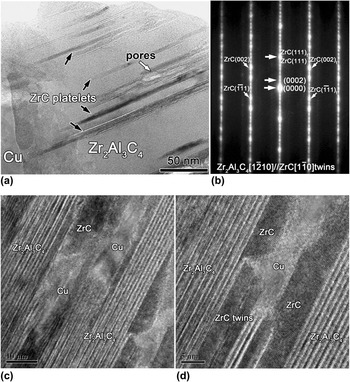
When the annealing temperature reaches 950 °C, pores and thin ZrC platelets are observed inside Zr2Al3C4 grain, as indicated in Fig. 7(a). The formation of ZrC microtwins is also revealed by the selected-area electron diffraction (SAED) pattern shown in Fig. 7(b). Compared with XRD, TEM is able to display the crystallographic and morphological information from small domains. The alternating distributions of ZrC and Cu platelets as well as thin ZrC twins are observed inside Zr2Al3C4 grain [Figs. 7(c) and 7(d)].
(a) Typical morphology of Zr2Al3C4 grain in the sample annealed at 950 °C, (b) corresponding SAED patterns, (c, d) HRTEM image of (a) in which Zr2Al3C4, ZrC and Cu platelets as well as ZrC twins can be identified.

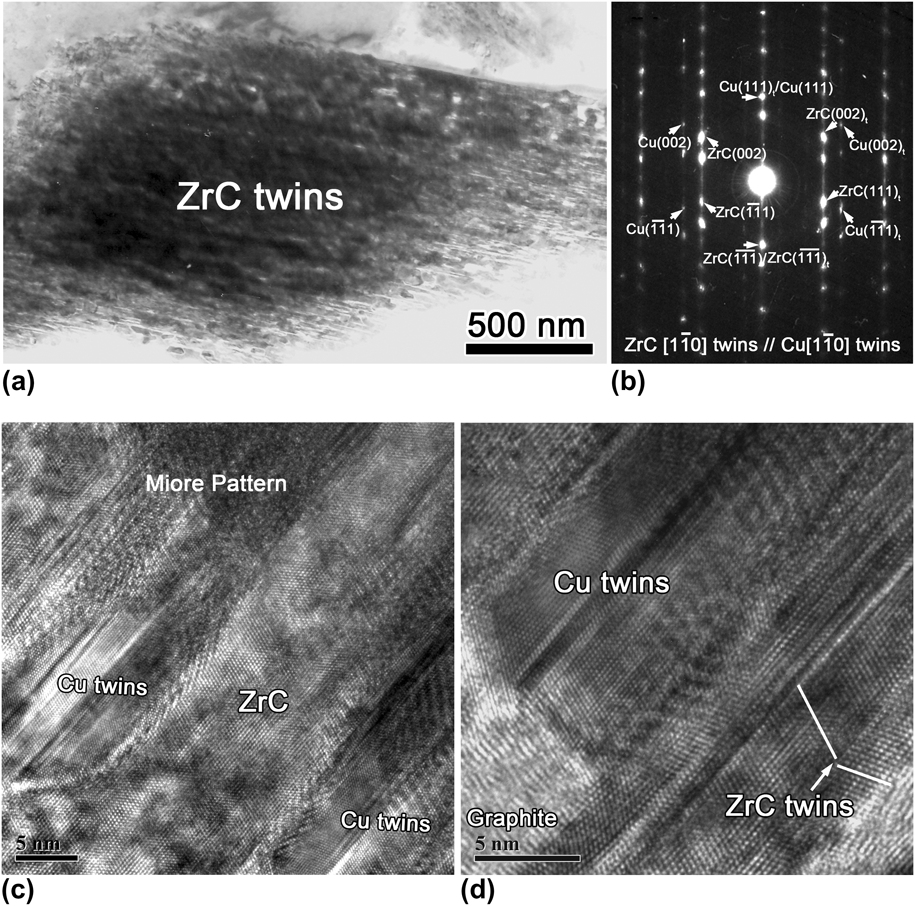
Increasing the annealing temperature to 1050 °C, there is no Zr2Al3C4 detected in the sample, which is consistent with the XRD result. The main phases are cubic ZrC and Cu. Both phases are highly twinned and present a lamellar structure, as shown in Fig. 8(a). As shown in the SAED pattern in Fig. 8(b), the following orientation relationship between ZrC and Cu exists


(a) Characteristic morphology of Zr2Al3C4 grains in the sample annealed at 1050 °C for 60 min, (b) corresponding SAED patterns of highly twined ZrC and Cu, (c, d) HRTEM images with alternative arrangements of ZrC and Cu twins.
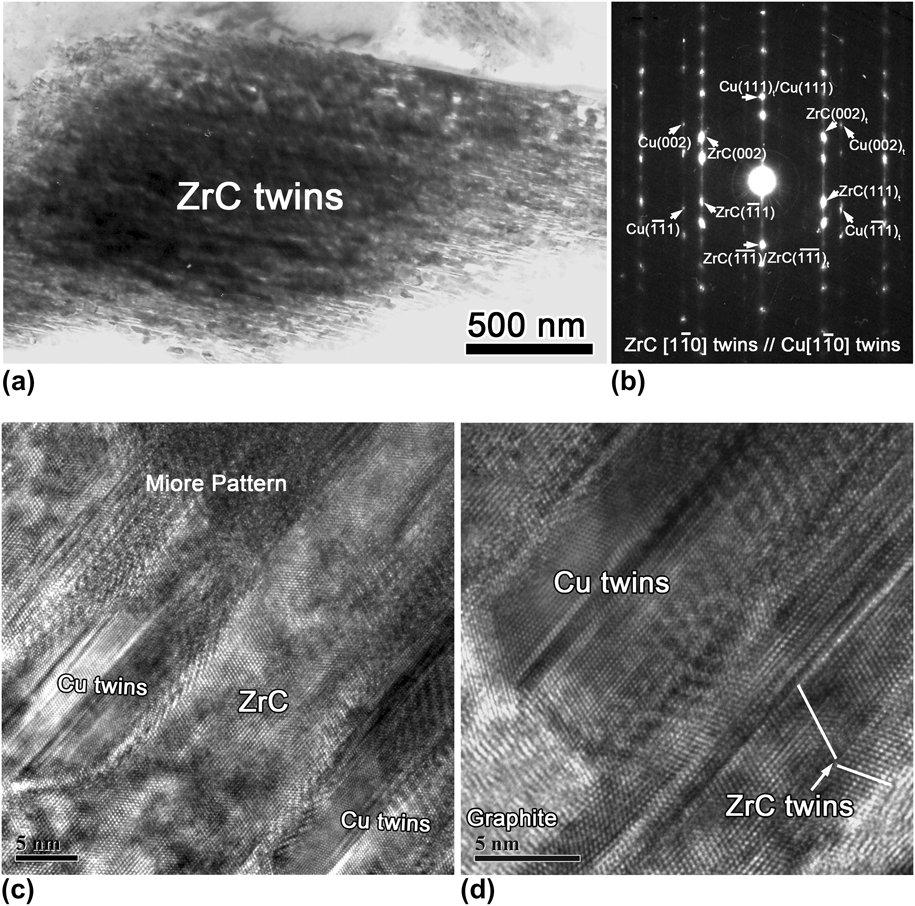
This kind of cube-on-cube orientation relationship is likely produced by intergrowth of Cu and ZrC lamellas. The continuous distributions of ZrC and Cu twins as well as graphite are clearly identified in Figs. 8(c) and 8(d). Moiré patterns are also observed, which are formed by overlapping of Cu and ZrC platelets.
C. Microstructure evolution of Zr2Al3C4 in Cu
The results in earlier sections have demonstrated that the reaction between Zr2Al3C4 and Cu strongly depends on temperature. No reaction happens up to 950 °C. In the temperature range from 950 to 1000 °C mild reactions occur, Cu and ZrC coexist inside Zr2Al3C4 grains. When the temperature reaches 1050 °C, highly twinned ZrC and Cu with alternating distributions form. With the help of Raman spectrum, highly disordered graphite is identified as another decomposition product of Zr2Al3C4. Further investigations are necessary to understand the evolution of Zr2Al3C4 in Cu at different temperatures.
1. Mild reaction between Zr2Al3C4 and Cu
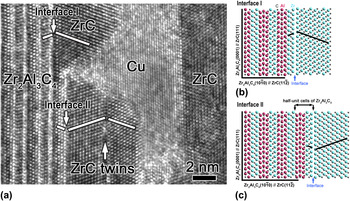
As shown in Fig. 7(a), mild reaction happens between Zr2Al3C4 and Cu above 950 °C, resulting in the inner growth of ZrC, Cu, and pores inside Zr2Al3C4 grains. The HRTEM image of the Zr2Al3C4 grain is further enlarged [Fig. 9(a)], in which ZrC platelets distribute adjacent to Zr2Al3C4. Further analysis shows that the orientation relationships between Zr2Al3C4 and ZrC are different in the regions named “Interface I” and “Interface II,” which are




HRTEM image shows (a) inner growth of ZrC and Cu platelets inside Zr2Al3C4 grain, (b, c) interfacial models of “Interface I” and “Interface II.”

To achieve better understandings of the structure relationship between Zr2Al3C4 and ZrC, interfacial models are proposed in Figs. 9(b) and 9(c). In the regions named “Interface I” and “Interface II”, ZrC lamellae adjoin to different planes of the ternary carbide, the interval of which is half a unit cell of Zr2Al3C4. ZrC lamellae present mirror symmetrical arrangements with the adjacent Zr2Al3C4 plane in both regions I and II. The formation of ZrC and Cu lamellae inside Zr2Al3C4 grains are explained subsequently.
Projected on the ( ) plane, Zr2Al3C4 can be described as two adjacent Zr–C–Zr chain and Al–C unit sharing C atoms, as clearly indicated in the left part of Figs. 9(b) and 9(c). When ZrC is projected on the (
 ) plane, the Zr–C–Zr chain exhibits the same arrangement as that in Zr2Al3C4. In the presence of Cu, which has an affinity to Al at high temperatures, Al atoms deintercalate from Zr2Al3C4, which destroys the entire Al–C unit and leaves a thin ZrC platelet. The depletion of Al–C unit causes volume shrinkage vertical to the basal plane of Zr2Al3C4; therefore, the inner diffusion of Cu is easier. However, the volume shrinkage is quite large and pores are also observed inside Zr2Al3C4 grains.
Directly abutting against Cu, a thin twinned ZrC slice is observed inside the Zr2Al3C4 grain in the sample after mild reaction at 950 °C [Fig. 7(d)]. Figure 10(a) shows the enlarged and Fourier-filtered image of this twinned ZrC slice. The formation mechanism of ZrC twins is similar to that of TiC twins during reaction between Ti3AlC2 and Cu, which is sufficiently discussed in Ref. 20. In short, the NaCl-structured ZrC has two different {111} planes, which are denoted as Zr {111} and C {111}, respectively. Consequently, there are two possible types of ZrC (111) twin boundaries, i.e., Zr {111} terminating and C {111} terminating boundaries. In the C {111} terminating boundaries, C atoms bond adjacent Zr atoms equally, so the twin boundaries present a mirror symmetry. If Zr {111} terminates on both sides, a glide occurs as a result of the electrostatic repulsion between adjacent Zr atoms, as shown in Fig. 10(b). In this work, the ZrCx is understoichiometric in C with the formula of ZrC0.54, which enhance the direct bonding between Zr atoms.
(a) ZrC twins after image processing by Fourier filtering and (b) interface model of ZrC twin with Zr {111} terminating boundary.

2. Severe reaction between Zr2Al3C4 and Cu
At 950 °C only a mild reaction occurs. With the annealing temperature increased to 1050 °C, severe reaction happens. Cu and cubic ZrCx are the main phases. The resultant ZrCx is understoichiometric in C with the formula of ZrC0.54. Abundant C vacancies enhance the direct bonding between Zr atoms; therefore, the formation of ZrC twins is strongly promoted. Because the stacking fault energy of Cu is relatively low, twinning should be a common phenomenon. Consequently, Cu coexists with ZrC and both of them are highly twinned.
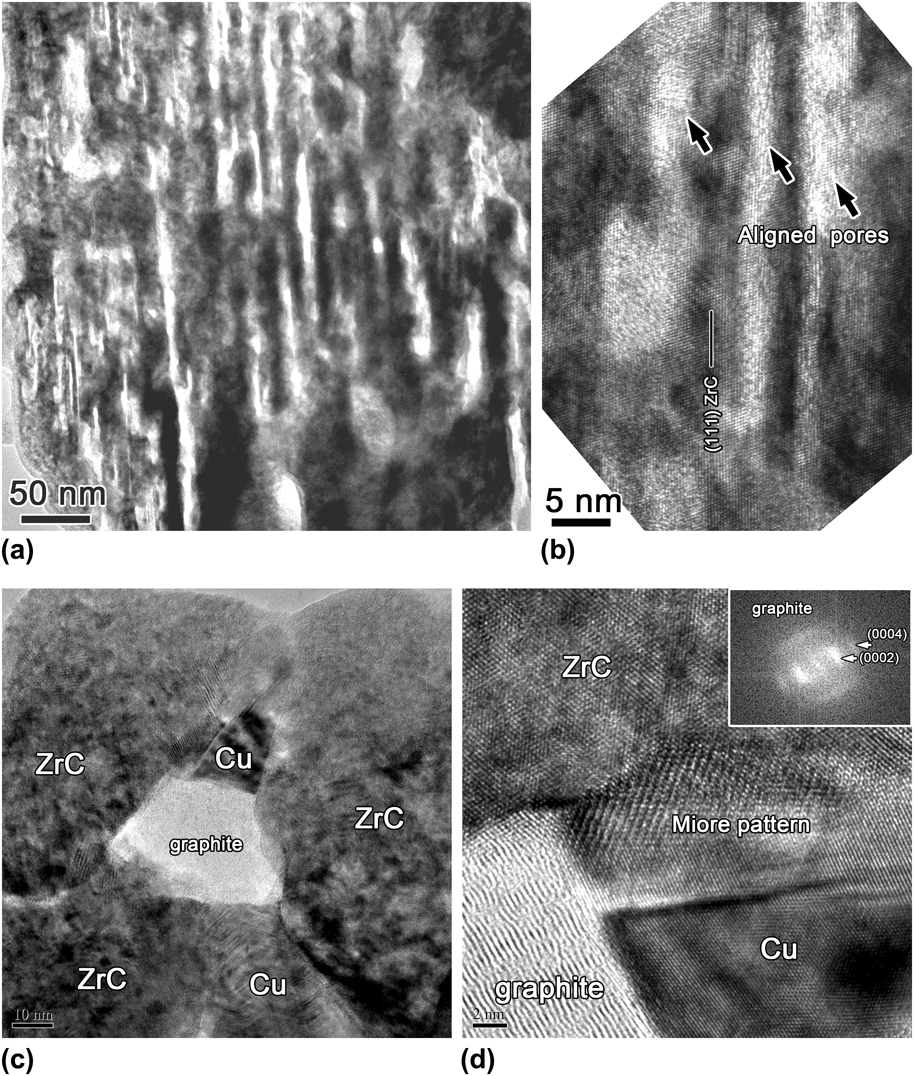
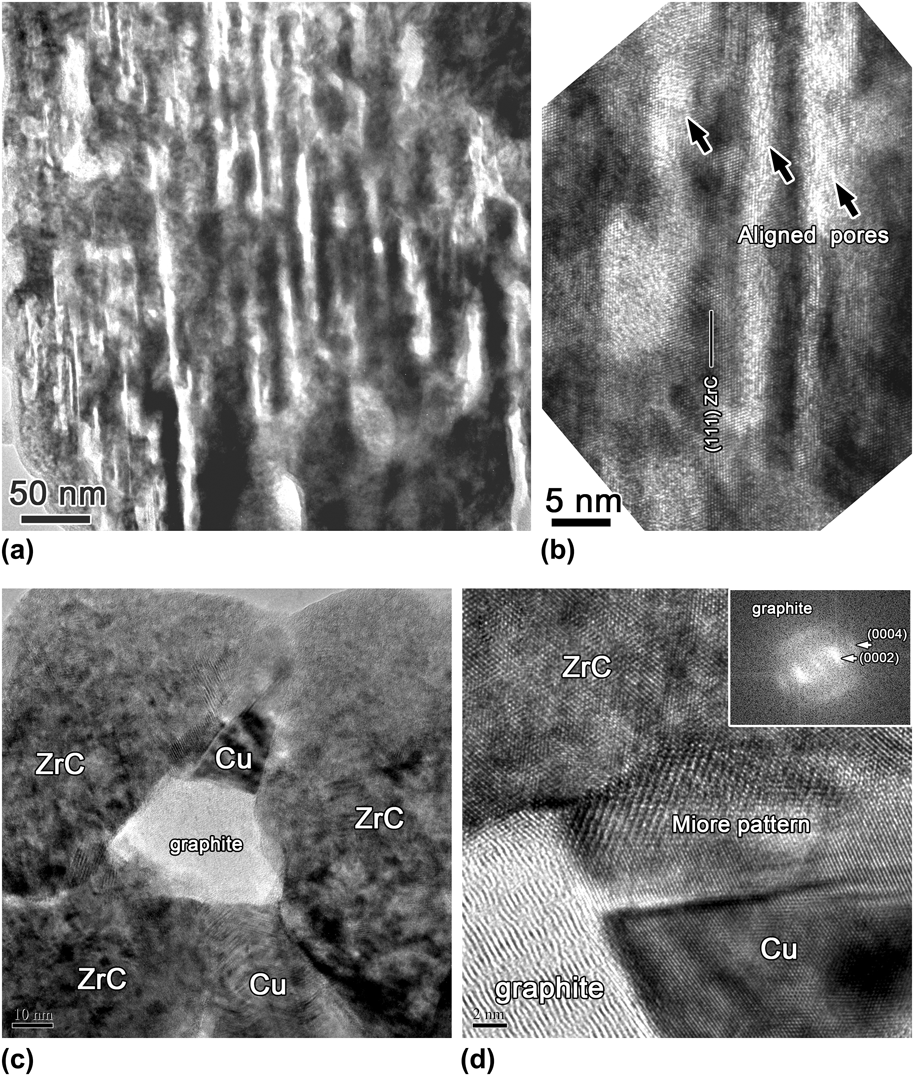
The decomposition of Zr2Al3C4 into ZrC0.54 accompanies with large volume shrinkage of ~52.5%. Consistently, a large number of pores are observed inside the ZrC grains, as shown in Fig. 11(a). The enlarged image [Fig. 11(b)] shows that these pores align parallel to the (111) plane of ZrC. On the basis of the orientation relationship between the ZrC and Zr2Al3C4 [presented in Figs. 9(b) and 9(c)], the (111) plane of ZrC is parallel to the basal plane of Zr2Al3C4. Thus, the aligned pores are parallel to the basal plane of Zr2Al3C4, along which Al and C atoms could migrate outward easily. The coexistence of ZrC, Cu, and graphite is also detected by TEM in the sample annealed at 1050 °C [Fig. 11(c)]. In the enlarged image [Fig. 11(d)], the atomic arrangements of ZrC and Cu as well as the Moiré patterns formed by the overlap between them can be distinctly identified. Additionally, the lattice image of graphite and its FFT pattern are also presented. Significant disruption to the ordered graphite structure is evident.
(a) Typical morphology of ZrC grains in the sample annealed at 1050 °C, (b) enlarged image with aligned pores parallel to ZrC (111) plane, (c) coexistence of ZrC, Cu, and graphite in the sample annealed at 1050 °C, and (d) HRTEM image of the triple phase with the FFT image of graphite inserted.
3. Microstructure evolutionary stages of Zr2Al3C4 in Cu
On the basis of the evidence presented previously, we propose that microstructure evolution of Zr2Al3C4 in Cu matrix at high temperatures can be divided into the following stages. At high temperatures, the chemical affinity between Al and Cu acts as the driving force for Zr2Al3C4 decomposition. Al atoms diffuse outward along the basal plane of Zr2Al3C4, which leads to deintercalation of the entire Al–C unit in conjunction with volume shrinkage. Meanwhile, Cu diffuses into Zr2Al3C4 grains along the channel formed by the volume shrinkage. During the mild reaction stage, only localized deintercalation of the Al–C unit occurs, resulting in the formation of a thin twinned ZrC and Cu platelets inside Zr2Al3C4 grains [as illustrated in Fig. 12(a)]. Figure 12(b) indicates the next stage in the microstructure evolution. After the entire Al–C unit depletes from Zr2Al3C4, disordered graphite and ZrC0.5 twinning slabs form. The transformation from Zr2Al3C4 to cubic ZrC0.5 is accompanied by large volume shrinkage of ~52.5%. Therefore, aligned pores, which are parallel to the outward diffusion pathway of Al and C atoms, are observed inside ZrC grains. In the final stage of the microstructure evolution, recrystallization occurs, resulting in the rearrangement of C vacancies in ZrC0.5. Highly twinned ZrC0.5 and Cu–Al solid solution as well as graphite are the final products [Fig. 12(c)].
Microstructure evolutionary stages of Cu/Zr2Al3C4 composite.

IV. DISCUSSION
Generally, Cu is chemically inert to most ceramics, such as SiC and Al2O3. In the as-synthesized composite, Cu matrix and these ceramic reinforcements are mechanically bonded. On the contrary, Zr2Al3C4 can react with Cu at high temperatures. Investigation of the reaction between Cu and Zr2Al3C4 promotes the understanding of the interfacial structure and chemistry in the composite. Therefore, it is possible to optimize the microstructure of Cu matrix composites by controlling the interfacial reaction. The microstructure, especially the interfacial structure, has a significant impact on the properties of the resultant composite.Reference Rühle45–Reference Romanova, Balokhonov and Schmauder47 In this section, the correlation between the interfacial structure and properties of Cu matrix composites will be discussed.
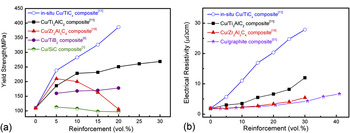
In Fig. 13(a), the yield strength of Cu matrix composites reinforced by in situ formed TiCx,Reference Zhang and Zhou11 Ti3AlC2,Reference Zhang and Zhou11 Zr2Al3C4,Reference Zhang, He and Zhou19 TiB2,Reference Tjong and Lau3 and SiCReference Tjong and Lau6 particles, which are all fabricated by powder metallurgy methods, are summarized. The superior strengthening effect can be observed with the introduction of in situ TiCx and Ti3AlC2 particles into Cu matrix compared to Zr2Al3C4, TiB2, and SiC particles. In the Cu/Ti3AlC2 composite, a high-strength interfacial layer composed of TiCx and a Cu–Al solid solution forms between the matrix and reinforcement.Reference Zhang, Wang and Zhou20 Thus, a notable improvement in yield strength is achieved by an effective load transfer through this strong interfacial layer. When the synthesis temperature increases to 1000 °C, Ti3AlC2 completely decomposes into TiCx. A Cu matrix composite reinforced by in situ formed TiCx is obtainedReference Zhang and Zhou11 and this composite possesses higher mechanical properties than that of Cu/Ti3AlC2 composite, as summarized in Fig. 13(a). This example shows that by controlling the reaction between Ti3AlC2 and Cu matrix, the interfacial structure and the resultant properties of the composite can be improved. In Cu/Zr2Al3C4, Cu/TiB2, and Cu/SiC composites, reinforcements are mechanically bonded by Cu matrix. Under tensile tests, the applied load cannot be effectively transferred from matrix to reinforcement. Consequently, the strengthening effect is very limited.
(a) Yield strength of Cu matrix composites reinforced by in situ TiCx,Reference Zhang and Zhou11 Ti3AlC2,Reference Zhang and Zhou11 Zr2Al3C4,Reference Zhang, He and Zhou19 TiB2,Reference Tjong and Lau6 and SiCReference Tjong and Lau3 particles, (b) electrical resistivity of in situ Cu/TiCx,Reference Zhang and Zhou11 Cu/Ti3AlC2,Reference Zhang and Zhou11 Cu/Zr2Al3C4,Reference Zhang, He and Zhou19 and Cu/graphiteReference Kováčik and Bielek51 composites.

As a member of layered ternary carbides, Zr2Al3C4 exhibits a crystal structure similar to that of Ti3AlC2. The microstructure evolution of Zr2Al3C4 in Cu at high temperatures is systematically studied in this work. However, no high-strength interfaces can be formed in the whole temperature range, which is attributed to the different bonding characteristics in Zr2Al3C4 compared to Ti3AlC2. The crystal structure of Ti3AlC2 can be described as the intergrowth of Ti–C slabs and planar-packed Al atoms.Reference Zhou, Wang, Sun and Chen48, Reference Music and Schneider49 Recently, first-principle calculation has demonstrated that Ti2AlC (another member of Ti–Al–C system besides Ti3AlC2) presents an unusual Al-vacancy-bearing capability to form substoichiometry down to Ti2Al0.5C.Reference Wang, Zhou, Liao, Zhang and Lin50 Experiments showed that the Ti3AlC2 grains maintain its symmetry and structure with partial depletion of Al from the ternary carbide.Reference Zhang, Wang and Zhou20 When Zr2Al3C4 reacts with Cu, both Al and C atoms deplete from the ternary carbide. The loss of an entire Al–C unit leads to collapse of the crystal structure even at a relatively low temperature, for example, 950 °C. When the temperature increases, all Zr2Al3C4 converts into ZrC0.54 with a volume shrinkage of 52.5% and aligned voids form inside ZrC grains.
Although no high-strength interfacial layer forms during the reaction between Zr2Al3C4 and Cu, the relatively clean interface promotes the formation of continuous Cu network in Cu/Zr2Al3C4 composite. Once the high conducting Cu network is spanning across the whole composite, ceramic particles remain as isolated clusters and the electrical resistivity approaches to the value of pure Cu. Experimentally, the electrical resistivity of Cu/Zr2Al3C4 composite is significantly lower than that of in situ Cu/TiCx and Cu/Ti3AlC2 composites, but comparable to that of Cu/graphite composites,Reference Zhang, He and Zhou19, Reference Kováčik and Bielek51, Reference Yeoh, Persad and Eliezer52 as indicated in Fig. 13(b). In Cu/Ti3AlC2 composites, the formation of a high-strength interfacial layer enables the load transfer and damages the Cu network in the composite. For in situ Cu/TiCx composites, alternating distribution of Cu and TiC laminas destroy the continuous Cu network; the solid solution of Al in Cu matrix also increases the electrical resistivity. Therefore, at the same reinforcement content the electrical resistivity of the Cu/Ti3AlC2 composite is two to three times that of the Cu/Zr2Al3C4 composite.
In terms of the microstructure-property relationship of Cu matrix composites reinforced by ceramic particles, the optimization of interfacial structure should be considered a tradeoff: the formation of a high-strength interfacial layer enables the load transfer in the composite and leads to notable improvement in mechanical behaviors, but this interfacial layer damages the continuous Cu network and results in the increase of electrical resistivity. To effectively transfer the load, a continuous and strong interface is required; to maintain the continuous Cu network, a discontinuous and moderate bonded interface is favored. Thus, an ideal interface in a metal matrix composite should facilitate wetting and bonding between the reinforcement and matrix to a desirable degree, which promotes load transfer as well as maintains the physical continuity in the composite.
In Cu matrix, the microstructure stability of layered ternary carbides, Ti3AlC2 and Zr2Al3C4 for instance, varies significantly. There are more than 100 members in layered ternary carbidesReference Wang and Zhou14, Reference Music and Schneider49; therefore, the microstructure of Cu matrix composites reinforced by layered ternary carbides is more flexible compared to the composites containing traditional ceramics such as Al2O3 and TiB2. With the understanding of the reaction thermodynamics and kinetics, the optimum properties can be achieved, enabling practical applications particle-reinforced Cu matrix composites.
V. CONCLUSIONS
In this work, microstructure evolution of Zr2Al3C4 in Cu is investigated by annealing the as-synthesized Cu/30 vol%Zr2Al3C4 samples in the temperature range from 850 to 1050 °C. No reaction happens below 950 °C, i.e., Cu and Zr2Al3C4 are mechanically bonded in the composite. In contact with Cu, decomposition of Zr2Al3C4 occurs above 950 °C with the depletion of Al atoms that induces the deintercalation of the entire Al–C units from Zr2Al3C4. Formation of ZrC and Cu platelets as well as a thin twinned ZrC slice inside Zr2Al3C4 grains is also observed. With the increase of temperature to 1050 °C, severe reaction happens resulting in the coexistence of highly twinned ZrC and Cu lamellae. The transformation from Zr2Al3C4 to twinned ZrC0.54 is accompanied by large volume shrinkage of ~52.5%. Consequently, aligned pores form inside ZrC grains.
Zr2Al3C4 exhibits higher stability in Cu matrix than that of Ti3AlC2 and Al4C3, due to the different atomic bonding characteristics and crystal structure. There are a considerable number of ternary carbides with layered structures similar to either Ti3AlC2 or Zr2Al3C4; the structure stability of these layered ceramics in Cu matrix varies significantly. The mechanical and electrical properties of Cu matrix composites can be optimized by controlling the interfacial reaction between the Cu matrix and ceramic reinforcements.
ACKNOWLEDGMENTS
The authors thank Dr. Jian Luo from Clemson University, Clemson, SC, for revising the manuscripts and valuable suggestions. This work was supported by the National Outstanding Young Scientist Foundation for Y.C. Zhou under Grant No. 59925208, and Natural Sciences Foundation of China under Grant Nos. 90404027, 50772114, and 50832008.