1. INTRODUCTION
On an informal level, configuration can be defined as a special case of design activity, where the artifact being configured is assembled from instances of a fixed set of well-defined component types which can be composed conforming to a set of constraints (Sabin & Weigel, Reference Sabin and Weigel1998). Configuration systems typically exploit two different types of knowledge sources: the explicit knowledge about the user requirements and deep configuration knowledge about the underlying product. Configuration knowledge is represented in the form of a product structure and different types of constraints (Felfernig et al., Reference Felfernig, Friedrich, Jannach, Stumptner and Zanker2003) such as compatibility constraints (which component types can or cannot be combined with each other), requirements constraints (how user requirements are related to the underlying product properties), or resource constraints (how many and which components have to be provided such that needed and provided resources are balanced).
Interacting with a knowledge-based configurator typically means to specify a set of requirements, to adapt inconsistent requirements, and to evaluate alternative configurations (solutions). In this paper we focus on a situation where the configurator is not able to find a solution. In such a situation it is very difficult for users to find a set of changes to the specified set of requirements such that a configuration can be found (Felfernig et al., Reference Felfernig, Friedrich, Jannach and Stumptner2004). In order to better support users, we introduce PersDiag, which is an algorithm for the personalized diagnosis of inconsistent user requirements. PersDiag improves the performance of diagnosis calculation and the precision of diagnosis predictions.
State-of-the-art approaches to the determination of minimal diagnoses for inconsistent user requirements are focusing on minimal-cardinality diagnoses (Felfernig et al., Reference Felfernig, Friedrich, Jannach and Stumptner2004) or on the precalculation of all possible diagnoses (McSherry, Reference McSherry2004). In the context of recommender systems (Burke, Reference Burke2000; Felfernig et al., Reference Felfernig, Friedrich and Schmidt-Thieme2007), the complement of such a diagnosis is often denoted as maximally successful subquery (Godfrey, Reference Godfrey1997; McSherry, Reference McSherry2004, Reference McSherry2005). Such a query consists of those elements that are not part of a corresponding minimal diagnosis. In the context of constraint-based systems (Tsang, Reference Tsang1993) diagnoses are also interpreted as a specific type of explanation (O'Sullivan et al., Reference O'Sullivan, Papdopoulos, Faltings and Pu2007).
Especially in interactive settings the calculation of all possible diagnoses is infeasible due unacceptable runtimes (Felfernig et al., Reference Felfernig, Friedrich, Schubert, Mandl, Mairitsch and Teppan2009). Furthermore, it cannot be guaranteed that minimal-cardinality diagnoses lead the most interesting explanations for a user (O'Sullivan et al., Reference O'Sullivan, Papdopoulos, Faltings and Pu2007; Felfernig et al., Reference Felfernig, Friedrich, Schubert, Mandl, Mairitsch and Teppan2009). The work of (O'Sullivan et al., Reference O'Sullivan, Papdopoulos, Faltings and Pu2007) is a first step toward the tailoring of the presented set of diagnoses in the sense that so-called representative explanations are determined. These explanations fulfill the criteria that each element part of a diagnosis is also contained in at least one of the diagnoses presented to the user. The work presented in Felfernig et al. (Reference Felfernig, Friedrich, Schubert, Mandl, Mairitsch and Teppan2009) takes one further step toward this direction by introducing personalization concepts that allow to determine personalized repair actions for inconsistent requirements in knowledge-based recommendation (Burke, Reference Burke2000) where, in contrast to knowledge-based configuration scenarios, a fixed and predefined set of candidate products exists.
On the basis of related work in the field, we introduce a new algorithm for the personalized diagnosis of inconsistent user requirements that is especially tailored to knowledge-based configuration scenarios. The algorithm (PersDiag) performs a best-first search for diagnoses acceptable for the user where the decision on which nodes to expand during search is based on criteria often used in recommender systems development (Felfernig et al., Reference Felfernig, Friedrich and Schmidt-Thieme2007). The major contribution of this paper is to show how standard model-based diagnosis (MBD) approaches (Reiter, Reference Reiter1987; DeKleer et al., Reference DeKleer, Mackworth and Reiter1992) can be extended with intelligent personalization concepts that improve the prediction quality of diagnosis selection and reduce the diagnosis calculation time when searching for the topmost-n relevant diagnoses.
The remainder of this paper is organized as follows. In Section 2 we introduce a working example that will be used for illustration purposes throughout the paper. In Section 3 we discuss a basic approach to identify inconsistent user requirements (Felfernig et al., Reference Felfernig, Friedrich, Jannach and Stumptner2004) that is based on the concepts of MBD (Reiter, Reference Reiter1987; DeKleer et al., Reference DeKleer, Mackworth and Reiter1992). In Section 4 we present an algorithm (PersDiag) for the personalized identification of minimal sets of inconsistent user requirements. The results of empirical and performance evaluations are presented in Section 5. In Section 6, we discuss related and future work. We conclude the paper with Section 7.
2. WORKING EXAMPLE: COMPUTER CONFIGURATION
We will use computer configuration as a working example throughout this paper. The task of identifying a configuration for a given set of user requirements can be defined as follows (see Definition 1). This definition is based on the definition given in Felfernig et al. (Reference Felfernig, Friedrich, Jannach and Stumptner2004) and, in contrast to the component-port based representation of a configuration problem (Felfernig et al., Reference Felfernig, Friedrich, Jannach and Stumptner2004), it relies on the definition of a constraint satisfaction problem (CSP; Tsang, Reference Tsang1993).
Definition 1 (configuration task)
A configuration task can be defined as a CSP (V, D, C), where V = {v 1, v 2, … , vn} is a set of finite domain variables and D = {dom(v 1), dom(v 2), … , dom(vn)} represents the domain of each variable vi. Here, C = C KB ∪ C R is a set of all constraints, which can be divided into the configuration knowledge base (KB) C KB = {c 1, c 2, … , cm} and the set of specific user requirements (R) C R = {cm +1, cm +2, … , cp}.■
A simple example for a configuration task (V, D, C) is V = { cpu, graphic, ram, motherboard, harddisk, price}, where cpu is the type of central processing unit, graphic represents the graphics card, ram represents the main memory specified in gigabytes, motherboard represents the type of motherboard, harddisk is the harddisk capacity in gigabytes, and price represents the overall price of the computer. These variables fully describe the potential set of requirements that can be specified by the user. The respective variable domains are D = {dom(cpu) = {CPUA, CPUB}, dom(graphic) = {GCA, GCB, GCC, GCD}, dom(ram) = {1, 2, 3, 4}, dom(motherboard) = {MBX, MBY, MBZ, MBW}, dom(harddisk) = {200..700}, dom(price) = {300..600}}. Note that for reasons of simplicity we do not explicitly discuss pricing constraints; the reader can assume that for each relevant variable value there is a corresponding specified price and that there is a set of constraints responsible for calculating the overall price of the configuration. The set of possible combinations of variable instantiations is restricted by the constraints in the configuration knowledge base C KB = {c 1, c 2, c 3, c 4, c 5, c 6}. In our working example these are simplified technical and sales constraints:
• c 1: cpu = CPUA ⇒ graphic ≠ GCA
• c 2: cpu = CPUB ⇒ ram > 1
• c 3: motherboard = MBY ⇒ ram > 1
• c 4: harddisk = 700 ⇒ motherboard = MBW
• c 5: motherboard = MBX ⇒ graphic = GCB ∨ graphic = GCD
• c 6: motherboard = MBX ⇒ ram = 1 ∨ cpu ≠ CPUA
For the purposes of our simple example, we assume that the following requirements have been specified by the user (C R = {c 7, c 8, c 9, c 10, c 11, c 12}):
• c 7: cpu = CPUA
• c 8: graphic = GCA
• c 9: ram ≥ 2
• c 10: motherboard = MBX
• c 11: price ≤ 350
• c 12: harddisk ≥ 200
Based on this example of a configuration task, we can introduce a definition of a concrete configuration, that is, a solution for a configuration task.
Definition 2 (configuration)
A configuration for a given configuration task (V, D, C) is an instantiation I = {v 1 = i 1, v 2 = i 2, … , vn = in} of each variable vj where ij ∈ dom(vj). A configuration is consistent if the assignments in I are consistent with the constraints in C. Furthermore, a configuration is complete if all the variables in V are instantiated. Finally, a configuration is valid, if it is both consistent and complete.■
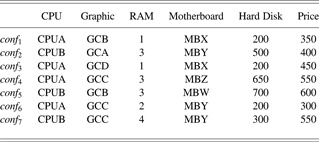
In our working example, we assume that users already interacted with the computer configurator and created several configurations (CONFIGS = {conf 1, conf 2, conf 3, conf 4, conf 5, conf 6, conf 7}). These configurations are stored in a corresponding table (see Table 1). We will exploit this information for the determination of personalized diagnoses in Section 4.
User interaction data from configuration sessions (configuration log)

3. CALCULATING MINIMAL CARDINALITY DIAGNOSES
For the example configuration task specified in Section 2 we are not able to find a valid solution, for example, the processor type CPUA is incompatible with the graphic card GCA (a simple sales constraint). Therefore, we want to identify the minimal set of requirements (ci ∈ C R) that have to be relaxed in order to find a solution. For identifying such minimal sets, we exploit the concepts of MBD (Reiter, Reference Reiter1987; DeKleer et al., Reference DeKleer, Mackworth and Reiter1992). MBD starts with a system description, which in our case encompasses the configuration knowledge base C KB that describes the set of possible product configurations. If the actual behavior of the system conflicts with its intended behavior (a corresponding configuration can be identified), the task of a diagnosis component is to determine those elements (in our case the elements are requirements in C R) which, when assumed to be functioning abnormally, sufficiently explain the discrepancy between the actual and the intended behavior of the system. A diagnosis is a minimal set of faulty components (in our case requirements) that need to be relaxed in order to be able to identify a configuration.
On a more technical level, minimal diagnoses for faulty user requirements can be identified as follows. Let us assume the existence of a set C KB = {c 1, c 2, … , cm} of configuration constraints and a set C R = {cm +1, cm +2, … , cp} of user requirements (represented as constraints) inconsistent with C KB, that is, no solution can be found for the constraints in C R ∪ C KB. In such a situation, state-of-the-art configurators (Sinz & Haag, Reference Sinz and Haag2007) calculate a set of minimal diagnoses DIAGS = {diag 1, diag 2, … , diagk}, where ∀diagi ∈ DIAGS : C KB ∪ (C R − diagi) is consistent. A corresponding User Requirements Diagnosis Problem (UR Diagnosis Problem) can be defined as follows:
Definition 3 (UR diagnosis problem)
A UR diagnosis problem is defined as a tuple (C KB, C R) where C KB represents the constraints of the configuration knowledge base and C R is a set of user requirements.■
Based on the definition of the UR diagnosis problem, a UR diagnosis can be defined as follows:
Definition 4 (UR diagnosis)
A UR diagnosis for (C KB, C R) is a set of constraints diag ⊆ C R such that C KB ∪ (C R − diag) is consistent. A diagnosis diag is minimal if there does not exist a diagnosis diag′ ⊂ diag such that C KB ∪ (C R − diag′) is consistent.■
Following the basic principles of MBD (Reiter, Reference Reiter1987; DeKleer et al., Reference DeKleer, Mackworth and Reiter1992), the calculation of diagnoses is based on the identification and resolution of conflict sets. A conflict set in the user requirements C R can be defined as follows:
Definition 5 (conflict set)
A conflict set is defined as a subset CS ⊆ C R such that CS ∪ C KB is inconsistent. CS is minimal if and only if there does not exist a conflict set CS′ with CS′ ⊂ CS.■
In our simple working example, the user requirements C R = {c7, … , c 12} are inconsistent with the constraints in the configuration knowledge base C KB = {c 1, … , c 6}, that is, there does not exist a configuration (solution) that completely fulfills the requirements in CR. The minimal conflict sets are CS1 = {c 7, c 8}, CS2 = {c 8, c 10}, and CS3 = {c 7, c 9, c 10}, because each of these conflict sets is inconsistent with the configuration knowledge base and there do not exist conflict sets CS1′, CS2′, and CS3′ with CS1′ ⊂ CS1, CS2′ ⊂CS 2, and CS3′ ⊂CS 3.
In MBD (Reiter, Reference Reiter1987; DeKleer et al., Reference DeKleer, Mackworth and Reiter1992) the standard algorithm for determining minimal diagnoses is the hitting set-directed acyclic graph (HSDAG) as described in Reiter (Reference Reiter1987). User requirements diagnoses diagi ∈ DIAGS can be calculated by resolving conflicts in the set of requirements C R. Because of its minimality property, one conflict can be resolved by deleting exactly one of the elements from the conflict set. After deleting at least one element from each identified conflict set we are able to present a diagnosis. The HSDAG algorithm employs breadth-first search where the resolution of all minimal conflict sets leads to the identification of all minimal diagnoses. In our working example the diagnoses derived from the conflict sets CS1, CS2, and CS3 are DIAGS = {{c 7, c 8}, {c 7, c 10}, {c 8, c 9}, {c 8, c 10}}.
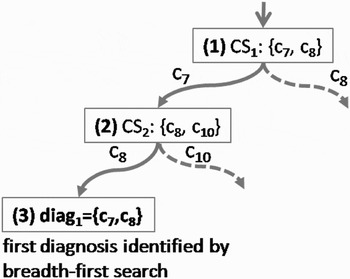
The construction of such a HSDAG is exemplified in Figure 1. The HSDAG algorithm assumes the existence of a component that is able to detect minimal conflict sets. Our implementation is based on a version of the QuickXPlain conflict detection algorithm introduced by Junker (Reference Junker2004). Following a breadth-first search regime with the goal of identifying a minimal diagnosis, we have to resolve the conflict set CS1 by checking whether c 7 or c 8 already represent a diagnosis. Both alternatives to resolve the conflict do not lead to a diagnosis since (C R − {c 7}) ∪ C KB as well as (C R − {c 8}) ∪ C KB are still inconsistent. We now can switch to the next level of the search tree because breadth-first search inspects all nodes at level n of the search tree first and then extends the search to level n + 1. Let us assume that the next conflict set returned by QuickXPlain is CS2 = {c 8, c 10}. Now, (C R − ({c 7} ∪ {c 8})) ∪ C KB does not trigger further conflicts, which means that diag1 = {c 7, c 8} has been identified as the first minimal cardinality diagnosis. Further details on the standard HSDAG algorithm can be found in Reiter (Reference Reiter1987).
Hitting set directed acyclic graph (Reiter, Reference Reiter1987) for the working example. The first identified diagnosis is diag 1 = {c 7, c 8}. The algorithm returns minimal diagnoses with increasing cardinality, that is, diag 1 = {c 7, c 8} is a minimal cardinality diagnosis. The complete set of minimal diagnoses is DIAGS = {{c 7, c 8}, {c 7, c 10}, {c 8, c 9}, {c 8, c 10}}.

A major question to be answered is whether minimal cardinality diagnoses are leading to configurations of relevance, that is, have a high probability of being selected by the user. We will provide answers in the following sections.
4. CALCULATING PERSONALIZED DIAGNOSES
As the number of possible diagnoses can become large, and presenting such a large number of alternatives to the user is inappropriate, we want to systematically reduce the number of alternatives with the goal to identify relevant diagnoses for the user and keep the diagnosis evaluation process as simple as possible. A simple heuristic to identify such diagnoses has already been presented in Section 3, where diagnoses have been ranked to conform to their cardinality; in our working example {c 7, c 8} has been identified as first minimal cardinality diagnosis. An alternative to this breadth-first search-based approach is to exploit recommendation techniques (Felfernig et al., Reference Felfernig, Friedrich and Schmidt-Thieme2007) for the identification of relevant diagnoses, that is, diagnoses that have a higher probability of being accepted by the user. In the following we will show how basic recommendation approaches can be exploited for the prediction of diagnoses that are relevant to the user. First, we will show how we can determine diagnoses leading to configurations that are similar to the original set of user requirements (similarity-based diagnosis selection). Second, we will introduce a utility-based approach that uses preference data for guiding the HSDAG construction (utility-based diagnosis selection).
4.1. Similarity-based diagnosis selection
The idea of similarity-based diagnosis selection is to prefer those minimal diagnoses that lead to configurations resembling the original user requirements. In order to derive such diagnoses, we can exploit information contained in already existing configurations (see, e.g., the configuration log in Table 1). For each entry in Table 1 we can calculate its similarity with the user requirements in C R. The similarity values of our working example calculated on the basis of Eq. (4), simrec(C R, conf k), k = 1..7, are conf 1 = 0.45, conf 2 = 0.60, conf 3 = 0.43, conf 4 = 0.25, conf 5 = 0.30, conf 6 = 0.36, conf 7 = 0.14. These values are calculated on the basis of the entries in Table 1 and the preferences of our example user, which are the importance values w(ci): c 7 = 0.08 (8%), c 8 = 0.34 (34%), c 9 = 0.08 (8%), c 10 = 0.17 (17%), c 11 = 0.08 (8%), c 12 = 0.25 (25%).Footnote 1
The calculation of similarity values is based on three attribute-level similarity measures (Konstan et al., Reference Konstan, Miller, Maltz, Herlocker, Gordon and Riedl1997; Wilson & Martinez, Reference Wilson and Martinez1997; McSherry, Reference McSherry2004). These measures calculate the similarity of a pair of attribute (a i) of configuration confk and the corresponding user requirement (ci), for example, the similarity between attribute ram of configuration conf 1 and the user requirement c 9 (ram ≥ 2) is 0.33, where we take the lower bound ram = 2 as basis for similarity calculation. Depending on the characteristics of the attribute, one of the three measures [Eqs. (1)–(3)] is chosen: More-Is-Better (MIB), Less-Is-Better (LIB) or Nearer-Is-Better (NIB; McSherry, Reference McSherry2004).
For attributes like harddisk size or the ram size, the higher the value the better it is for the user (MIB). For attributes like price, the lower the value the more satisfied the user is (LIB). When the user specifies a certain type of CPU (no intrinsic value scale), we suppose the most similar is the preferred one. In those cases, the NIB similarity measure is used.Footnote 2



On the basis of the individual similarity values, Eq. (4) calculates the overall similarity value between the sequence of user requirements (c) and the sequence of attribute values of configuration a. In this context w(c i) denotes the importance of requirement c i for our example user. The importance values can be directly specified by the user or derived by a learning algorithm, for example, a genetic algorithm.

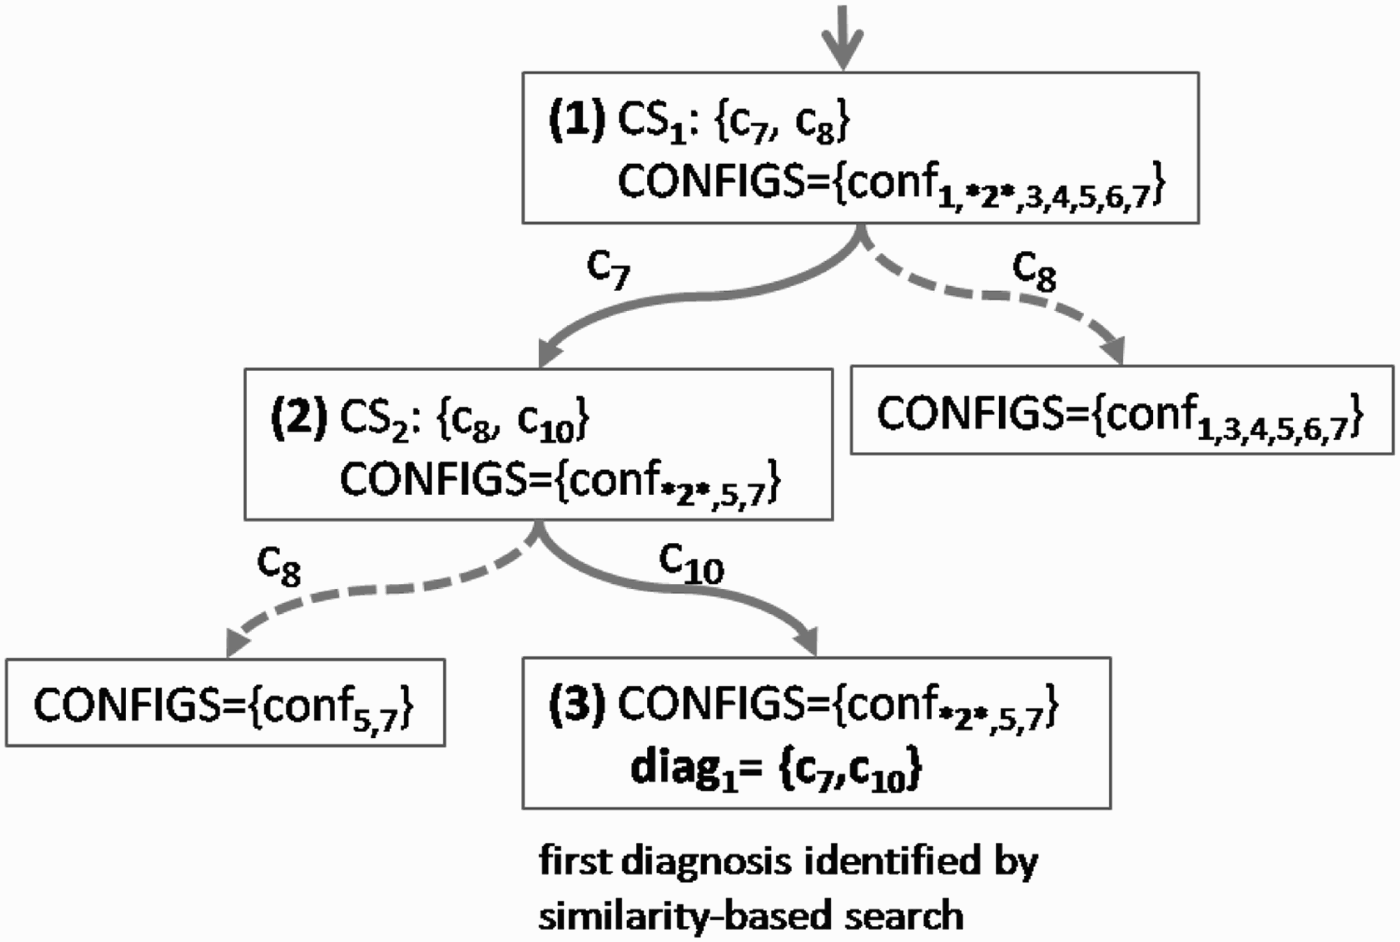
The similarity values provided above will now be exploited for determining diagnoses in a personalized fashion (see Fig. 2).
Similarity-based selection of diagnoses with PersDiag.
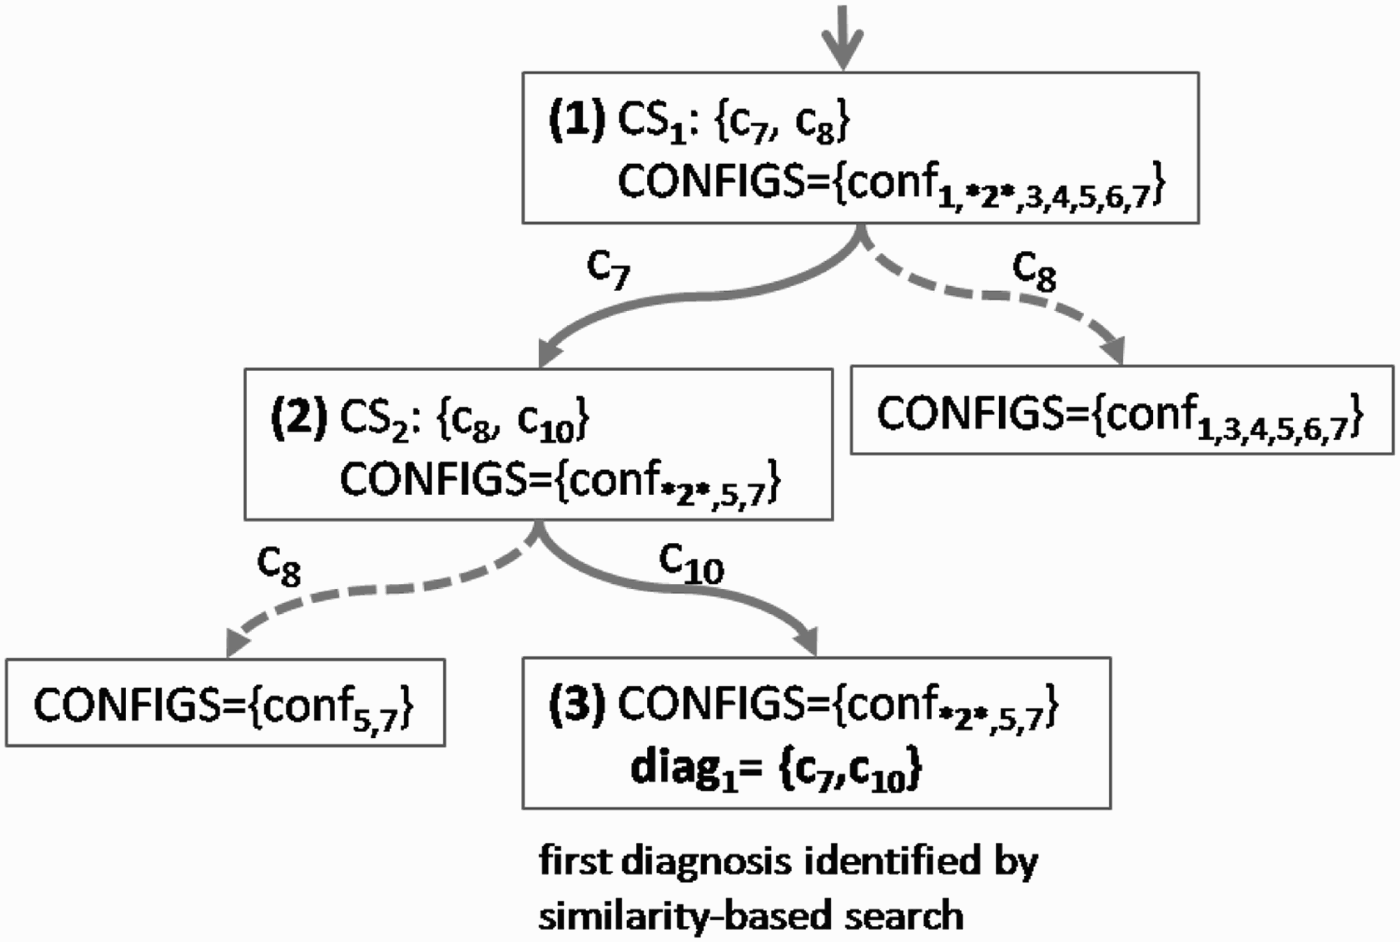
For the similarity-based selection of diagnoses we again assume that the QuickXPlain algorithm (Junker, Reference Junker2004) returns as first conflict set CS1 = {c 7, c 8}. Now there are two possibilities of resolving CS1. If we delete c 7 from CS1, the following configurations CONFIGS = {conf 2, conf 5, conf 7} are consistent with c 7. This means that each of the configurations in CONFIGS is inconsistent with the requirement c 7 and thus a potential candidate configuration for supporting diagnoses that include c 7. If we delete c 8 from CS1, then CONFIGS = {conf 1, conf 3, conf 4, conf 5, conf 6, conf 7}. The configuration with the highest similarity compared to the original set of requirements C R = {c 7, … , c 12} is conf 2 contained in node (2) of Figure 2. Consequently, node (2) of the HSDAG is further expanded, which results in the next conflict set CS2 = {c 8, c 10}, because C KB ∪ (C R − {c 7}) is still inconsistent. With this expansion we have identified two alternative diagnoses, namely, {c 7, c 8} and {c 7, c 10}. The diagnosis {c 7, c 10} will be rated higher because it is consistent with the configuration conf 2, the configuration with the highest similarity to the set of requirements, that is, conf 2 ∪ C KB ∪ (C R − {c 7, c 10}) is consistent. Note that in many configuration scenarios there exists a ramp-up problem (Burke, Reference Burke2000) because initially no configuration data are available. An approach to deal with this situation is to define a threshold value that specifies an upper similarity limit for configurations to be accepted as similar to the original set of requirements. If no such configuration exists, a fallback solution is to present diagnoses resulting from breadth-first search or to apply the criteria presented in the following.
4.2. Utility-based diagnosis selection
The idea of utility-based diagnosis selection is to prefer those minimal diagnoses, which include requirements of low importance for the user. Following a utility-based approach (Winterfeldt & Edwards, Reference Winterfeldt and Edwards1986) we are summing up the individual importance values (see above) of the requirements part of a diagnosis in order to generate a corresponding ranking. The function utility(C ⊆ C R) returns a utility score for a specific set C that is a subset of the user requirements C R [see Eq. (5)].

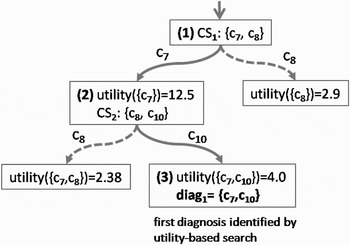
For the utility-based selection of diagnoses we again assume that QuickXPlain returns as first conflict set CS1 = {c 7, c 8} (see Fig. 3). The importance value for c 7 is 0.08, whereas the importance value for requirement c 8 is 0.34 (see above). By applying Eq. (5) we derive the corresponding utility values, for example, utility({c 7}) = 1/0.08 = 12.5 and utility({c 8}) = 1/0.34 = 2.9. Because resolving the conflict set {c 7, c 8} by deleting c 7 has a higher utility [application of Eq. (5)], the search for a diagnosis is continued with C R − c 7, which results in the second conflict set returned by QuickXPlain (CS2 = {c 8, c 10}). Again, we sort the utility values for all nodes in the fringe of the search tree and come to the conclusion that extending the path {c 7, c 10} is the best choice (utility({c 7, c 10}) = 4.0). Because (C R − {c 7, c 10} ∪ C KB) is consistent, diag 1 = {c 7, c 10} is the first diagnosis identified (in this case the result is the same as the one determined by the similarity-based approach).
Utility-based selection of diagnoses with PersDiag.

4.3. Algorithm for calculating personalized diagnoses
The algorithm for calculating best-first minimal diagnoses for inconsistent user requirements is the following (Algorithm 1, PersDiag). We keep the description of the algorithm on a level of detail, which has been used in the description of the HSDAG algorithm (Reiter, Reference Reiter1987). In PersDiag, the different paths of the HSDAG are represented as separate elements in a collection structure H that is initially empty. H stores all paths of the search tree in a best-first fashion, where the currently best path (h) is the one with the most promising (partial) diagnosis. If the theorem prover (TP) call TP((C R − h) ∪ C KB) does not detect any further conflicts for the elements in h (isEmpty(CS)), a diagnosis is returned. The major role of the TP is to check whether there exists a configuration for C R, disregarding the already resolved conflict set elements in h. If the theorem prover call TP((C R − h) ∪ C KB) returns a nonempty conflict set CS, h is expanded to the paths containing exactly one element of CS each. In case that h is expanded, the original h must of course be removed from H (delete(h, H)). Afterward, the new elements have to be inserted into H. This collection (H) is then finally sorted (sort(H, k)) according to the criteria defined in k.Footnote 3 In this context, k represents the criteria used for selecting the next node to be expanded in the search tree that could be breadth-first, similarity-based, or utility-based.
Algorithm 1
PersDiag(C R, C KB, H, k)
{C R: set of user requirements}
{C KB: the configuration knowledge base}
{H: collection of all paths in the search tree (initially empty)}
{k: node evaluation criteria used by sort(H, k)}
{h: diagnosis returned}
h ← first(H)
CS ← TP((C R− h) ∪ C KB)
ifisEmpty(CS) then
return h
else
for allX in CS do
H ← H ∪ {h ∪ {X}}
end for
H ← delete(h, H)
H ← sort(H, k)
PersDiag(C R, C KB, H, k)
end if
5. EVALUATION
5.1. Evaluation of prediction quality
To demonstrate the improvements achieved by our approach, we conducted an empirical study. Configuration data were gathered on the basis of an online user study conducted at the Graz University of Technology with 415 participants (82.4% male, 17.6% female) conform to the basic structure of Table 1. Each participant had to define his/her requirements [including the corresponding importance values—see Eq. (4)] regarding a predefined set of 12 computer attributes (price, type of central processing unit, operating system, operating system language, amount of main memory, screen size, harddisk capacity, type of DVD drive, Web cam, type of graphic card, amount of graphic card memory, and type of service). After this requirements specification phase participants were informed about the fact that for the specified set of requirements no solution could be found (the goal was to confront each participant with such a situation). The system then presented a list of a maximum of 50 alternative configurations (only those repair configurations inconsistent with the current set of requirements) that have been calculated by a computer configuration knowledge base built for the product set offered by a commercial website.Footnote 4 The ordering of the configurations in this list was randomized and the participants were enabled to navigate in the list and to order the configurations regarding different criteria such as the price (LIB), the size of the hard disk (MIB), or the number of fulfilled requirements (MIB). The participants then had the task to select one out of the presented repair configurations that appeared to be the most acceptable one for them.
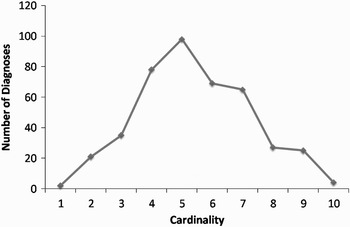
Based on the data collected in the user study we evaluated the three presented approaches with respect to their capability of predicting diagnoses that are acceptable for the user. The first approach is based on the algorithm proposed by Reiter (Reference Reiter1987), where diagnoses are ranked according their cardinality and diagnoses of the same cardinality are ranked according to their calculation order (see Section 3). The second approach identifies personalized diagnoses on the basis of a similarity-based node expansion strategy in HSDAG construction (see Section 4). The third approach uses a utility measure to find relevant diagnoses for the user (see Section 4). Because of the fact that no solution was made available for the original set of requirements, for each such set of requirements we could determine conflicts and a set of corresponding diagnoses that indicated which of the requirements had to be relaxed in order to be able to identify a solution (conflicts were induced by excluding those configurations from the set of possible configurations that are consistent with a given set of requirements). Figure 4 depicts the distribution of diagnoses with respect to their cardinality. Most of the diagnoses contained about five elements (diagnoses of cardinality 5), the average number of diagnoses per set of user requirements was 5.32.
Overall distribution of diagnoses in empirical study; average number of diagnoses per set of user requirements = 5.32 (SD = 1.67).

We were then interested in the prediction accuracy of the three different diagnosis approaches (cardinality based, similarity based, and utility based). First, we analyzed the distance between the predicted position of diagnoses leading to a selected repair proposal and their expected position (which is 1). We measured this distance in terms of the root mean square deviation [RMSD; see Eq. (6)], where predicted position is the ranking determined by the diagnosis approach and expected position is 1; that is, it is expected that the algorithm correctly predicts the diagnosis. The utility-based diagnosis approach has the lowest RMSD, which is 0.97. The similarity-based approach shows a similar RMSD value (1.03), and the cardinality-based approach shows the worst performance (RMSD = 1.64).

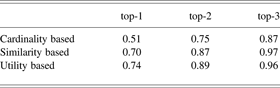
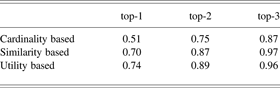
Although RMSD is a good-quality estimate, it provides only limited information about the precision of the prediction. Therefore, we analyzed the precision of the three diagnosis approaches; the precision measure is shown in Eq. (7). The basic idea is to provide a measure on how often a diagnosis that leads to the repair configuration selected by the participant is among the top-n ranked diagnoses. As can be seen in Table 2, the utility-based approach has the highest prediction accuracy in terms of precision, followed by the similarity-based diagnosis approach. The cardinality-based approach has the worst performance in terms of prediction accuracy. We were interested whether we could detect a statistically significant difference between the three diagnosis approaches in terms of prediction accuracy. Therefore, we conducted a pairwise comparison between the diagnosis approaches on the basis of a Mann–Whitney U test. We could detect a significant difference between the prediction accuracy of utility-based diagnosis and cardinality-based diagnosis (p = 5.69e −9) and between similarity-based and cardinality-based diagnosis (p < 2.2e −16). There was no significant difference between utility-based and similarity-based diagnosis in terms of prediction accuracy (p = 0.5952).

Precision of the three diagnosis approaches
5.2. Performance evaluation
The PersDiag algorithm has been implemented on the basis of the standard hitting set algorithm introduced in Reiter (Reference Reiter1987). The algorithm is NP-hard in the general case (Friedrich et al., Reference Friedrich, Gottlob and Neijdl1990) but is applicable for interactive configuration settings (see the following evaluation). In our implementation, the determination of minimal conflict sets is based in QuickXPlain (Junker, Reference Junker2004). In the worst case, QuickXPlain needs O(2k × log(n/k) + 2k) consistency checks to compute one minimal conflict set of size k (given an inconsistent constraint set of cardinality n).
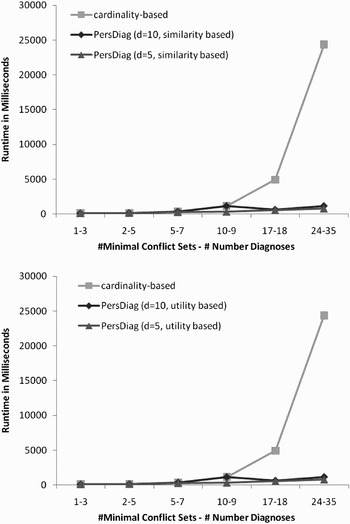
In order to be able to conduct an in-depth performance analysis, we based our evaluation on different generated settings characterized by a varying number of conflict sets (1–5 conflict sets of cardinality 1–4) and corresponding diagnoses (3–22). As configuration engine we used the constraint solver Choco (choco.emn.fr), the performance evaluation has been conducted on a standard PC (Intel Core2 Quad QD9400 2.66-GHz CPU with 2 GB of RAM). The solver had to conduct consistency checks on knowledge bases with n = 100 variables, t = 100 constraints in C KB, and q = 5..20 user requirements (C R) inconsistent with C KB (we did not optimize the knowledge bases in terms of, for example, variable selection or value selection). Based on this setting we compared the performance of the best-first based diagnosis approaches (similarity-based and utility-based) with the performance of the standard breadth-first search approach (cardinality-based) when calculating the topmost-n relevant diagnoses (for n = 5.10, see Fig. 5). Best-first based diagnosis clearly outperforms the breadth-first one because the latter has to determine all diagnoses to be able to achieve a comparable prediction quality.
The performance of the cardinality-based (breadth-first) diagnosis approach compared to personalized approaches for the topmost-n relevant diagnoses for typical combinations of #conflict sets and #diagnoses (Felfernig et al., Reference Felfernig, Friedrich, Jannach and Stumptner2004). Personalized approaches are significantly more efficient (compared to the cardinality-based approach) and show similar performance among themselves.

6. RELATED AND FUTURE WORK
6.1. Knowledge-based configuration
Configuration is one of the most successful application areas of artificial intelligence (Stumptner, Reference Stumptner1997). One of the first configuration systems was R1/XCON, which has been developed by John McDermott on the basis of the OPS5 language (McDermott, Reference McDermott1982). A detailed analysis and discussion of the experiences with R1/XCON is provided in Barker et al. (Reference Barker, O'Connor and Soloway1989). In productive use, the system included ~31,000 components and ~17,500 rules. R1/XCON was a rule-based system that triggered enormous maintenance problems because of the intermingling of product domain and problem solving knowledge. Acquisition and maintenance processes for knowledge bases have been significantly improved by the development of model-based knowledge representations with a strict separation of problem solving and domain knowledge (Mittal & Frayman, Reference Mittal and Frayman1989, Reference Mittal and Falkenhainer1990). Most of today's available configuration systems are based on such a model-based approach: examples of corresponding configuration environments are SAP (Haag, Reference Haag1998), SIEMENS (Fleischanderl et al., Reference Fleischanderl, Friedrich, Haselboeck, Schreiner and Stumptner1998), and TACTON (Orsvarn, Reference Orsvarn2005). The diagnosis concepts presented in this paper are focusing on the mentioned model-based knowledge representations and consequently provide an important contribution to the improvement of commercial systems in terms of usability.
6.2. MBD
The increasing size and complexity of configuration knowledge bases motivated the application of MBD (Reiter, Reference Reiter1987; DeKleer et al., Reference DeKleer, Mackworth and Reiter1992) for testing and debugging purposes (Felfernig et al., Reference Felfernig, Friedrich, Jannach and Stumptner2004). Similar reasons led to the application of MBD in technical domains such as hardware designs (Friedrich et al., Reference Friedrich, Stumptner and Wotawa1999) and onboard diagnosis for automotive systems (Sachenbacher et al., Reference Sachenbacher, Struss and Carlen2000). The work presented in Felfernig et al. (Reference Felfernig, Friedrich, Jannach and Stumptner2004) has a special relationship to the concepts presented in this paper: Felfernig et al. (Reference Felfernig, Friedrich, Jannach and Stumptner2004) focus on the application of MBD to the identification of faults in configuration knowledge bases where test cases are used to induce conflicts in a given configuration knowledge base. In addition, a first approach to calculate diagnoses for inconsistent user requirements is presented, which is based on breadth-first based HSDAG construction. In this paper we have shown how to apply basic recommendation algorithms (similarity based and utility based) to improve the diagnosis algorithms in terms of prediction accuracy and performance.
6.3. Conflict detection
Diagnosis calculation for inconsistent user requirements relies on minimal conflict sets. Such conflict sets can be determined, for example, on the basis of QuickXPlain (Junker, Reference Junker2004), which is a frequently applied divide and conquer algorithm. Alternative approaches to the identification of conflicts have been developed in the context of knowledge-based recommendation (Schubert et al., Reference Schubert, Felfernig and Mandl2009, Reference Schubert, Felfernig and Mandl2010). These approaches cannot be applied in knowledge-based configuration scenarios because, due to the size and complexity of the underlying products, knowledge-based configurators typically do not operate on a predefined set of products. The existence of predefined item sets is a major precondition for applying the conflict detection algorithms introduced in Schubert et al. (Reference Schubert, Felfernig and Mandl2009, Reference Schubert, Felfernig and Mandl2010).
6.4. Diagnosing inconsistent requirements
An approach to suggest personalized repair actions for inconsistent requirements in the context of knowledge-based recommendation tasks has been introduced by Felfernig et al. (Reference Felfernig, Friedrich, Schubert, Mandl, Mairitsch and Teppan2009). The underlying idea is to apply the concepts of MBD (Reiter, Reference Reiter1987; DeKleer et al., Reference DeKleer, Mackworth and Reiter1992) to determine change proposals (minimal sets of inconsistent requirements) in the case of a given predefined list of products. In O'Sullivan et al. (Reference O'Sullivan, Papdopoulos, Faltings and Pu2007) such minimal sets are denoted as minimal exclusion sets. In case-based recommendation scenarios (Godfrey, Reference Godfrey1997; McSherry, Reference McSherry2004, Reference McSherry2005) the complement of a minimal exclusion set is denoted as maximally successful subquery. The concept of representative explanations has been introduced by (O'Sullivan et al., Reference O'Sullivan, Papdopoulos, Faltings and Pu2007). Representative explanations follow the idea of generating diversity in sets of diagnoses (minimal exclusion sets). The approach does not explicitly take into account the preference structure of the current user but rather tries to determine diagnosis sets that satisfy the requirement that each element (constraint) part of at least one diagnosis is also contained in at least one of the diagnoses presented to the user. Note that the scenario presented in this paper is based on the assumption of an open configuration approach where the user is free to specify requirements and the system provides feedback in the form of explanations in the case of inconsistencies. Alternatively, configurators precalculate still possible options and dim options that cannot be selected in the current context. In such a scenario our diagnosis approach could be used for intentionally exploring trade-offs in the set of user requirements (a kind of specific exploration mode in addition to the standard mode where still valid options are predetermined).
6.5. Assumption-based truth maintenance based approaches
The notion of conflict sets used in the context of MBD (Reiter, Reference Reiter1987; DeKleer et al., Reference DeKleer, Mackworth and Reiter1992) corresponds to the notion of nogoods in assumption-based truth maintenance approaches to calculate explanations (Haag, Reference Haag1998; Sinz & Haag, Reference Sinz and Haag2007). On the basis of the conjunctive normal form of the set of nogoods we can easily determine the corresponding set of diagnoses by transforming the conjunctive normal form into a corresponding disjunctive normal form.
6.6. Future work
Future work will include the evaluation of other potential prediction techniques for user requirements diagnoses such as probability-based prediction or similarity-based prediction using local search-based learning of attribute weights. Furthermore, we are interested in developing mechanisms that support the calculation of preferred diagnoses in the case of complex requirement structures, for example, structures such as x or y should be fulfilled. We are also interested in the calculation of personalized recommendations of repair proposals for inconsistent requirements, that is, we want to extend the concepts presented in this paper with the determination of concrete change proposals (repairs related to diagnoses) for inconsistent user requirements in knowledge-based configuration scenarios.
7. CONCLUSION
In this paper we introduced an algorithm (PersDiag) for the determination of personalized diagnoses. The algorithm significantly improves the prediction quality compared to state of the art diagnosis approaches. PersDiag follows a best-first search regime and can be parametrized with different kinds of selection strategies regarding the expansion of the search tree. We have compared different expansion strategies (cardinality based, similarity based, and utility based) within the scope of an empirical study. The results of this study show the advantages of personalized diagnosis calculation compared to existing breadth-first based search in terms of prediction quality and efficiency. These results provide a solid basis for improving existing industrial applications regarding the determination of diagnoses for inconsistent requirements.
Alexander Felfernig is a Professor of applied software engineering at Graz University of Technology. Alexander is also Cofounder and Director of ConfigWorks, a company focused on the development of knowledge-based recommendation technologies. Prof. Felfernig's research focuses on intelligent methods and algorithms supporting the development and maintenance of complex knowledge bases. Furthermore, he is interested in the application of AI techniques in the software engineering context, for example, the application of decision and recommendation technologies to make software requirements engineering processes more effective. In 2009 Dr. Felfernig received the Heinz–Zemanek Award from the Austrian Computer Society for his research.
Monika Schubert is a PhD student in the group of Applied Software Engineering at Graz University of Technology. Ms. Schubert received her MS in software engineering and economy from Graz University of Technology. Her research focuses on knowledge-based systems, intelligent product configuration, MBD, and product recommendation. She is also interested in user interaction with complex knowledge bases.