“It's the economy, stupid!” is now a standard trope used to explain the outcomes of US presidential elections and favorability surveys. Originally proclaimed by the 1992 Clinton campaign headquarters to explain Bill Clinton's surprise victory over George H.W. Bush, 20 years later analysts and campaign managers now are making similar arguments about the course of the 2012 presidential election. With poll after poll also ranking the economy as a top priority for voters, politicians and pundits on both sides of the aisle are eager to seize the mantles of presidential economic success stories, like Reagan or Clinton, while attacking their opponents as being reminiscent of perceived failures such as George W. Bush, Woodrow Wilson, Herbert Hoover, or even one of the Roosevelts.
How relatively good or bad were the economic performances of our past presidents? The answer to this question remains unclear. Most presidential ranking systems cloud the issue with partisan bias, subjective judgments, or mix economics together with other aspects of presidential performance (Eland Reference Eland2009). Meanwhile, think tanks use presidential rankings to advance their policy agendas, whereas academic surveys of rank allow scholars to collectively muse over the grand sweep of history rather than produce rigorous, scientific evaluations of performance (Eland Reference Eland2009; Vedder and Gallaway Reference Vedder and Gallaway2001). As a result, no purely economic ranking that covers all of the US presidents based on objective, statistical data currently exists.Footnote 1 If economic performance matters so much for elections, then scholars should scientifically evaluate it and to ascribe responsibility where the empirical evidence is most compelling.
As a step toward resolving the economic performance puzzle, this article gathers new data from the Measuring Worth Project at the University of Illinois at Chicago, along with traditional government datasets on the economy (Officer and Williamson Reference Officer and Williamson2011).Footnote 2 Up to 220 years of indicators of those aspects of economic performance that Americans find most important are analyzed. These data were used to estimate an economic “grade point average” (GPA) of the US presidents who served from 1789 until 2009.Footnote 3 Cognizant of the “uses and abuses” of presidential rankings, this article lets the economic data speak for themselves. No historical or ethical judgments were used to adjust the findings, nor was there any attempt to advance any particular political, economic, or theoretical agenda. To further increase robustness, economic performance was triangulated on by using multiple and competing statistical measures, ranking algorithms, and time lags. In this way, much random error and latent subjective biases should cancel out allowing systematic performance to show through.
These estimates of presidential economic performance are used to test for correlations with other variables to generate hypotheses regarding the conditions for superior/inferior economic performance. The correlations suggest that above-average economic performance is enjoyed by presidents who belong to pro-business political parties, work with a Congress in which only one house is dominated by the same party as the president, serve during wartime, or were raised in middle-class environments. Interestingly, presidential intelligence and open-mindedness may count only at the extremes: the top 10 most “intellectually brilliant” or mentally “open” presidents scored on average a substantially higher economic GPA than the bottom 10, but there was no significant overall correlation. Conversely, presidents with below-average economic performance often belong to parties that are relatively pro-farmer, pro-labor, or pro-consumer; enter a homogenous federal government in which one congressional house flipped parties; or were raised in relatively lower-class environments. Finally, some low correlations are also of interest. There were no substantive correlations between presidential economic performance and pre-political career (lawyers, military men, and farmers all averaged roughly the same), birth order, historical greatness (as judged by surveys of scholars), or dark horse versus well-vetted presidents.
DO PRESIDENTS HAVE MUCH INFLUENCE ON THE ECONOMY?
At first glance, it might seem that presidents have only a minor role in determining the country's economic prosperity. After all, the United States has one of the world's most free-market economic systems, which tends to minimize the role of government. Also, Congress, not the president, controls the budget and holds primary jurisdiction over legislation. Nevertheless, every president since Washington has had congressional allies with whom he has worked to affect economic policy. Certainly, the federal government has a variety of levers by which policy makers can affect the economy. Over time, these policy levers have included taxes, trade policy, land grants and sales, service contracts, procurement programs, regulations, loans, subsidies, antitrust regimes, intellectual property, and even military action. The president has direct control over a subset of these policies. Also, the executive branch can act as a focal point or source of policy, especially when Congress is fractured, gridlocked, or disorganized. And if “animal spirits” play a causal role in national economic performance, as is argued by economists, then the president at his bully pulpit is in a prime position to affect those spirits (Akerlof and Shiller Reference Akerlof and Shiller2009; Wood, Owens, and Durham Reference Wood, Owens and Durham2005). Indeed, the president's effect on the economy can sometimes be powerful. For example, Gauti Eggertsson at the New York Federal Reserve has identified Franklin D. Roosevelt's (FDR) mere inauguration as the turning point of the Great Depression; certainly FDR's subsequent policy agenda was transformational (Eggertsson Reference Eggertsson2008; Brands Reference Brands2008). Therefore, although the executive branch may appear to have a limited role on paper, the historical record suggests that presidents can affect the economy in large ways. Certainly voters seem to think so. Economic issues have been central to almost every presidential election and appear to affect both voter turnout and choice (Evans and Pickup Reference Evans and Pickup2010; Geys Reference Geys2006; Lewis-Beck, Nadeau, and Elias Reference Lewis-Beck, Nadeau and Elias2008; Lewis-Beck and Stegmaier Reference Lewis-Beck and Stegmaier2000; Nadeau and Lewis-Beck Reference Nadeau and Lewis-Beck2001; Singer Reference Singer2011; Vavreck Reference Vavreck2009). Although most scholarly research has focused on this relationship during post-World War II elections, evidence for it has also been found across the history of American elections (Lynch Reference Lynch2002).
If presidents can affect the economy and are judged by voters, historians, and the media by economic outcomes during, or soon after, their administration, then it makes sense to develop more objective ratings of presidential economic performance.
WHICH DATA WAS USED AND WHY
Which data should be used to judge presidential economic performance? There is simply no objective answer to this question. Even experts disagree on precisely which indicators to include and how to weight these. Research has further shown that perceptions of performance and responsibility can be affected by partisanship (Tilley and Hobolt Reference Tilley and Hobolt2011; Uscinski and Simon Reference Uscinski and Simon2011). This applies not only to scope conditions, but also which data to include, weights to assign, and algorithms to use. This problem is exacerbated by the fact that, clearly, initial choices about data and weights will affect the results. For example, in one ranking exercise, the libertarian Von Mises Institute uses only government spending as a percent of total output (Vedder and Gallaway Reference Vedder and Gallaway2001). Naturally, wartime big-spenders (e.g., Lincoln, Wilson, and FDR) rank near the bottom of that list, while their successors, all peacetime budget-slashers, came in on top (e.g., A Johnson, Harding, and Truman). Conversely, we can assume that a left-leaning judge might instead select measures such as income inequality, welfare spending, or poverty levels, and wind up placing some of those same big-spender presidents among the top ranks.
To minimize partisan or ideological subjectivity, this article includes those indicators that are most often mentioned by mainstream Western economists, the media, and voters when judging US economic performance. After all, to judge American presidents using mainstream American economic values makes sense. This approach does not eliminate subjectivity, but it should remove personal political biases from the equation. It also attempts to match the ranking criteria with popular preferences. That is, it puts the American public at the judge's table, rather than some supposedly “objective” expert or group.
First, mainstream economists, policymakers, and observers generally applaud an economy that simultaneously achieves four goals:
-
• increases national wealth
-
• reduces unemployment
-
• minimizes inflation
-
• reduces the balance of payments burden
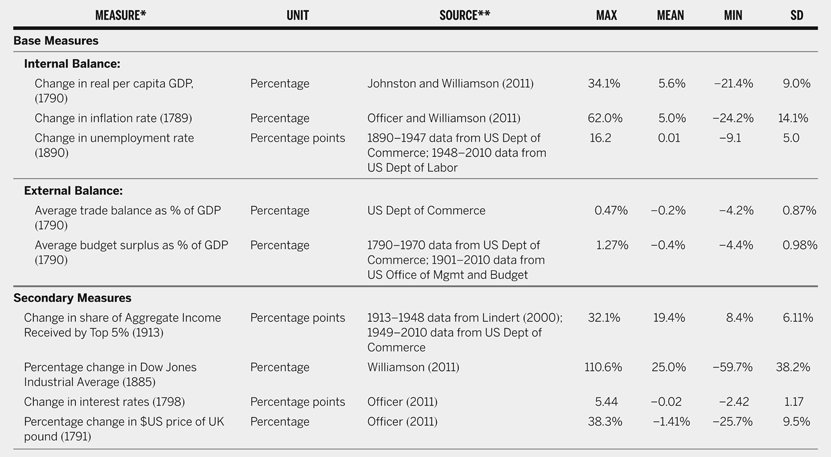
Here, this combination of indicators is used as the base measure of economic performance. To construct the rankings, four more indicators are added: reduction in economic inequality, currency strength, interest rate changes, and stock market performance. These additional indicators are included because (1) they are also generally viewed as broad measures of macroeconomic performance, (2) reliable data exist over long periods of time, and (3) they do not correlate highly with each other or with the base indicators; therefore they likely capture different aspects of economic performance. Data with these characteristics are rare. Also, critics might argue that the four base measures are insufficient data on which to base presidential rankings. Therefore, these secondary measures bring valuable scope and depth to the calculation. The description of these data and summary statistics are abstracted in table 1. Complete explanations of the data sources, coding rules, and selection criteria are available in the online appendices at www.mzak.net.
Data Description

* First year of time series indicated in parentheses.
** See appendix I for full citations.
Although every effort has been made to minimize error and subjective judgments in the economic rankings previously reported, two inherent biases are worth pointing out. First, the choices of measures and weightings do contain assumptions in favor of mainstream neoclassical, perhaps neo-Keynesian, economics as is taught in most American universities (e.g., Mankiw Reference Mankiw2011). Therefore, although measures of unemployment and income inequality are included in the rankings, the overall weightings tend to favor the achievement of wealth and efficiency over economic equity or social justice. Although it makes sense to judge American executives using mainstream American economic values, this does not make these values objectively correct. Second, all economic data suffers from statistical errors and heteroskedasticity issues that increase as these time series recede back in time. This ranking exercise is no different. Even with modern data gathering apparatus, most of the economic indicators used are difficult to calculate; indeed, historical estimates are even more fraught with statistical error.
This study addresses these weaknesses in three ways. First, the rating system used here communicates in an accurate and familiar way the “signal” contained in the economic data, while simultaneously being explicit about the “noise” and subjective judgments involved in this type of exercise. It also attempts to correct for noise and bias by using triangulation, four-year periods, multiple time lags, and competing ranking algorithms. That is, the economic data, while containing error bars, does communicate objective information about economic performance that this study isolates. Second, the aggregation of data into four-year periods helps eliminate some of the problems involved in making point estimates for individual years, as well as average out some of the random error. In those cases where change over time is measured, as long as the error is similar across each year (either random or systematic), it will tend to be subtracted out. Finally, all data are available for other scholars, using their own scoring rules, weights, and additional input measures (e.g., leadership, progress in science and technology, wealth redistribution) to construct their own rankings for comparison.
HOW THE GRADES WERE CALCULATED
Grades were assigned similarly to that of professors evaluating their students. Each student (presidential administration) is given eight assignments (the eight indicators of national wealth, inflation, employment, etc.). Performance on these assignments is graded individually using a traditional A–F (4–0 point) grading scale that is curved, as discussed later. Then, those grades are averaged into an overall GPA and class ranking. In calculating the grades and GPAs, each of the economic indicators was weighted equally and intuitively graded. The use of grades and GPAs is not intended to be cavalier, flippant, or cute. These are advantageous in several ways. First, grades constitute a ranking system that is accessible and familiar to most readers. Second, grades most explicitly and honestly reflect the strengths and weaknesses of a rating exercise such as this. As teachers, parents, and former students, most readers will recognize that, like grades received in school, the grades reported here are an approximation. Grades are never perfect measures, but they are often good indicators of performance.
To provide a pragmatic and credible ranking of the presidents, several techniques drive down random error and systematic bias. For example, because there is no consensus as to precisely when a new president becomes responsible for the economy, the GPAs were calculated separately for honeymoon periods of zero, one, and two years. Also, two competing grade curves were used. The first algorithm used strict quintiles: the top 20% of performers received an “A” (4 points), the second 20% received a “B” (3 points), and so forth. The second algorithm imposed a bell-curve. Specifically a “C” (2 points) was awarded to all scores within one standard deviation of the mean, centered on the mean. For the next half standard deviation, a “B” or “D” was awarded as appropriate; for the remaining administrations, an “A” or “F” was awarded accordingly. This method rewards or punishes extremes in performance to better identify truly great or poor executives while expanding the number of administrations considered to be merely average. After the individual indicators were graded, these were combined via a simple average into an overall grade for each administration or president.
The final GPA calculation brought together all of the above grades to produce tables 2 and 3. For each president, each final “strict quintile” and “bell-curve” GPA for each honeymoon period was averaged together and a final GPA assigned. Thus, to earn a 3.00 or higher, a president or administration had to consistently score well, regardless of honeymoon period or grading algorithm (e.g., FDR consistently got As throughout each different scoring approach). Likewise, to earn a GPA below 1.00, a president or administration had to consistently and robustly perform poorly.
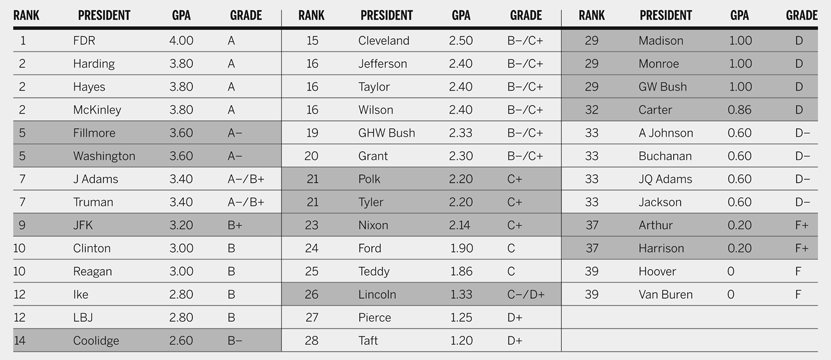
Economic Grades and Rankings of the Presidents

Notes: Average GPA = 2.04, Standard Deviation = 1.21, Max/Min = 4/0.
The following shortened forms of presidents names are as follows: J Adams = John Adam: JQ Adams = John Quincy Adams; Ike = Dwight D. Eisenhower, GHW Bush = George Herbert Walker Bush; GW Bush = George W. Bush; A Johnson = Andrew Johnson; LBJ = Lyndon Baines Johnson; Teddy = Theodore Roosevelt; FDR = Franklin Delano Roosevelt; JFK = John F. Kennedy.
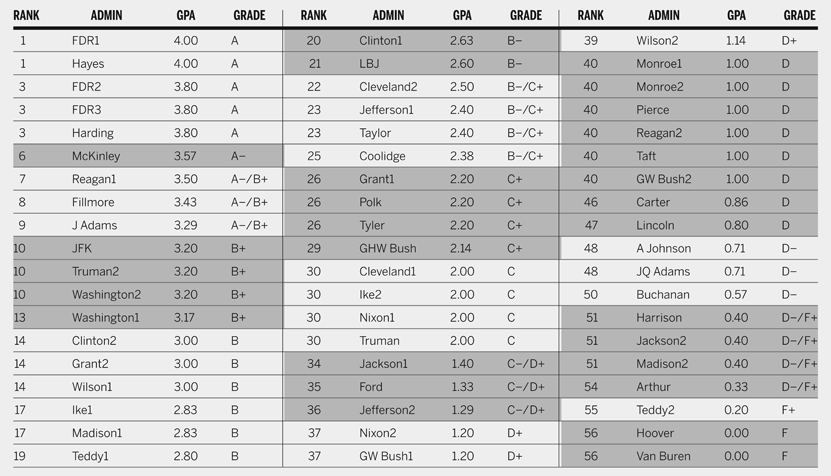
Economic Grades and Rankings of the Administrations*

Notes: Average GPA = 2.00, Standard Deviation = 1.18, Max/Min = 4/0.
* See online appendices for an explanation of the codings of irregular administrations.
A complete explanation of the grading methodology, as well as resolutions of technical issues, is available in the online appendices (at www.mzak.net). There, readers can find technical discussions of issues such as periodization, multicollinearity, cross-algorithm consistency, and data commensurability. Each of these issues was addressed with the goal of minimizing bias and error. Perhaps more importantly, all data used in these rankings are publicly available for readers who prefer to replicate or critique my methods, or to calculate alternative rankings using their own scoring rules, weights, or additional input data. Interested scholars might further address particular presidents who they find to be controversial using historical research or more in-depth statistical methods.
ECONOMIC GPAS AND RANKINGS, 1789–2009
Tables 2 and 3 report the results of this novel rating system of presidential economic performance based solely on quantitative data and generated by the methods described in the Appendices. The first set of ratings awards each president an economic GPA and relative ranking (table 2). The second set awards each separate administration a GPA and relative ranking (table 3). A casual examination of the tables reveals some surprises, such as the high rankings of some traditionally poorly regarded presidents (e.g., Harding, Hayes, and Fillmore) or the relatively low rankings of some national heroes (e.g., Lincoln, Madison, Monroe, JQ Adams, and Jackson). These apparent paradoxes are resolved in the subsequent text. Analysis of the grades and their correlations with other measures (party, veto-players, partisanship, presidential background) are also discussed.
It is tempting to dismiss these rankings as the product of dumb luck: getting elected at the top or bottom of the business cycle. Randomness surely plays some role in these rankings but, as argued previously, presidents also bear responsibility for making their own luck. For example, Van Buren and Hoover did not receive the lowest grades merely by accident of the major economic depressions that struck during their presidencies. For decades before the Panics of 1837 and 1839, Martin Van Buren and his Democratic party eviscerated the very institutions that could have ameliorated the Depression of 1839–1843 that ruined his presidency. Nearly a century later, Republican Herbert Hoover took relatively minor actions in response to the Great Depression, adhering instead to the classical economic beliefs of his time that markets would self-correct and that the federal government had no business providing aid or welfare to individuals. Meanwhile neither Hayes nor FDR simply “lucked out” by entering office near the bottom of a depression. Hayes was an intelligent, adroit administrator who played physician to the plague of scandals and ineptitudes afflicting the preceding Grant administration. Hayes actively attacked corruption, reduced the national debt, restored public credit, and forcefully addressed the new phenomenon of militant labor strikes. Decades later, FDR set unique precedents for government intervention in the economy in his attempts to end the Great Depression. More historical analysis is needed to better resolve the responsibility of each president for his economic performance. Generally speaking, however, this article contends that presidents are neither helpless victims nor lucky lottery winners; hence their economic GPAs should not be dismissed as random draws.
HYPOTHESES
The economic performance GPAs allow us to test for general correlations and thereby generate hypotheses about the relationship between the president and the economy. The variables considered below include political party type, federal veto players, partisanship, war, economic class origins, intelligence and open-mindedness, prepolitical career, birth order, historical greatness, and dark horse versus well-vetted presidents. Notably, this article does not analyze the effects of economic performance on elections, which is covered elsewhere by a vast scholarly literature (Evans and Pickup Reference Evans and Pickup2010; Geys Reference Geys2006; Lewis-Beck, Nadeau, and Elias Reference Lewis-Beck, Nadeau and Elias2008; Lewis-Beck and Stegmaier Reference Lewis-Beck and Stegmaier2000; Nadeau and Lewis-Beck Reference Nadeau and Lewis-Beck2001; Singer Reference Singer2011; Vavreck Reference Vavreck2009). Because correlations cannot show causal mechanism, and do not control for conditional variables, this is a hypothesis generation exercise intended to motivate further research. Each of these observations is also robust to whether only the base data were used (per capita GDP, inflation, balance of payments) or the overall dataset (which includes unemployment, stock market, interest rates, inequality, and currency strength).
The Economy Performs Better under Pro-business Party Presidents
The 21 presidents belonging to parties that favored business interests (Federalists, Whigs, Republicans) had a better average GPA (2.24 vs. 1.82) than did those presidents belonging to parties that were more pro-farmer, pro-labor, or pro-consumer (Democrats-Republicans, Democrats, as well as John Tyler and Andrew Johnson).Footnote 4
A Divided Congress Is Not an Obstacle to a Strong Economy
Just as the president can veto an act of Congress; so too can a stubborn Congress refuse to pass policies supported by the president. Therefore, maybe divisions within or between Congress and the presidency affect economic performance. “Veto players” are defined here as the average of the number of congressional chambers (House, Senate) dominated by a majority party different from that of the sitting president. The range is from zero (the majority of both houses of Congress is the same party as that of the president) to two (the majority of both houses of Congress is a different party than that of the president). Although no general correlation between the number of veto players and economic GPA is seen, some interesting observations are worth reporting. The highest average GPA (2.46) went to the eight administrations in which only one house was dominated by the same party as the president (Washington2, Cleveland1, Cleveland2, Truman1, Ike1, Reagan1, Clinton1, and GW Bush2). Meanwhile, the lowest average GPA (1.06) went to the eight administrations that entered a homogenous federal government, then one house flipped parties while the other remained dominated by the party same as the president's (Polk, Pierce, Buchanan, Grant2, Arthur, Harrison, Taft, and Hoover).Footnote 5 The four administrations that suffered complete party reversals in Congress (from zero or one veto player to two veto players) did not suffer much, enjoying a merely average GPA (2.09) (Tyler, Hayes, Wilson2, and Reagan2).
Partisanship Matters
If we combine veto players with party identification, we can make additional observations. Note, however, that any correlations regarding different party combinations of executive and legislature must be taken with a grain of salt because sample sizes are often small, hence random effects of a particular presidency or time period can be mistaken for systematic effects. For example, the two administrations with a pro-business president and one pro-business house (Washington2, Reagan1) average the highest GPA (3.35). These are followed by the 10 administrations that enjoyed pro-business party (e.g., Federalist, Republican) unity across all branches of government with an average GPA of 2.34 (Washington1, J Adams, Lincoln, Grant1, McKinley, Teddy1, Teddy2, Harding, Coolidge, and GW Bush1). The 16 administrations that enjoyed “not pro-business” (e.g., Democrat) party unity across the government followed next with a slightly above average GPA of 2.17. The 16 administrations during which one house of Congress changes its majority party did poorly. Specifically, the seven Democrat administrations that lost a house during their term scored on average only slightly better (GPA 1.72) than the nine Republican administrations that lost a house during theirs (GPA 1.51). The worst average GPA (1.3) was earned by those two executive-legislature combinations deemed too complex to neatly classify in party terms (Jackson2 and Tyler).
War Aids Economic Performance
Although not a novel finding, the rankings confirm that, on average, wartime administrations have a higher economic GPA (2.36) than “peacetime” administrations (1.88). This comparison used a conservative definition of wartime presidents (Madison1, Polk, Lincoln, McKinley, Wilson2, FDR3, Truman2, JFK, LBJ, Nixon1, GHW Bush, GW Bush1, and GW Bush2). This difference in GPAs was robust to inclusion/exclusion of John Adams' Quasi-War and Nixon's post-Paris Peace Accords military participation in Vietnam. However, more expansive definitions of wartime (for example, to include periods of high external threat) erode this difference in average economic GPAs.
Economic Class Origins
Economic class seems to matter for presidential performance. Two competing classification approaches were used based on subjective judgments of biographical material. In both approaches, presidents raised in middle-class backgrounds averaged the best economic GPAs, while those raised in lower class backgrounds averaged the lowest GPAs. Fourteen presidents can be assigned to the “upper class” of their generation with relative confidence (Washington, Jefferson, Madison, JQ Adams, Tyler, Polk, Taylor, Pierce, Buchanan, Teddy, FDR, JFK, GHW Bush, and GW Bush). Four presidents can be said to have been raised in relatively “lower class” environments (Fillmore, A Johnson, Hoover, and Nixon). Fifteen presidents appear to have been raised in relatively “middle class” environments for their time period (Monroe, Grant, Hayes, Arthur, Cleveland, Harrison, McKinley, Wilson, Harding, Coolidge, LBJ, Ford, Carter, Reagan, and Clinton). The remaining seven presidents are the basis for the two different classification approaches. In one approach, they were all lumped into the middle class. In a second approach, the wealthier were elevated to “upper class” (Taft) and the poorer demoted to “lower class” (Adams, Jackson, Van Buren, Lincoln, Truman, and Ike). In both tabulations the middle class presidents received the highest average GPA (2.12, 2.27), while presidents from the poorest backgrounds received the lowest average GPA (1.59, 1.79). Presidents raised in the wealthiest environments were close to average (2.05, 1.99).
Brains and Open-Mindedness Matter, but Only at the Extremes
In 2006, Dean Simonton used historical and biographical material to estimate the intellectual brilliance and open-mindedness of the US presidents (Simonton Reference Simonton2006). The data suggest that these qualities may matter for economic performance, but only at their extremes. Overall, no substantive correlation between presidents' economic GPA and Simonton's measures of intellectual brilliance (correlation = 0.05) or openness (correlation = 0.01) was found. Indeed, some of the office's most intellectual men, such as JQ Adams and Hoover, received among the lowest economic GPAs; whereas some of the men judged by historians to be relatively unintellectual received quite high economic marks (e.g., Harding, Fillmore). The relation does hold at the extremes, however, where brains may count for something. The top 10 most intellectually brilliant presidents scored a substantially higher average economic GPA (2.24) than the bottom 10 (1.72). Identical observations can be made about openness: correlation at the extremes, but not overall. For example, Madison, JQ Adams, Lincoln, and Carter were all deemed to have been open to new experience and ideas, but they scored poorly on economic performance; whereas Truman and LBJ were fairly closed and stubborn but did well economically. Yet, at the extremes, openness may matter. Although the top 10 most open presidents maintained a merely average economic GPA (2.00), it was significantly higher than that of the 10 least open presidents (1.53).
The President's Resume Doesn't Matter Much
The jobs held by the president prior to entering politics do not appear to matter much for economic performance. Three categories of profession appear to capture roughly 30 presidents before they entered politics: military, law, and agriculture. The six presidents with the most military experience (Washington, Monroe, Jackson, Taylor, Grant, and Ike) scored just above average (2.10). The military men do even better (2.16) if Teddy, JFK, and Ford are allowed to join their ranks. The group of 18 lawyers scored just below average (1.98). The four presidents who arguably spent the most time on the farm (Jefferson, Madison, Carter, and Truman) also scored just below average (1.91). Clearly, this area requires closer study. Due to subjective classification strategy (e.g., Was Harding a “journalist” or “businessman”? What exactly was Teddy Roosevelt's prepolitical career?), job-hopping, dual professions, and changing definitions of work, the classification of a prepresidential “career” is not straightforward, and sample sizes can be small (Uscinski and Simon Reference Uscinski and Simon2012). As an aside, a quick test of birth order revealed no significant differences in economic performance, even when adjusted to count “eldest surviving son” as first-born (Andeweg and Van Den Berg Reference Andeweg and Van Den Berg2003). Note that prior time spent in political office does not much affect presidential performance, nor does coming from “outside the beltway.” There does seem to be a sweet spot, however, in that the 10 presidents with more than two, but less than 10, years of prior experience inside the federal government earned a relatively high average GPA (2.42). Meanwhile the 13 men who spent 10 to 20 years inside the federal government before becoming president earned a relatively low average GPA (1.77).
Historical “Greatness” Doesn't Indicate Economic Success
The most well-known presidential rankings are surveys of experts that judge the executives on overall “greatness” or “leadership” (C-SPAN 2009; Ridings and McIver Reference Ridings and McIver2000; Schlesinger Reference Schlesinger1997; Taranto and Leo Reference Taranto and Leo2005). Only a weak correlation exists between these expert surveys of historical “greatness” and the economic performance rankings reported earlier. The correlations of some of the most prominent expert surveys with the economic performance GPAs are as follows: C-SPAN Historians Survey of Presidential Leadership overall scores, 2009 (0.38),Footnote 6 Federalist Society-Wall Street Journal (0.27),Footnote 7 and Schlesinger Reference Schlesinger1997 (0.29).Footnote 8 Clearly there are tensions between these “greatness” surveys and the economic performance grades reported earlier. To take just one example, Lincoln receives a relatively low economic GPA (1.33), but a perennially high “greatness” ranking. This can be interpreted in multiple ways. First, one could argue that saving the Union and successfully prosecuting the Civil War was far more important than improving the next quarter's GDP. That is, there are more important matters than economic performance. This might explain the overall low correlation between my economic rankings and rankings compiled through surveys of historians. Alternately, this might signal a general lack of consideration of hard economic data by these historians. Are we allowing some presidents to gather impenetrable mantles of “greatness” or “ignobility” that ignores cold hard data? Or perhaps historians might be systematically biased by their field or politics (Evans and Pickup Reference Evans and Pickup2010; Tilley and Hobolt Reference Tilley and Hobolt2011). Finally, one could argue that Lincoln actually made the best moves possible for the US economy. Retaining the South was essential for the economic prosperity of the United States. Such an argument might consider the counterfactual of what US economic performance would look like if the Confederacy had been allowed to leave it.
Dark Horses and Well-Vetted Presidents Perform Equally Well
A new “Leader Filtration Theory” (LFT) of presidential leadership, put forward by management scholar Gautam Mukunda, makes a distinction between “modal” and “outlier” presidents (Mukunda Reference Mukunda2012). Modal presidents are those who have been well vetted by the competitive political system; outliers are those who have not. LFT posits that leaders are chosen in two stages. In the first stage, leaders are selected from a pool of candidates via a filtration process that homogenizes the pool. Examples of presidential filtration include time spent in the House, Senate, as a cabinet member, state governor (nonceremonial), or as a flag officer in the military. Well-filtered leaders are fungible because those who are elected into the presidency are highly similar to those who almost get the job. However, sometimes filtration is abbreviated or bypassed. When this occurs, an outlier leader who is quite different from the potential alternates can gain power. If, as president, an outlier leader faces weak constraints, either from within government or outside it, then “an unfiltered leader can have a very large impact on outcomes. Such leaders are likely to display a high degree of variance in their performance” (Mukunda Reference Mukunda2012, 2). Mukunda codes the following as “outlier” presidents: Washington, Tyler, Polk, Fillmore, Pierce, Lincoln, A Johnson, Grant, Arthur, Cleveland, Harrison, Teddy, Wilson, Harding, Coolidge, FDR, Ike, Carter, and GW Bush.Footnote 9 The economic performance data does not support LFT. No significant difference in economic performance between the twenty-one “modal” and nineteen “outlier” presidents is shown. Their average grades were statistically indistinguishable (modal GPA 2.03, outlier GPA 2.06), while their standard deviations slightly contradicted LFT (modal SD 1.25, outlier SD 1.19). Finally, only four “outlier” presidents appear among the top 10 economic performers, while another four “outliers” appear among the bottom 10. This evidence does not eliminate LFT as a viable theory, but only fails to support its application to short-term economic performance.
WHAT'S THE POINT?
Some readers might be tempted to dismiss this exercise as a bit of intellectual fun with numbers, they should not be so hasty. The economic rankings reported here are not intended to create the impossible (e.g., a perfectly unbiased and error-free ranking of the presidents). Rather, the objective is to eliminate bias and statistical error where possible and to be transparent about that which might remain. If one goal of science is to advance empirical measures through experimentation, then the data-based rankings presented in this article are meant seriously as a step in this evolution.
More importantly, scholars should not err in letting the perfect (or near perfect) be the enemy of the good that these rankings can do: to provoke constructive debate about presidential performance and responsibility. For example, these rankings highlight the fact that even nonpartisan, nonideological decisions about scope and historical context have a subjective component that can affect performance metrics. Economic performance is the product of a multitude of forces and actors. The effects of some of these variables may not be realized for decades. Therefore, any ultimate judgment on an individual president depends on the judge's scope conditions. Thus, it is important for rankings, and their advocates, to be clear about their subjective aspects rather than advance the pretense of objectivity. Because such naïve candidness will likely be infrequent, it is imperative that scholars enter this debate to identify and publicize the nonscientific or biased aspects of agenda-driven rankings.
Another goal of this article is to show that scientific analysis of economic data can be a useful step toward a more objective consensus. Despite the problems with subjectivity, scholars and voters need to thoughtfully debate how much any particular president is responsible for the economy on his watch relative to other actors. Different degrees of institutional responsibility have existed across history. Some scholars argue further that the president's economic advisers can also make an substantial impact on policy, and, hence, performance (Goff Reference Goff2010). Furthermore, ethical judgments need to be made about how to divvy up responsibility between actors, institutions, and environment. Again, all of these have subjective components that can vary across different observers.
The rankings presented here demonstrate one way to approach these problems. Readers are encouraged to dig deeper into history, gather data, try their own rankings, and perhaps use them to consider how they view (and vote for) the president. Put simply, if “it's the economy, stupid,” then we need to make stronger efforts to properly judge economic performance and to assign credit and blame where they are most deserved. These rankings are meant to constitute a scientific step in this direction.
ACKNOWLEDGMENTS
For their help with data, methodology, editing, and framing, much thanks to Peter Brecke, David Campbell, Chris J. Dolan, John Frendreis, James K. Galbraith, Jeffrey Isaac, Gregory Burr Lewis, Peter Lindert, Emmanuel Saez, Ken Sherrill, Raymond Tatalovich, Sean Twombly, Joseph E. Uscinski, Dan Winship, and Scott Winship.